

Biochemical profiling of metabolomics in heavy metal-intoxicated impaired metabolism and its amelioration using plant-based bioactive compound
- PMID: 36330218
- PMCID: PMC9623090
- DOI: 10.3389/fmolb.2022.1029729
Biochemical profiling of metabolomics in heavy metal-intoxicated impaired metabolism and its amelioration using plant-based bioactive compound
Abstract
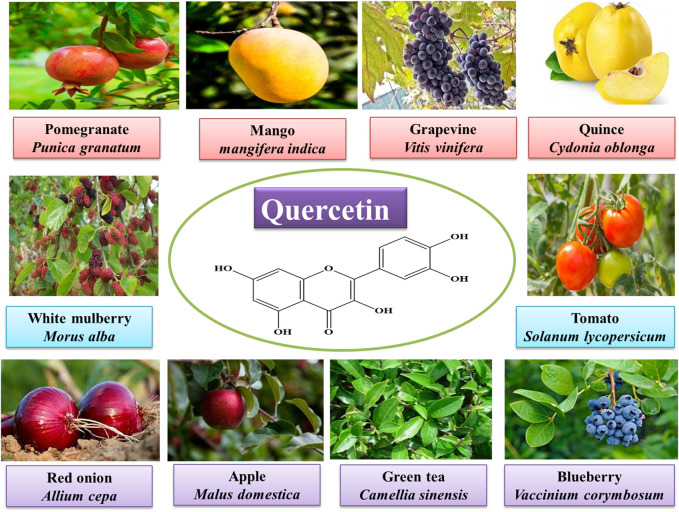
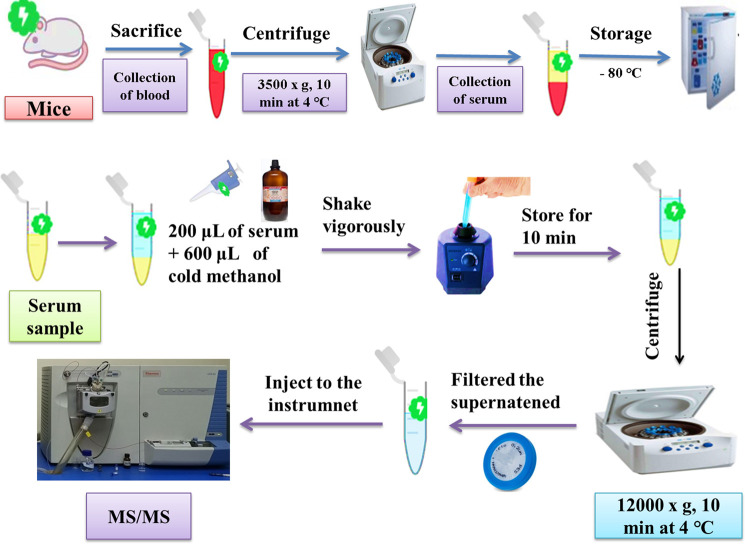
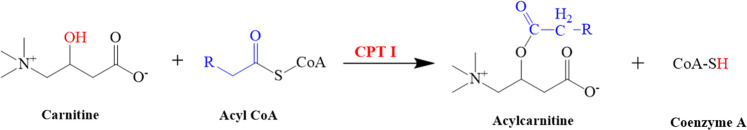
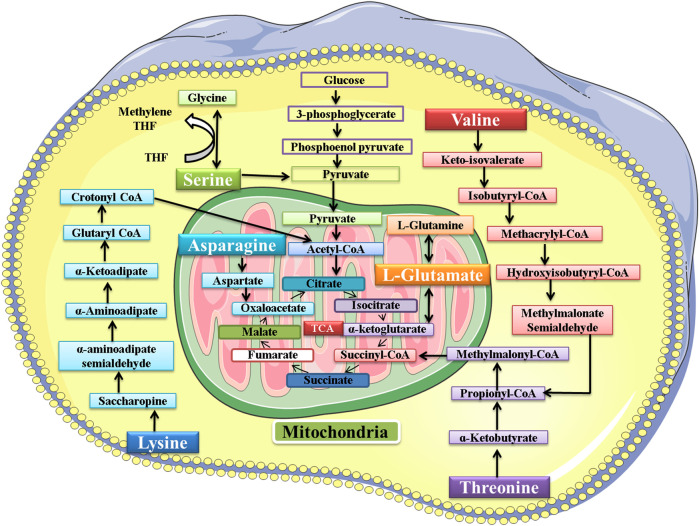
Exposure to Pb is widely spreading and has far-reaching negative effects on living systems. This study aimed to investigate the toxic effects of Pb, through biochemical profiling and the ameliorative effects of quercetin against Pb-toxicity. Twenty-five male Wistar albino mice were divided into the following five groups. The CON-group received normal saline; the Pb-group received PbAc; the Pb + Q-CRN group received lead acetate followed by quercetin; the Q-CRN group received quercetin; and the CRN group received corn oil. After 4 weeks, the mice were euthanized. It was speculated that Pb significantly increased the levels of serine, threonine, and asparagine and decreased the levels of valine, lysine, and glutamic acid in the plasma of Pb-group, thus impairing amino acid metabolism. However, in the Pb + Q-CRN group, the level of these six amino acids was restored significantly due to the ameliorative effect of quercetin. The presence of lipid metabolites (L-carnitine, sphinganine, phytosphingosine, and lysophosphatidylcholine) in mice serum was confirmed by ESI/MS. The GPx, SOD, GSH, and CAT levels were significantly decreased, and the MDA level was significantly increased, thus confirming the oxidative stress and lipid peroxidation in the Pb group. The antioxidant effect of quercetin was elucidated in the Pb + Q-CRN group. Expression of CPT-I, CPT-II, LCAT, CROT, CACT, and MTR genes was significantly upregulated in the liver of Pb goup mice. Hence, the findings of this study proved that Pb exposure induced oxidative stress, upregulated gene expression, and impaired the lipid and amino acid metabolism in mice.
Keywords: amino acid metabolism; gene expression; lead acetate; lipid metabolism; quercetin.
Copyright © 2022 Yaqoob, Rehman, Akash, Alvi and Shoaib.
Conflict of interest statement
The authors declare that the research was conducted in the absence of any commercial or financial relationships that could be construed as a potential conflict of interest.
Figures


Similar articles
-
Determination of Metabolomics Profiling in BPA-Induced Impaired Metabolism.Pharmaceutics. 2022 Nov 17;14(11):2496. doi: 10.3390/pharmaceutics14112496. Pharmaceutics. 2022. PMID: 36432690 Free PMC article.
-
Biochemical profiling of lead-intoxicated impaired lipid metabolism and its amelioration using plant-based bioactive compound.Environ Sci Pollut Res Int. 2022 Aug;29(40):60414-60425. doi: 10.1007/s11356-022-20069-5. Epub 2022 Apr 14. Environ Sci Pollut Res Int. 2022. PMID: 35420345
-
The remedial effect of Thymus vulgaris extract against lead toxicity-induced oxidative stress, hepatorenal damage, immunosuppression, and hematological disorders in rats.Environ Sci Pollut Res Int. 2019 Aug;26(22):22736-22746. doi: 10.1007/s11356-019-05562-8. Epub 2019 Jun 6. Environ Sci Pollut Res Int. 2019. PMID: 31172438
-
Assessment of Role and Efficacy of Curcumin and Quercetin in Preventing Lead-Induced Oxidative Stress in Rats.Indian J Clin Biochem. 2022 Jul;37(3):303-310. doi: 10.1007/s12291-021-01001-z. Epub 2021 Sep 1. Indian J Clin Biochem. 2022. PMID: 35873616 Free PMC article.
-
Metabolomics Analysis and Biochemical Profiling of Arsenic-Induced Metabolic Impairment and Disease Susceptibility.Biomolecules. 2023 Sep 20;13(9):1424. doi: 10.3390/biom13091424. Biomolecules. 2023. PMID: 37759824 Free PMC article.
Cited by
-
Determination of Metabolomics Profiling in BPA-Induced Impaired Metabolism.Pharmaceutics. 2022 Nov 17;14(11):2496. doi: 10.3390/pharmaceutics14112496. Pharmaceutics. 2022. PMID: 36432690 Free PMC article.
-
Persistent Metabolic Changes Are Induced by 24 h Low-Dose Lead (Pb) Exposure in Zebrafish Embryos.Int J Mol Sci. 2025 Jan 26;26(3):1050. doi: 10.3390/ijms26031050. Int J Mol Sci. 2025. PMID: 39940818 Free PMC article.
-
Recent advances in the clinical management of intoxication by five heavy metals: Mercury, lead, chromium, cadmium and arsenic.Heliyon. 2025 Feb 14;11(4):e42696. doi: 10.1016/j.heliyon.2025.e42696. eCollection 2025 Feb 28. Heliyon. 2025. PMID: 40040983 Free PMC article. Review.
-
Metabolomics: a promising tool for deciphering metabolic impairment in heavy metal toxicities.Front Mol Biosci. 2023 Jul 6;10:1218497. doi: 10.3389/fmolb.2023.1218497. eCollection 2023. Front Mol Biosci. 2023. PMID: 37484533 Free PMC article. Review.
References
-
- Akinmoladun A. C., Olaniyan O. O., Famusiwa C. D., Josiah S. S., Olaleye M. T. (2020). Ameliorative effect of quercetin, catechin, and taxifolin on rotenone-induced testicular and splenic weight gain and oxidative stress in rats. J. Basic Clin. Physiol. Pharmacol. 31 (3), 20180230. 10.1515/jbcpp-2018-0230 - DOI - PubMed
LinkOut - more resources
Full Text Sources
Miscellaneous