. 2022 Oct 18:13:1035119.
doi: 10.3389/fpls.2022.1035119. eCollection 2022.

Combined analysis of lipidomics and transcriptomics revealed the key pathways and genes of lipids in light-sensitive albino tea plant (Camellia sinensis cv. Baijiguan)

Affiliations

Combined analysis of lipidomics and transcriptomics revealed the key pathways and genes of lipids in light-sensitive albino tea plant (Camellia sinensis cv. Baijiguan)

Zhe Zhou et al. Front Plant Sci. .

Abstract

Currently, the mechanism by which light-sensitive albino tea plants respond to light to regulate pigment synthesis has been only partially elucidated. However, few studies have focused on the role of lipid metabolism in the whitening of tea leaves. Therefore, in our study, the leaves of the Baijiguan (BJG) tea tree under shade and light restoration conditions were analyzed by a combination of lipidomics and transcriptomics. The leaf color of BJG was regulated by light intensity and responded to light changes in light by altering the contents and proportions of lipids. According to the correlation analysis, we found three key lipid components that were significantly associated with the chlorophyll SPAD value, namely, MGDG (36:6), DGDG (36:6) and DGDG (34:3). Further weighted gene coexpression network analysis (WGCNA) showed that HY5 TF and GLIP genes may be hub genes involved lipid regulation in albino tea leaves. Our results lay a foundation for further exploration of the color changes in albino tea leaves.

Keywords: Camellia sinensis; WGCNA; albino tea plant; light; lipidomics; transcriptomics.


Conflict of interest statement

The authors declare that the research was conducted in the absence of any commercial or financial relationships that could be construed as a potential conflict of interest.

Figures

Figure 1
Figure 1
Leaf color phenotype and the SPAD value of BJG after shading and recovery light treatments. (A) Phenotypic expression and (B) the SPAD value of BJG under natural light (BS0), shading for 1 day (BS1), shading for 2 days (BS2), shading for 4 days (BS4), shading for 3 days then light recovery for 1day (BRL1), and shading for 3 days then light recovery for 3 days (BRL3). Data and error bars are the mean ± SD (n = 5). Different lowercase letters indicate a significant difference between the means at P<0.05.
Figure 2
Figure 2
Unsupervised and supervised multivariate analysis of the detected lipids in BJG. (A) PCA score plot. (B) PLS-DA cross-validation plot.
Figure 3
Figure 3
Overall lipidomics analysis of in BJG. (A) Distribution of each lipid subclass identified. (B) Changes of lipid subclasses in BJG after shading and light recovery treatments. (C) Lipid categories identified in BJG after shading and light recovery treatments. (D) Changes in the content of total polar lipids after shading and light recovery treatments. Data and error bars are the mean ± SD (n = 3). Different lowercase letters indicate a significant difference between the means at P<0.05.
Figure 4
Figure 4
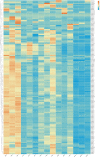
Changes in glycolipids in BJG after shading and light recovery treatments. (A) Changes in MGDG and DGDG contents in BJG after shading and light recovery treatments. (B) The ratio changes in the MGDG (36:6)/MGDG and DGDG (36:6)/DGDG ratios after shading and light recovery treatments. (C) The changes in the MGDG/DGDG ratio after shading and light recovery treatments. (D) The changes in the MGDG/chlorophyll and DGDG/chlorophyll ratios after shading and light recovery treatments. (E) Heatmap of glycolipid changes. Data and error bars are the mean ± SD (n = 3). Different lowercase letters indicate a significant difference between the means at P<0.05. Each colored cell on the map corresponds to the content of different lipid species. Orange color indicates a high content, and blue color indicates a low content.
Figure 5
Figure 5
Heatmap of the changes in glycerophospholipid and lysophospholipid contents in BJG after shading and light recovery treatments. Each colored cell on the map corresponds to the content of a different lipid species. Orange color indicates a high content, and blue color indicates a low content.
Figure 6
Figure 6
Statistical analysis of the differential lipid molecules. (A) Scores (VIP ≥1.0) of lipid species by PLS-DA in BJG. (B) Heatmap of the differential lipid changes in BJG after shading and light recovery treatments. Each colored cell on the map corresponds to the content of different lipid species. Red color indicates high, and blue color indicates low. (C) Correlation network between differential lipid molecules and chlorophyll SPAD value in BJG after shading. (D) Correlation network between differential lipid molecules and chlorophyll SPAD values in BS0 and BRL3. The red line indicates a positive correlation, the blue line indicates a negative correlation, and the darker the color is, the stronger the correlation.
Figure 7
Figure 7
Effects of shading and light restoration on the expression of key genes in the pathway of Glycerolipid metabolism and Glycerophospholipid metabolism in BJG. (A) The expression of key genes in the pathway of glycerolipid metabolism. GPAT, glycerol-3-phosphate O-acyltransferase; plsC, 1-acyl-sn-glycerol-3-phosphate acyltransferase; PLPP, phosphatidate phosphatase; MGD, 1, 2-diacylglycerol 3-beta-galactosyltransferase; DGD, DGDG synthase; GLA, alpha-galactosidase. (B) The expression of key genes in the pathway of glycerophospholipid metabolism. cdsA, phosphatidate cytidylyltransferase; PGS1, CDP-diacylglycerol-glycerol-3-phosphate 3-phosphatidyltransferase; GEP4, phosphatidylglycerophosphatase; LPGAT, lysophosphatidylcholine acyltransferase; pssA, CDP-diacylglycerol-serine O-phosphatidyltransferase; psd, phosphatidylserine decarboxylase; PTDSS2, phosphatidylserine synthase 2; SPLA2, secretory phospholipase A2; LPCAT4, lysophospholipid acyltransferase; plc, phospholipase C; LPCAT1_2, lysophosphatidylcholine acyltransferase/lyso-PAF acetyltransferase; CPT1, diacylglycerol cholinephosphotransferase; PCYT1, choline-phosphate cytidylyltransferase; CKI1, choline kinase; ETNK, thanolamine kinase; PCYT2, ethanolamine-phosphate cytidylyltransferase; EPT1, ethanolaminephosphotransferase; CDIPT, CDP-diacylglycerol-inositol 3-phosphatidyltransferase. Orange color indicates high, and blue color indicates low.
Figure 8
Figure 8
Coexpression analysis networks of lipids related to albino leaf color in BJG. (A) Cluster dendrogram and gene modules after WGCNA analysis. (B) Correlation between five gene modules and the contents of three important lipid contents. (C) Coexpression network of candidate genes in the Memagenta module. (D) Coexpression network of candidate genes in the Meblue module.

References

    1. Afitlhile M., Fry M., Workman S. (2015). The TOC159 mutant of arabidopsis thaliana accumulates altered levels of saturated and polyunsaturated fatty acids. Plant Physiol. Biochem. 87, 61–72. doi: 10.1016/j.plaphy.2014.12.018 - DOI - PubMed
    1. Afitlhile M., Worthington R., Heda G., Brown L. (2021). The TOC159 null mutant of arabidopsis thaliana is impaired in the accumulation of plastid lipids and phosphatidylcholine. Plant Physiol. Biochem. 159, 148–159. doi: 10.1016/j.plaphy.2020.12.011 - DOI - PubMed
    1. Agee A. E., Surpin M., Sohn E. J., Girke T., Rosado A., Kram B. W., et al. . (2010). MODIFIED VACUOLE PHENOTYPE1 is an arabidopsis myrosinase-associated protein involved in endomembrane protein trafficking. Plant Physiol. 152 (1), 120–132. doi: 10.1104/pp.109.145078 - DOI - PMC - PubMed
    1. Benning C. (2009). Mechanisms of lipid transport involved in organelle biogenesis in plant cells. Annu. Rev. Cell Dev. Biol. 25 (1), 71–91. doi: 10.1146/annurev.cellbio.042308.113414 - DOI - PubMed
    1. Block M. A., Dorne A.-J., Joyard J., Douce R. (1983). Preparation and characterization of membrane fractions enriched in outer and inner envelope membranes from spinach chloroplasts. II. biochemical characterization. J. Biol. Chem. 258 (21), 13281–13286. doi: 10.1016/S0021-9258(17)44113-5 - DOI - PubMed