. 2022 Oct;10(19):1057.
doi: 10.21037/atm-22-4068.

Identifying and validating key genes mediating intracranial aneurysm rupture using weighted correlation network analysis and exploration of personalized treatment

Affiliations

Identifying and validating key genes mediating intracranial aneurysm rupture using weighted correlation network analysis and exploration of personalized treatment

Ji Wu et al. Ann Transl Med. 2022 Oct.

Abstract

Background: Intracranial aneurysmal subarachnoid hemorrhage (aSAH) is a dangerous and highly fatal condition if ruptured. Significant advances have been made in the treatment of unruptured intracranial aneurysms (UIAs), but risk assessment methods for early diagnosis of intracranial aneurysm (IA) rupture remain limited.

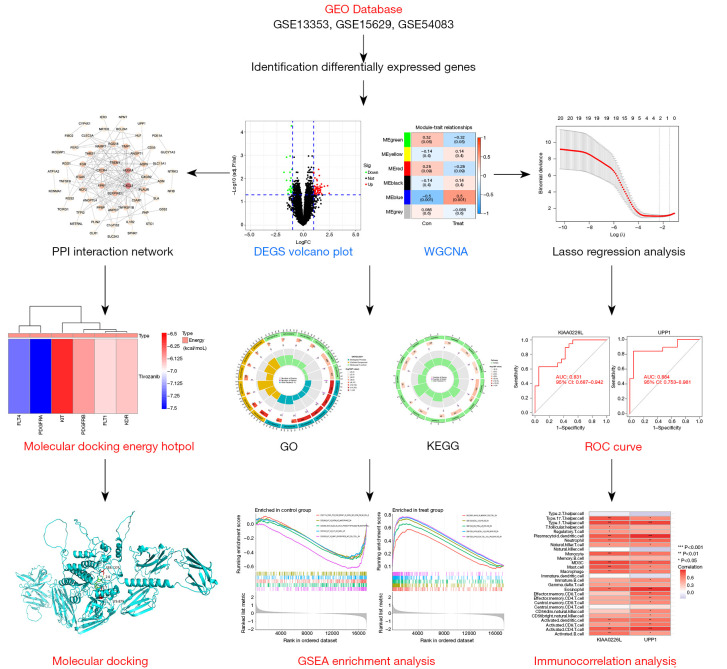
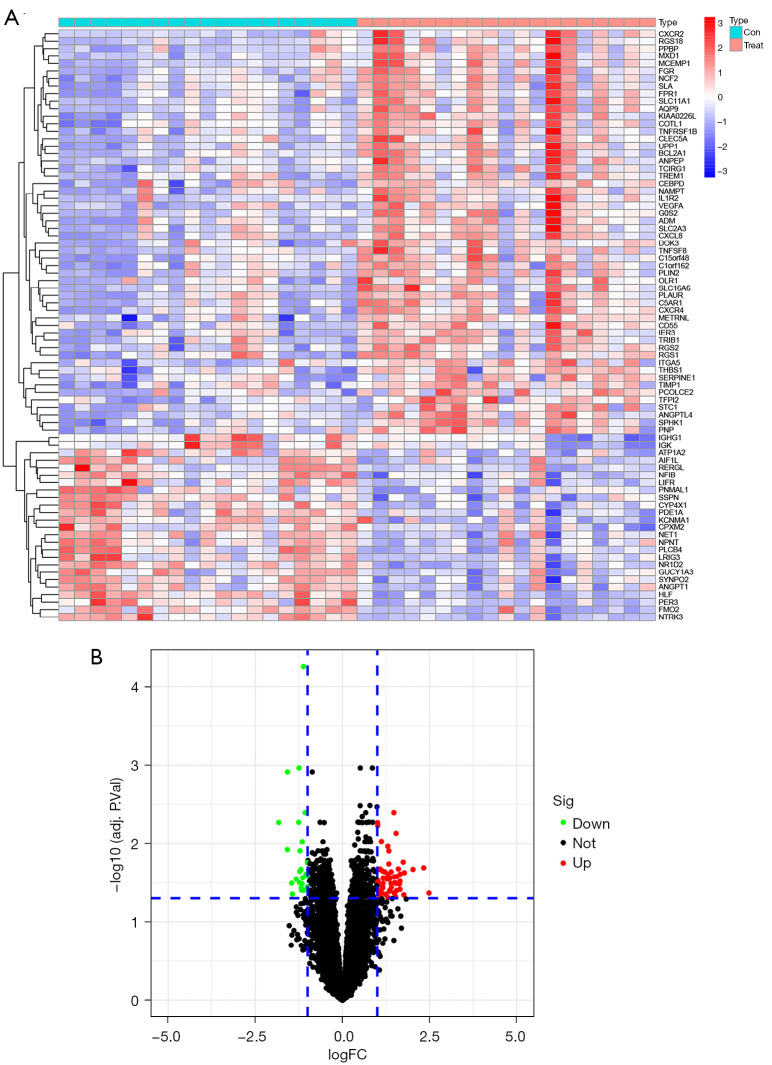
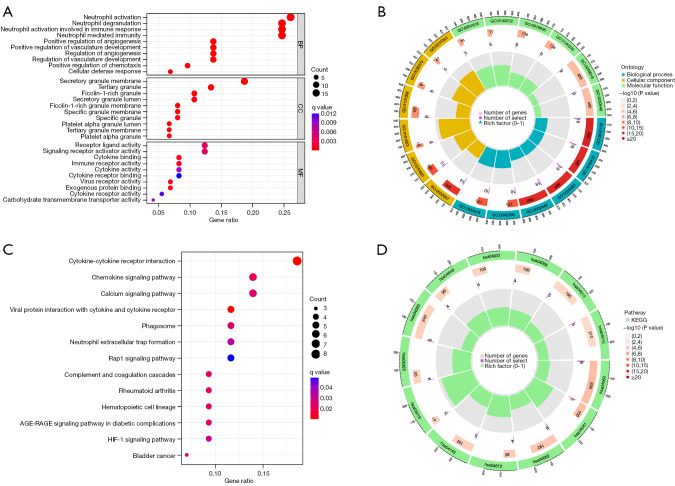
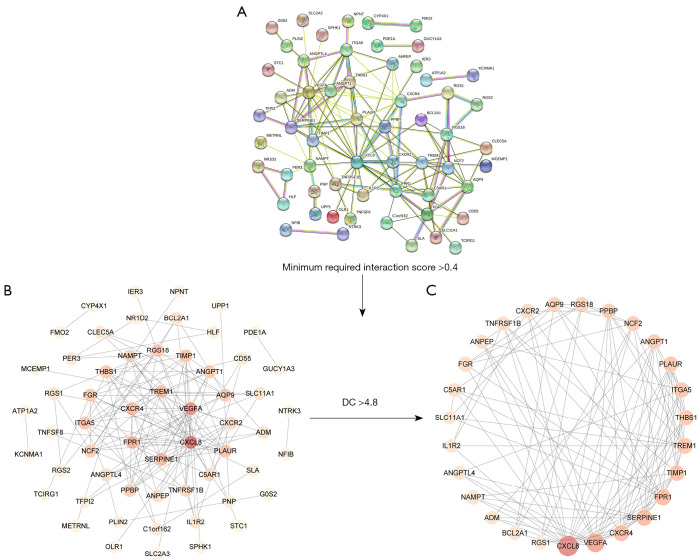
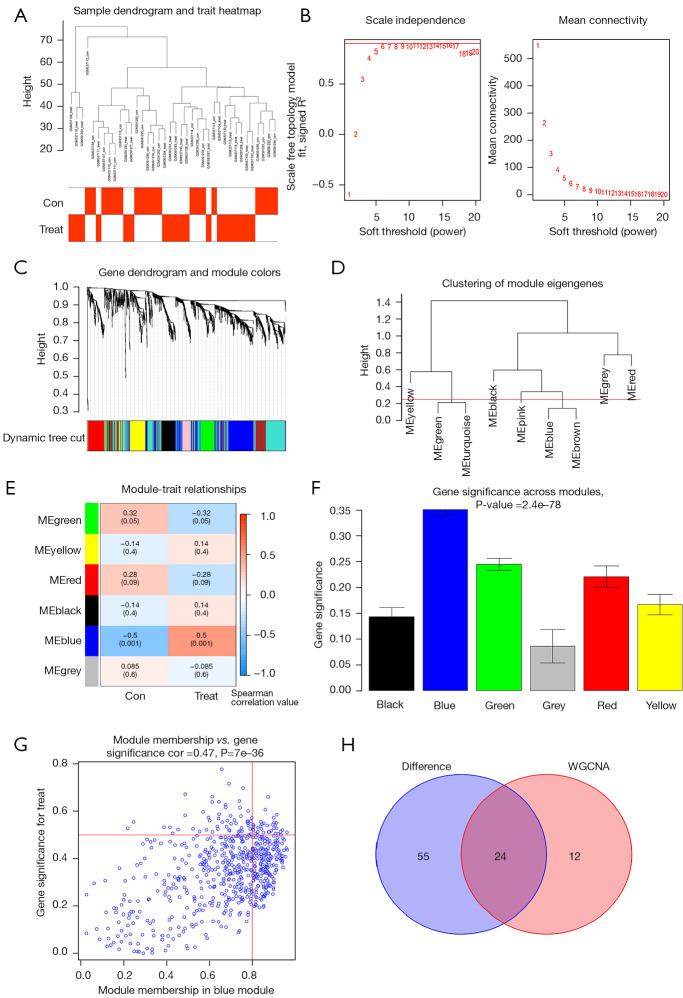
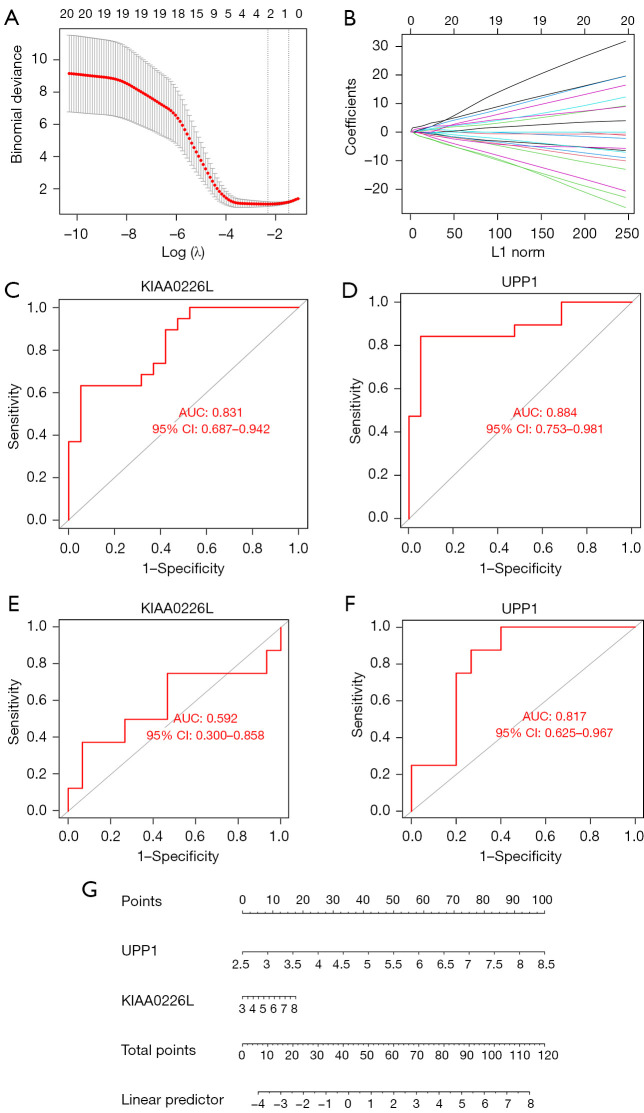
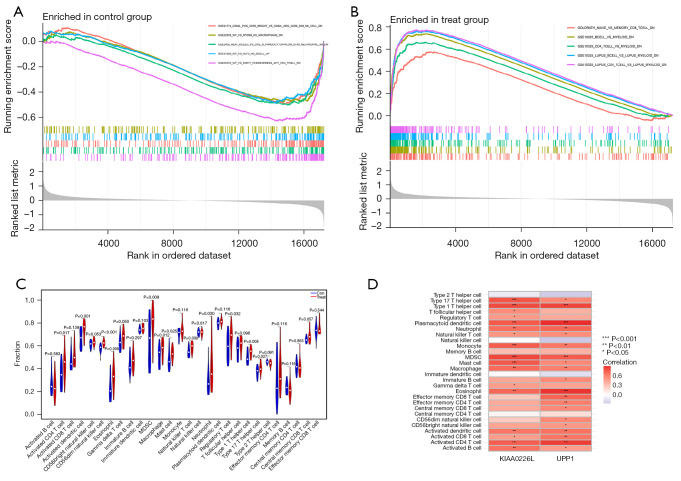
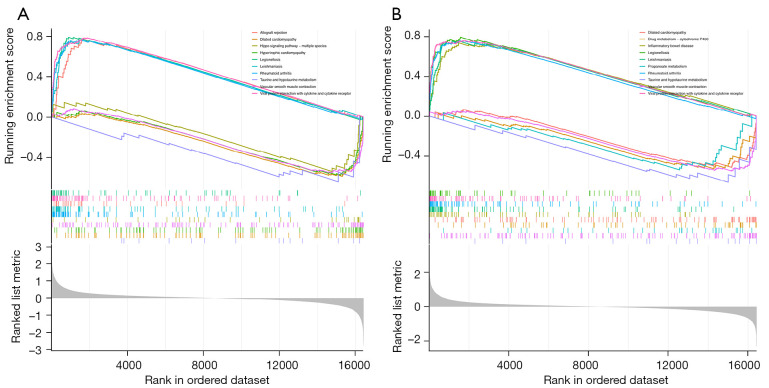
Methods: The datasets of IA GSE13353, GSE15629, and GSE54083 were downloaded through the Gene Expression Omnibus (GEO) database. Differentially expressed genes (DEGs) in unruptured and ruptured aneurysms were identified by R software using methods such as gene set enrichment analysis (GSEA) and weighted gene co-expression network analysis (WGCNA). Gene Ontology (GO) and Kyoto Encyclopedia of Genes and Genomes (KEGG) enrichment analysis were performed on the DEGs, and logistic regression models were used to construct a prediction model to discriminate UIA from healthy samples. We then performed GSEA on the genes in the model, followed by model validation using the GSE54083 dataset. Finally, we used the single-sample (ss)GSEA method to investigate the relationship between the diagnostic model genes and immune cells and immune function.

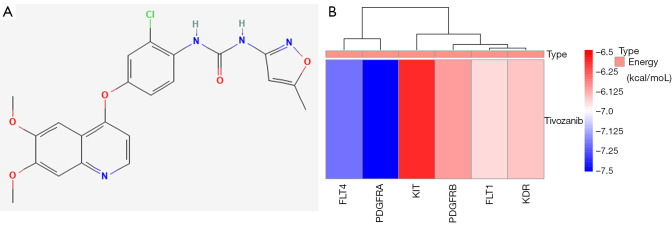
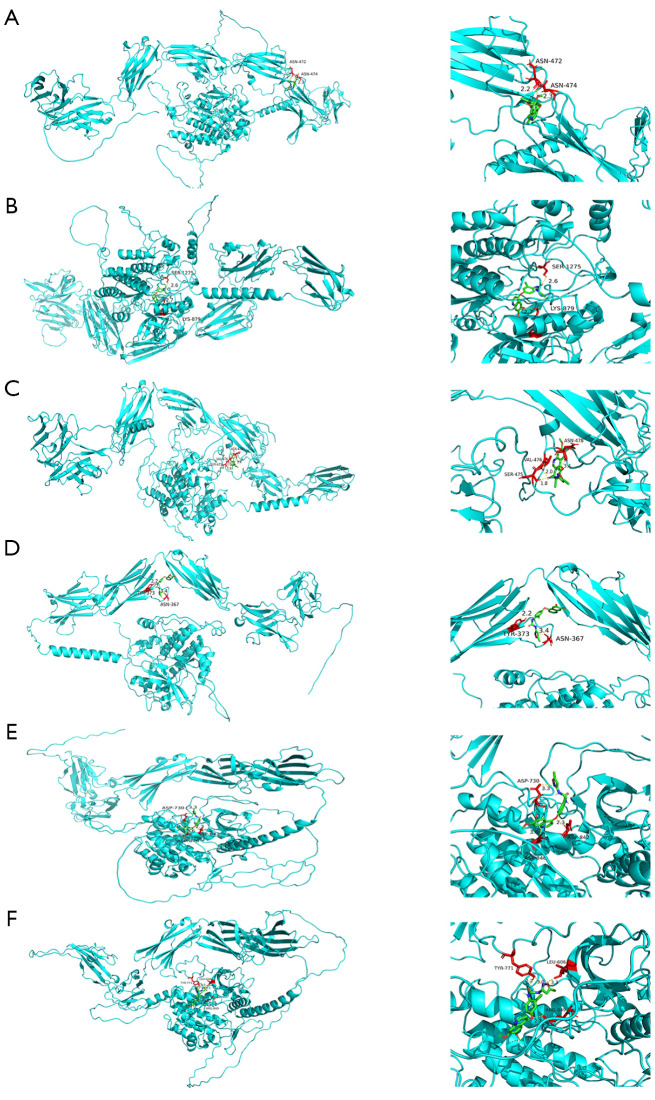
Results: A total of 79 DEGs were obtained in patients with IA rupture compared to unruptured controls. The results of KEGG and GO enrichment analysis showed that neutrophil activation is involved in immune response, neutrophil mediated immunity, and positive regulation of angiogenesis. Interestingly, the results of immunoassays demonstrated that the break in IA may be associated with immune T cells. We used DEGs and WGCNA to determine common genes. The logistic regression model was trained based on 24 intersecting genes, and eventually retained 2 genes, KIAA0226L and UPP1, which we found to be reliable using the validation set, and GSEA revealed that the diagnostic model was associated with the Hippo signaling pathway and vascular smooth muscle contraction, and viral protein interaction with cytokine and cytokine were also associated. Finally explored using the CMap database, Tivozanib could be a potential small molecule drug for the treatment of ruptured intracranial aneurysms (RIAs).

Conclusions: We identified new diagnostic genes associated with IA rupture, which may provide a new way of aneurysm diagnosis.

Keywords: Gene Expression Omnibus (GEO); Intracranial aneurysm (IA); diagnosis; drug therapy; immunoassay.


Conflict of interest statement

Conflicts of Interest: All authors have completed the ICMJE uniform disclosure form (available at https://atm.amegroups.com/article/view/10.21037/atm-22-4068/coif). The authors have no conflicts of interest to declare.

Figures

Figure 1
Figure 1
Flow chart of the systematic analysis of diagnostic genes and pharmacological treatment of RIAs. GEO, gene expression omnibus; PPI, protein-protein interaction; DEG, differentially expressed gene; WGCNA, weighted gene co-expression network analysis; LASSO, least absolute shrinkage and selection operator; GO, Gene Ontology; KEGG, The Kyoto Encyclopedia of Genes and Genomes; AUC, area under the curve; ROC, receiver operating characteristic; RIAs, ruptured intracranial aneurysms.
Figure 2
Figure 2
DEGs in RIA. (A) Heat maps of the top 50 DEGs in RIA; (B) the DEGs volcano plot in RIA. DEGs, differentially expressed genes; RIA, ruptured intracranial aneurysm, logFC, fold change.
Figure 3
Figure 3
Functional RIA analysis of differential genes. (A,B) GO functional enrichment analysis RIA differential genes. (C,D) KEGG functional enrichment analysis of RIA differential genes. The size of the bubble indicates the number of RIA differential genes and the color indicates q-value. BP, biological process; CC, cell components; MF, molecular function; RIA, ruptured intracranial aneurysm; GO, Gene Ontology; KEGG, Kyoto Encyclopedia of Genes and Genomes.
Figure 4
Figure 4
The RIA in DEGs core interaction network. (A) The RIA interaction network of DEGs. (B,C) Core network of DEGs in RIA. The darker the color, the larger the graph, indicating that it is in the core. DC, degree centrality; RIA, ruptured intracranial aneurysm; DEGs, differentially expressed genes.
Figure 5
Figure 5
WGCNA selection module and selection of differential co-expressed genes. (A) Outliers were detected in the sample cluster. (B) The cut-off point was set as 0.9, and the soft threshold power was set as β=17. (C) Tree diagram of all DEGs based on the cluster of difference measurement. The colored bands show the results from the automated monolithic analysis. (D) Correlation diagram between modules obtained by clustering according to inter-gene expression levels. (E) Heat map of the correlation between module characteristic genes and phenotypes. We chose the MEblue module for subsequent analysis (the ordinate value is the correlation coefficient of feature module). (F) Module importance analysis. The horizontal coordinate represents the module gene classification, and the vertical coordinate represents the module gene importance score; the higher the score, the most important module in this clustering. (G) The relevance of the blue module to the disease. The vertical coordinate indicates the importance of the module gene in the disease, and the horizontal coordinate represents the relevance of the module gene to the disease; the higher the score, the most important and relevant module in the disease. (H) The intersection gene of RIA DEGs and the MEblue module. ME, module eigengene; WGCNA, weighted gene co-expression network analysis; DEG, differentially expressed gene; RIA, ruptured intracranial aneurysm.
Figure 6
Figure 6
Logistic regression models can largely distinguish between RIAs and normal samples. (A,B) 5-fold cross-validation of LASSO constructed from 24 intersecting genes. (C,D) ROC analysis of KIAA0226L and UPP1 in the GSE13353 and GSE15629 training set. (E,F) ROC analysis of KIAA0226L and UPP1 in the GSE54083 validation set. (G) A nomogram was constructed to predict the probability of rupture in IA patients. The values of each variable (KIAA0226L and UPP1) are summed to obtain a total score. The probability can be calculated by drawing a vertical line from the total score axis to the probability scale. x-axis: FPR, false positive rate; y-axis: TPR, true positive rate; AUC, area under the curve; LASSO, least absolute shrinkage and selection operator; ROC, receiver operating characteristic; CI, confidence interval; IA, intracranial aneurysm.
Figure 7
Figure 7
Immunogene set analysis of intracranial aneurysms and immune infiltration patterns in RIA and normal conditions. (A) Immunogene set analysis of ruptured intracranial aneurysm samples and (B) immunogene set analysis of UIA samples. (C) Violin plot showing the difference in infiltrating immune cells between the two groups. (D) Heat map of KIAA0226L and UPP1 correlation with immune cells. MDSC, myeloid-derived suppressor cell; RIA, ruptured intracranial aneurysm; UIA, unruptured intracranial aneurysm.
Figure 8
Figure 8
KIAA0226L and UPP1 pathway correlation exploration. (A) GSEA of KIAA0226L in the pathway. (B) GSEA of UPP1 in the pathway. GSEA, gene set enrichment analysis.
Figure 9
Figure 9
Molecular docking energy heat map. (A) The 2D structure of tivozanib. (B) Molecular docking of FLT1, FLT4, KDR, KIT, PDGFRA, and PDGFRB proteins in tivozanib, and the docking energy drawn into a heat map. Red represents high docking energy required, and blue represents low docking energy required, the ordinate value is the energy of docking (kcal/moL).
Figure 10
Figure 10
Core protein docking with tivozanib. The molecules and drugs with the lowest docking energies are visualized in Figure 9. (A-F) Visualization of molecular docking results for FLT1, FLT4, KDR, KIT, PDGFRA, and PDGFRB proteins in tivozanib, in that order. Small molecule drugs and interacting amino acids are red, proteins are blue, their interactions are yellow dotted lines, and numbers are bond lengths.

References

    1. Etminan N, Rinkel GJ. Unruptured intracranial aneurysms: development, rupture and preventive management. Nat Rev Neurol 2016;12:699-713. 10.1038/nrneurol.2016.150 - DOI - PubMed
    1. Zhang Zeyu, Fang Yuanjian, Lenahan Cameron, et al. The role of immune inflammation in aneurysmal subarachnoid hemorrhage. Exp Neurol 2021;336:113535. 10.1016/j.expneurol.2020.113535 - DOI - PubMed
    1. Kanematsu Y, Kanematsu M, Kurihara C, et al. Critical roles of macrophages in the formation of intracranial aneurysm. Stroke 2011;42:173-8. 10.1161/STROKEAHA.110.590976 - DOI - PMC - PubMed
    1. Zhang H, Watanabe R, Berry GJ, et al. Inhibition of JAK-STAT Signaling Suppresses Pathogenic Immune Responses in Medium and Large Vessel Vasculitis. Circulation 2018;137:1934-48. 10.1161/CIRCULATIONAHA.117.030423 - DOI - PMC - PubMed
    1. Cortese J, Rasser C, Even G, et al. CD31 Mimetic Coating Enhances Flow Diverting Stent Integration into the Arterial Wall Promoting Aneurysm Healing. Stroke 2021;52:677-86. 10.1161/STROKEAHA.120.030624 - DOI - PubMed