Review
. 2022 Oct 18:13:993645.
doi: 10.3389/fneur.2022.993645. eCollection 2022.

Neuroimaging features in inflammatory myelopathies: A review

Affiliations
Review

Neuroimaging features in inflammatory myelopathies: A review

Laura Cacciaguerra et al. Front Neurol. .

Abstract

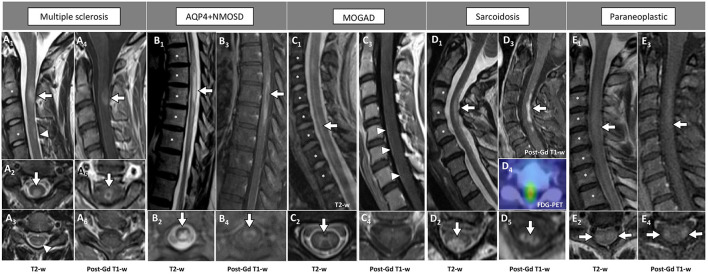
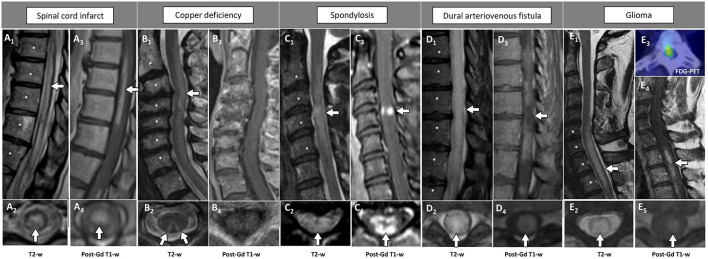
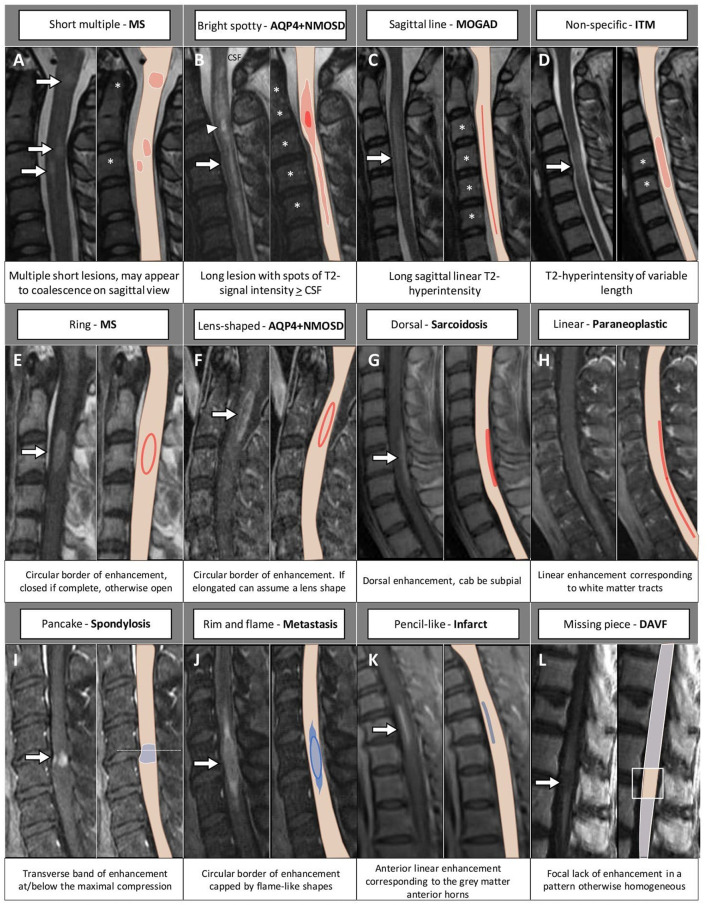
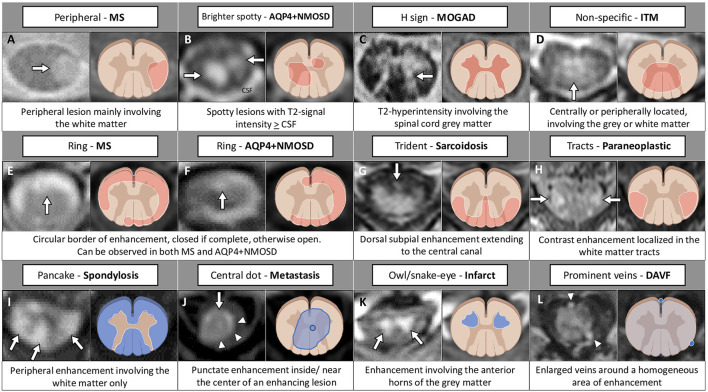
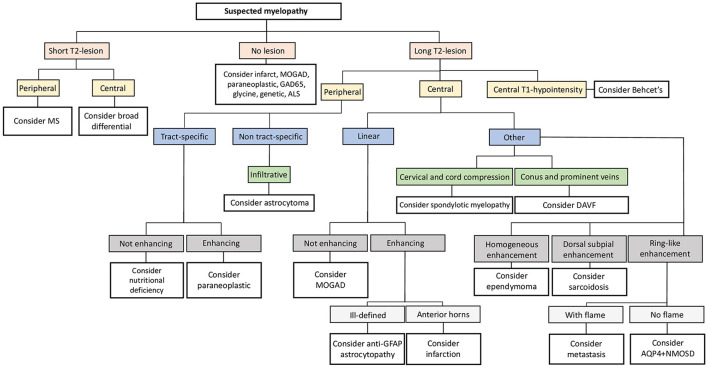
Spinal cord involvement can be observed in the course of immune-mediated disorders. Although multiple sclerosis (MS) represents the leading cause of inflammatory myelopathy, an increasing number of alternative etiologies must be now considered in the diagnostic work-up of patients presenting with myelitis. These include antibody-mediated disorders and cytotoxic T cell-mediated diseases targeting central nervous system (CNS) antigens, and systemic autoimmune conditions with secondary CNS involvement. Even though clinical features are helpful to orient the diagnostic suspicion (e.g., timing and severity of myelopathy symptoms), the differential diagnosis of inflammatory myelopathies is often challenging due to overlapping features. Moreover, noninflammatory etiologies can sometimes mimic an inflammatory process. In this setting, magnetic resonance imaging (MRI) is becoming a fundamental tool for the characterization of spinal cord damage, revealing a pictorial scenario which is wider than the clinical manifestations. The characterization of spinal cord lesions in terms of longitudinal extension, location on axial plane, involvement of the white matter and/or gray matter, and specific patterns of contrast enhancement, often allows a proper differentiation of these diseases. For instance, besides classical features, such as the presence of longitudinally extensive spinal cord lesions in patients with aquaporin-4-IgG positive neuromyelitis optica spectrum disorder (AQP4+NMOSD), novel radiological signs (e.g., H sign, trident sign) have been recently proposed and successfully applied for the differential diagnosis of inflammatory myelopathies. In this review article, we will discuss the radiological features of spinal cord involvement in autoimmune disorders such as MS, AQP4+NMOSD, myelin oligodendrocyte glycoprotein antibody-associated disease (MOGAD), and other recently characterized immune-mediated diseases. The identification of imaging pitfalls and mimics that can lead to misdiagnosis will also be examined. Since spinal cord damage is a major cause of irreversible clinical disability, the recognition of these radiological aspects will help clinicians achieve a correct and prompt diagnosis, treat early with disease-specific treatment and improve patient outcomes.

Keywords: MRI; multiple sclerosis; myelin oligodendrocyte glycoprotein; myelopathies; neuromyelitis optica spectrum disorders; paraneoplastic; transverse myelitis.


Conflict of interest statement

The authors declare that the research was conducted in the absence of any commercial or financial relationships that could be construed as a potential conflict of interest.

Figures

Figure 1
Figure 1
Examples of inflammatory myelopathies on MRI. The extension of the T2-hyperintensities along consecutive vertebral segments is highlighted by asterisks. [(A) MS] Acute short cervical lesion with focal spinal cord swelling [(A1) arrow] involving the central gray matter and the dorsal columns [(A2) arrow], showing homogeneous enhancement on sagittal view [(A4) arrow] and a circular ring of enhancement on axial view [(A5) arrow]. A chronic lesion at the level of C4 is also observed [(A1) arrowhead], located in the dorsal columns [(A3) arrowhead] and not showing contrast enhancement (A6). [(B) AQP4+NMOSD] Thoracic spinal cord lesion, longitudinally extensive on T2-weighted images [(B1) arrow], centrally located [(B2) arrow], showing lens-shaped ring enhancement on sagittal view [(B3) arrow], and inhomogeneous enhancement on axial view [(B4) arrow]. [(C) MOGAD] Cervico-thoracic spinal cord lesion, longitudinally extensive on T2-weighted images characterized by a “sagittal linear” aspect [(C1) arrow] corresponding to a selective involvement of the gray matter (“H-sign”), on axial view [(C2) arrow]. Parenchymal enhancement is absent (C3,C4), although a subtle leptomeningeal enhancement is detected [(C3) arrowheads]. [(D) Sarcoidosis] Cervical spinal cord lesion, longitudinally extensive on T2-weighted images [(D1) arrow] involving the central gray matter and the dorsal columns [(D2) arrow], with dorsal enhancement on sagittal view [(D3) arrow] and “trident sign” on axial view [(D5) arrow]. Increased glucose uptake is also observed, corresponding to an area of red color in the positron-emission tomography (D4). [(E) Paraneoplastic] Cervical spinal cord lesion, longitudinally extensive on T2-weighted images [(E1) arrow] involving the lateral white matter tracts bilaterally [(E2) arrows], showing subtle enhancement on sagittal view [(E3) arrow] and axial view [(E4) arrows]. FDG-PET, 18F-Fluorodeoxyglucose-positron emission tomography; Gd, gadolinium; T2-w, T2-weighted; T1-w, T1-weighted.
Figure 2
Figure 2
Examples of longitudinally extensive spinal cord lesions mimicking inflammatory myelopathies on MRI. The extension of the T2-hyperintensities along consecutive vertebral segments is highlighted by asterisks. [(A) Spinal cord infarct] Thoracic T2-hyperintense spinal cord lesion [(A1) arrow] mainly involving the gray matter [(A2) arrow], with corresponding anterior linear enhancement on sagittal view (A3) and homogeneous enhancement on axial view (A4). [(B) Copper deficiency] Cervical T2-hyperintense spinal cord lesion [(B1) arrow] selectively involving the dorsal columns bilaterally in a rabbit ears configuration [(B2) arrows], not showing concomitant contrast-enhancement (B3,B4). [(C) Spondylosis] Cervical T2-hyperintense spinal cord lesion located right under the level of maximal spinal cord compression [(C1) arrow], diffusively involving the cross-sectional area of the cord [(C2) arrow], showing a transverse area of contrast-enhancement on sagittal view [“pancake sign”, (C3) arrow], corresponding to a peripheral area of contrast enhancement on axial images [(C4) arrow]. [(D) Dural arteriovenous fistula] Thoracic T2-hyperintense spinal cord lesion [(D1) arrow], diffusively involving the cross-sectional area of the cord [(D2) arrow], showing a focal lack of enhancement in an otherwise homogeneous pattern of contrast enhancement on sagittal images [“missing-piece sign”, (D3) arrow], and homogeneous enhancement on axial images [(D4) arrow]. [(E) Glioma] Cervico-thoracic T2-hyperintense spinal cord lesion [(E1) arrow], diffusively involving the cross-sectional area of the cord [(E2) arrow], showing homogeneous contrast enhancement on both sagittal [(E4) arrow], and axial images [(E5) arrow]. Increased glucose uptake is also observed, corresponding to an area of red signal in the positron-emission tomography (E3). FDG-PET, 18F-Fluorodeoxyglucose-positron emission tomography; Gd, gadolinium; T2-w, T2-weighted; T1-w, T1-weighted.
Figure 3
Figure 3
MRI and corresponding schematic representation of key findings on sagittal view of inflammatory myelopathies and their mimics. Each finding, labeled by a letter (A–L), is shown on the most appropriate magnetic resonance imaging sequence (e.g., T2-weighted image in the top row; post-contrast T1-weighted image in the bottom rows), a brief description is provided. The extension of the T2-hyperintensities along consecutive vertebral segments is highlighted by asterisks; red color indicates inflammatory myelopathies, while blue color indicates their mimics. The arrowhead in (B) indicates a bright spotty lesion within a longitudinally extensive T2-hyperintensity. AQP4+NMOSD, aquaporin-4-IgG-positive neuromyelitis optica spectrum disorders; CSF, cerebrospinal fluid; DAVF, dural arteriovenous fistula; ITM, idiopathic transverse myelitis; MOGAD, myelin oligodendrocyte glycoprotein antibody-associated disease; MS, multiple sclerosis.
Figure 4
Figure 4
MRI and corresponding schematic representation of key findings on axial view of inflammatory myelopathies and their mimics. Each finding, labeled by a letter (A–L), is shown on the most appropriate magnetic resonance imaging sequence (e.g., T2-weighted image in the top row; post-contrast T1-weighted image in the bottom rows), a brief description is provided. Red color indicates inflammatory myelopathies, while blue color indicates their mimics. The figure was created with BioRender.com. The arrowheads in (J) highlight a peripheral area of enhancement surrounding the central dot sign; in (L) indicate two veins visible around the area of enhancement. AQP4+NMOSD, aquaporin-4-IgG-positive neuromyelitis optica spectrum disorders; CSF, cerebrospinal fluid; DAVF, dural arteriovenous fistula; ITM, idiopathic transverse myelitis; MOGAD, myelin oligodendrocyte glycoprotein antibody-associated disease; MS, multiple sclerosis.
Figure 5
Figure 5
Neuroimaging approach to the differential diagnosis of suspected myelopathies. Flow-chart summarizing a possible diagnostic approach to suspected myelopathies from an imaging perspective. ALS, amyotrophic lateral sclerosis; AQP4+NMOSD, aquaporin-4-IgG-positive neuromyelitis optica spectrum disorders; DAVF, dural arteriovenous fistula; GAD65, glutamic acid decarboxylase-65; GFAP, glial-fibrillary acidic protein; MOGAD, myelin oligodendrocyte glycoprotein antibody-associated disease; MS, multiple sclerosis.

References

    1. Lopez Chiriboga S, Flanagan EP. Myelitis and other autoimmune myelopathies. Continuum (Minneap Minn). (2021) 27:62–92. 10.1212/CON.0000000000000900 - DOI - PubMed
    1. Flanagan EP. Autoimmune myelopathies. Handb Clin Neurol. (2016) 133:327–51. 10.1016/B978-0-444-63432-0.00019-0 - DOI - PubMed
    1. Valencia-Sanchez C, Flanagan EP. Uncommon inflammatory/immune-related myelopathies. J Neuroimmunol. (2021) 361:577750. 10.1016/j.jneuroim.2021.577750 - DOI - PubMed
    1. Sechi E, Zekeridou A. Neurologic complications of immune checkpoint inhibitors in thoracic malignancies. J Thorac Oncol. (2021) 16:381–94. 10.1016/j.jtho.2020.11.005 - DOI - PubMed
    1. Kunchok A, Aksamit AJ, Davis JM III, Kantarci OH, Keegan BM, Pittock SJ, et al. . Association between tumor necrosis factor inhibitor exposure and inflammatory central nervous system events. JAMA Neurol. (2020) 77:937–46. 10.1001/jamaneurol.2020.1162 - DOI - PMC - PubMed

LinkOut - more resources