. 2022 Oct 18:13:912038.
doi: 10.3389/fimmu.2022.912038. eCollection 2022.

HIV specific CD8+ TRM-like cells in tonsils express exhaustive signatures in the absence of natural HIV control

Affiliations

HIV specific CD8+ TRM-like cells in tonsils express exhaustive signatures in the absence of natural HIV control

Rabiah Fardoos et al. Front Immunol. .

Abstract

Lymphoid tissues are an important HIV reservoir site that persists in the face of antiretroviral therapy and natural immunity. Targeting these reservoirs by harnessing the antiviral activity of local tissue-resident memory (TRM) CD8+ T-cells is of great interest, but limited data exist on TRM-like cells within lymph nodes of people living with HIV (PLWH). Here, we studied tonsil CD8+ T-cells obtained from PLWH and uninfected controls from South Africa. We show that these cells are preferentially located outside the germinal centers (GCs), the main reservoir site for HIV, and display a low cytolytic and a transcriptionally TRM-like profile distinct from blood CD8+ T-cells. In PLWH, CD8+ TRM-like cells are expanded and adopt a more cytolytic, activated, and exhausted phenotype not reversed by antiretroviral therapy (ART). This phenotype was enhanced in HIV-specific CD8+ T-cells from tonsils compared to matched blood suggesting a higher antigen burden in tonsils. Single-cell transcriptional and clonotype resolution showed that these HIV-specific CD8+ T-cells in the tonsils express heterogeneous signatures of T-cell activation, clonal expansion, and exhaustion ex-vivo. Interestingly, this signature was absent in a natural HIV controller, who expressed lower PD-1 and CXCR5 levels and reduced transcriptional evidence of T-cell activation, exhaustion, and cytolytic activity. These data provide important insights into lymphoid tissue-derived HIV-specific CD8+ TRM-like phenotypes in settings of HIV remission and highlight their potential for immunotherapy and targeting of the HIV reservoirs.

Keywords: CD8+ TRM cells; HIV; PD-1; exhaustion; natural HIV control; tonsils.


Conflict of interest statement

AKS reports compensation for consulting and/or SAB membership from Merck, Honeycomb Biotechnologies, Clarity, Repertoire Immune Medicines, Ochre Bio, Third Rock Ventures, Hovione, Relation Therapeutics, FL82, Empress Therapeutics, and Dahlia Biosciences. The remaining authors declare that the research was conducted in the absence of any commercial or financial relationships that could be construed as a potential conflict of interest.

Figures

Figure 1
Figure 1
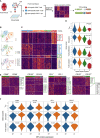
Tonsil CD8+ T-cell resident phenotype and transcriptional signature with distinct in situ location within whole tonsil section. (A) Blood (n= 11) and tonsil (n=18) mononuclear cells pre-gated on CD8+ T-cells by flow cytometry for perforin and granzyme B (GZMB). (B) Expression intensity of CD69, CD103, CXCR5, CD127, PD-1, Perforin and GZMB in multidimensional UMAP space for CD8+ T-cells, gated from total live CD45+ CD3+ T-cells. Peripheral blood (blue), tonsil tissue (orange). (C) Percentage of blood (n=11) and tonsil (n=7) bulk CD8+ T-cells expressing indicated markers. (D) Memory phenotype by CD45RA/CCR7 expression in blood and tonsil CD8+ T-cells. (E) Indicated markers compared in four CD45RA/CCR7 memory populations. (F) Schematic of protocol for scRNAseq of CD8+ T-cells from peripheral blood (n=3) and tonsil (n=2) tissue by Seq-Well S3 with UMAP of 496 CD8+ T-cells coloured by tissue source (bottom). (G) Heatmap of z-scored gene expression of CD8+ T-cells illustrating 440 differentially expressed genes between blood and tonsil with selected genes highlighted (right). (H) Violin plots showing selected genes for cytolytic, transcription factors, tissue-resident memory and immune suppressive markers, expressed in CD8+ T-cells. FDR-adjusted p<0.05; full results can be found in Supplementary Table S1 . (I) Fluorescence immunohistochemistry of whole tonsil section (left) from HIV uninfected donor shown by CD8 and CD4 panels in white box zoomed area (middle) with quantification using 10 unrelated areas identified outside follicles (outside GCs) and within follicular germinal centers (inside GCs) as defined by PD-1 expression. P-values by Kruskal-Wallis corrected for multiple comparisons.
Figure 2
Figure 2
Treated HIV infection drives a tissue resident memory CD8+ T-cell phenotype with high PD-1 expression and distinct in situ tissue locations within HIV infected tonsils. (A) Percentage of blood (n=29, circles) and tonsil (n=44, triangles) CD8+ T-cells expressing CD69, CD103, CXCR5, CD27, CD127, PD-1, GZMB and perforin markers between HIV- (grey), HIV+ART+ (red) and HIV+ART- (orange). P-values were calculated using ordinary one-way ANOVA with horizontal bars representing median values with the level of significance indicated with p-value. (B) Representative FACS plot of CD8+ T-cells from HIV- (grey) and HIV+ART+ (red) HIV+ART- (orange) tonsils (n=29) for co-expression of CD69/CD103 and PD-1/CD127 with cumulative data shown with horizontal bars representing median values and p-values by Kruskal-wallis multiple comparisons. (C) CD127/PD-1 co-expression on indicated CD69/CD103 CD8+ T-cell subsets. (D) CD8, CD69, CD103 fluorescence immunohistochemistry of whole tonsil sections zoomed in at individual GCs for three independent donors from HIV- (left), HIV+ART+ (middle) and HIV+ART- (right) with individual markers shown and plasma viral load in brackets (above) and GCs indicated by dotted white circle. (E) Same as in C but for CD8, HIV-p24 and PD-1.
Figure 3
Figure 3
HIV infection is associated with memory CD8+ T-cell expansion in tonsils. (A) Representative FACS plot of the gating strategy of CD8+ T-cells from tonsil cells to detect naïve, TN (CCR7+CD45RA+), central memory (TCM, CCR7+CD45RA-), effector memory (TEM, CCR7-CD45RA-) and TEMRA (CCR7-CD45RA+). (B) Comparison of memory subset distribution within blood and tonsil CD8+ T-cells for central memory, TCM, Effector memory, TEM, transitional, TEMRA, TNaive with cumulative memory subset distribution of CD8+ T-cells for blood (n=21, circles, left) and tonsil (n=22, triangles, right). (C) Distribution of tonsil central memory (TCM), transitional memory (TEMRA), effector memory (TEM) and naïve subsets within CD127, CD69, PD-1, perforin and GZMB expressing CD8+ T-cells cumulative for all study participants in HIV- (grey), HIV+ART+ (red) and HIV+ART- (orange). P-values calculated using ordinary one-way ANOVA with horizontal bars representing median values with the level of significance indicated above. (D) The frequency of CD103, CD69, CD127, perforin, and GZMB cells measured on PD-1+ (left) and PD-1- (right) CD8+ T-cells from tonsil in HIV+ (red) and HIV- (grey) individuals. P-values calculated using Paired Student’s t-test. Horizontal bars represent median values.
Figure 4
Figure 4
HIV specific CD8+ T-cells express high levels of PD-1 and CD69 compared to CMV- and non-specific CD8+ T-cells in tonsils. (A) Representative FACS plots showing CMV- (top) and HIV-specific (bottom) tetramer stains of blood (left) and tonsil tissue (right) from the same HIV+ individual with indicated markers listed. (B) Heatmap showing expression frequencies for the indicated markers among CD8+ T-cells from CMV tetramer and HIV tetramer specific gated CD8+ T-cells in blood (top) and tonsil (bottom) with frequencies for each tetramer population indicated by the intensity bar below from blue (0%) to red (100%). (C) Frequencies of CD69, CD103, PD-1 and CD127 from HIV-, CMV-, and non-specific (‘CD8’) CD8+ T-cells within blood (n=11, left) and tonsil (n=20, right) matched tissue. P-values calculated using ordinary one-way ANOVA with horizontal bars representing median values with the level of significance indicated above.
Figure 5
Figure 5
Single-cell transcriptional profiling of CD8+ T-cells within HIV infected tonsils reveals heterogenous and distinct subsets grouped by T-cell exhaustion gene set enrichment scores. (A) Workflow of scRNAseq from HIV infected tonsil isolated CD8+ T-cells pre-sorted on HIV-, CMV- and ‘non-specific’ CD8+ T-cells from HIV infected participants (n=3) (see Supplemental Table S2 ). (B) Dimensionality reduction using tSNE on scRNAseq cells coloured by Louvain cluster (top), participant ID (middle), and tetramer specificity (bottom). (C) Heatmap of z-scored gene expression of top differentially expressed genes (t-test) between Louvain clusters from scRNAseq data with cells grouped by Louvain cluster, genes grouped by hierarchical clustering (full gene lists in Supplemental Table S3 ). (D) Gene set enrichment scores for each of the 4 Louvain clusters (0-3) shown for ‘TRM’ (39), ‘Exhaustion’ (70), ‘proliferation’ and ‘activation’ published gene lists (71, 72). (E) Heatmaps of z-scored gene expression of top differentially expressed genes (t-test) between single cells with high and low normalized MFI values of CD69, CD103, PD-1 and CD127. Selected genes labelled in plot, full gene lists in Supplemental Tables S4, S5 . (F) Gene lists from (E) scored against the published gene lists as indicated in D.
Figure 6
Figure 6
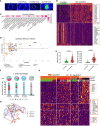
Natural HIV ‘controllers’ display reduced HIV specific CD8+ T-cell cytolytic transcriptional signatures and PD-1 expression compared to viremic ‘non-controllers’ linked to expanded TCR clonotypes. (A) Fluorescence immunohistochemistry of HIV-24 protein (green) for 4 donors of HIV-, HIV+ ‘controller’ and two HIV+ART- ‘non-controllers’ with plasma viral load and absolute blood CD4 counts listed above. (B) Heatmap showing differentially expression of 300 featured genes with selectively specifically expressed genes marked (right) among 1,622 differentially genes ( Supplemental Table S12 ). (C) Selected canonical pathways by Ingenuity Pathway Analyzer (IPA). (D) Upstream drivers of pathways significant by IPA of DEGs. For directionally annotated pathways, a Z-score is calculated to represent up- or downregulation of the driver or pathway. If a driver or pathway is not directionally annotated in IPA, or there are not enough genes in the list to calculate a Z-score, N/A is reported. See Supplemental Table S9 for the full IPA results. (E) Relative fluorescence intensity (RFI) for PD-1 and CXCR5 expression for each HIV specific CD8+ T-cell comparing ‘controller’ and ‘non-controller’ participants. (F) The TCR distribution of KF11-p24, TL9-p24 and LY9-p17 tetramer specific CD8+ T-cells from 27-14-0149, 27-14-0150 and 27-14-0010, respectively (see Supplemental Table S2 ) with unique (n = 1), double (n = 2), triplet (n ≥ 3), and expanded (n ≥ 5) with bars colored in grey, green, pink and blue representing the fraction of cells belonging to groups of clonotypes with either 1, 2, 3-4 or more than five clonotypes, respectively. Pie chart above each bar illustrates the composition of every individual alpha-beta-TCR. (G) tSNE projection of scRNAseq profiled flow-sorted CD8+ T-cells on the lovain clusters (see Figure 5B ) with colored lines connecting cells sharing the same CDR3 sequence. (H) Heatmap of z-scored gene expression of top differentially expressed genes (t-test) between Louvain clusters from scRNAseq data. Cells grouped by expansion of clonotype, genes grouped by hierarchical clustering. Full gene lists in Supplemental Table S10.

References

    1. Gupta RK, Abdul-Jawad S, McCoy LE, Mok HP, Peppa D, Salgado M, et al. . HIV-1 remission following CCR5Δ32/Δ32 haematopoietic stem-cell transplantation. Nature (2019) 568(7751):244–8. doi: 10.1038/s41586-019-1027-4 - DOI - PMC - PubMed
    1. Hutter G, Nowak D, Mossner M, Ganepola S, Mussig A, Allers K, et al. . Long-term control of HIV by CCR5 Delta32/Delta32 stem-cell transplantation. N Engl J Med (2009) 360(7):692–8. doi: 10.1056/NEJMoa0802905 - DOI - PubMed
    1. Connick E, Folkvord JM, Lind KT, Rakasz EG, Miles B, Wilson NA, et al. . Compartmentalization of simian immunodeficiency virus replication within secondary lymphoid tissues of rhesus macaques is linked to disease stage and inversely related to localization of virus-specific CTL. J Immunol (2014) 193(11):5613. doi: 10.4049/jimmunol.1401161 - DOI - PMC - PubMed
    1. Fukazawa Y, Lum R, Okoye AA, Park H, Matsuda K, Bae JY, et al. . B cell follicle sanctuary permits persistent productive simian immunodeficiency virus infection in elite controllers. Nat Med (2015) 21(2):132–9. doi: 10.1038/nm.3781 - DOI - PMC - PubMed
    1. Cohen MS, Chen YQ, McCauley M, Gamble T, Hosseinipour MC, Kumarasamy N, et al. . Prevention of HIV-1 infection with early antiretroviral therapy. N Engl J Med (2011) 365(6):493–505. doi: 10.1056/NEJMc1110588 - DOI - PMC - PubMed

Publication types

Substances