. 2023 Feb 6;13(2):454-473.
doi: 10.1158/2159-8290.CD-22-0535.

Targeting UGCG Overcomes Resistance to Lysosomal Autophagy Inhibition

Affiliations

Targeting UGCG Overcomes Resistance to Lysosomal Autophagy Inhibition

Vaibhav Jain et al. Cancer Discov. .

Abstract

Lysosomal autophagy inhibition (LAI) with hydroxychloroquine or DC661 can enhance cancer therapy, but tumor regrowth is common. To elucidate LAI resistance, proteomics and immunoblotting demonstrated that LAI induced lipid metabolism enzymes in multiple cancer cell lines. Lipidomics showed that LAI increased cholesterol, sphingolipids, and glycosphingolipids. These changes were associated with striking levels of GM1+ membrane microdomains (GMM) in plasma membranes and lysosomes. Inhibition of cholesterol/sphingolipid metabolism proteins enhanced LAI cytotoxicity. Targeting UDP-glucose ceramide glucosyltransferase (UGCG) synergistically augmented LAI cytotoxicity. Although UGCG inhibition decreased LAI-induced GMM and augmented cell death, UGCG overexpression led to LAI resistance. Melanoma patients with high UGCG expression had significantly shorter disease-specific survival. The FDA-approved UGCG inhibitor eliglustat combined with LAI significantly inhibited tumor growth and improved survival in syngeneic tumors and a therapy-resistant patient-derived xenograft. These findings nominate UGCG as a new cancer target, and clinical trials testing UGCG inhibition in combination with LAI are warranted.

Significance: We discovered UGCG-dependent lipid remodeling drives resistance to LAI. Targeting UGCG with a drug approved for a lysosomal storage disorder enhanced LAI antitumor activity without toxicity. LAI and UGCG inhibition could be tested clinically in multiple cancers. This article is highlighted in the In This Issue feature, p. 247.


Conflict of interest statement

Conflict of Interest Statement R.K.A. is an inventor of patents related to dimeric chloroquines. The patents are licensed to Pinpoint Therapeutics, and RKA is a scientific founder. RKA is a consultant for Deciphera and gets research funding from Novartis, Bristol-Myers Squibb, and Pinpoint Therapeutics.

Figures

Figure 1:
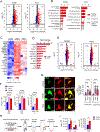
Figure 1:. LAI leads to the accumulation of sphingolipids and cholesterol.
A-D: LC-MS/MS-based proteome analysis of A375P cells treated with DC661 (3 μM) or HCQ (30 μM) for 24 h. All experiments were done in triplicate. A. Volcano plots with significant changes relative to control (FDR<5% and |FC| ≥1.5) highlighted in red (increase) and blue (decrease). B. Ingenuity pathway analysis of elevated proteins (FDR<5% and |FC| ≥1.5) in DC661 or HCQ-treated cells compared with control samples. The black line is set at threshold 3.0 (p<0.001). Chol: Cholesterol; Zym: Zymosterol; Mva: Mevalonate; GGPP: Geranylgeranyldiphosphate; LXR/RXR/FXR: Liver X Receptor/Retinoid X Receptor/Farnesoid X Receptor. C. Heatmap of lipid metabolism proteins significantly elevated (FDR<5% and |FC| ≥1.5); names in bold indicate proteins which were significantly increased by both DC661 and HCQ. D. Fold change in the lipid metabolism proteins significantly elevated by both DC661 (3 μM) and HCQ (30 μM) (FDR<5% and |FC| ≥1.5) in A375P cells. (E-F) LC-MS/MS-based lipidome analysis of A375P cells treated with DC661 (3 μM) or HCQ (30 μM) for 24 h. E. Volcano plots of A375P lipidome showing significant changed lipid species (FDR<5% and |FC| ≥2) highlighted in red (increase) and blue (decrease) induced by DC661 (3 μM) or HCQ (30 μM) treatments for 24 h. F. Mean peak area +/− standard deviation of lipid classes; SM: sphingomyelin, Cer: ceramide: Hex1Cer: hexosylceramide. The number of species detected in each class is indicated below the label. G. Representative images of filipin staining and quantification. A total of at least 50 single cells were counted from multiple images / experimental group (each dot represents a single cell). Merged images show colocalization (yellow arrows) of filipin and lysosomes (LAMP-1) in A375P cells treated with DC661 (1 μM) or HCQ (30 μM) for 24 h. H. Schema for lysosomal purification by immunoprecipitation (Lyso-IP). I. LC-MS/MS lipidome analysis of lysosomes purified from A375P cells treated with vehicle control or DC661 (3 μM) for 24 h. Mean peak area +/− standard deviation of significantly elevated lipid classes, ChE: cholesterol esters. Mean +/− s.e.m. Scale: 10 μm. *P ≤ 0.05; **P ≤ 0.01; ***P ≤ 0.001; ****P ≤ 0.0001. One-way ANOVA followed by Dunnett’s multiple comparisons procedure (F); Welch’s t-test (G); Student’s t-test (I).
Figure 2:
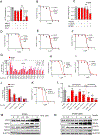
Figure 2:. Inhibition of either cholesterol uptake receptors or sphingolipid salvage pathway enzymes augment DC661 cytotoxicity to A375P cells.
A. MTT assay graph of 3 h pretreatment of 2 mM MBCD followed by addition of DC661 (0.3 μM) or DC661 + water-soluble cholesterol (Chol; 8 μM). B. MTT assay plot with increasing concentrations of DC661 (0.01 to 10 μM), with and without simvastatin. C. MTT assay graph of 2 h pretreatment with Anti-LDL receptor (5 μg/ml) or its isotype control IgG (5 μg/ml) followed by addition of DC661 (0.3 μM). (D-F) Representative MTT assay plots with increasing concentrations of DC661 (0.01 to 10 μM), with and without D, BLT-1, E, Myriocin, and F, Fumonisin B1 (FB1). G. Fold change increase in the average peak area values (3 replicates) of sphingosine (d18:1) ceramide species increased by DC661 and HCQ treatments and synthesized by different isoforms of ceramide synthase (CerS), CerS1–6. H-I. MTT assay plots with increasing concentrations of DC661 (0.01 to 10 μM) with and without H, specific CerS2 inhibitor ST1074 and I, Acid-sphingomyelinase inhibitor, siramesine (Sira). J. Fold change increase in the average total peak area (3 replicates) values of different species of Hex1Cer induced by DC661 and HCQ. K. MTT assay of DC661 (0.01 to 10 μM) with and without UGCG inhibitor, Genz-123346 (Genz). L. Bar graph showing average IC50 values ± s.e.m. of MTT assays from three independent experiments. Dashed line partitions sphingolipid and cholesterol pathways. (M-N) Representative Western blots of whole cell lysates, probed for sphingolipid metabolism proteins and cholesterol uptake receptors whose inhibition significantly augmented DC661 cytotoxicity in MTT assays, after treatment of A375P cells with M, different concentrations of DC661 and N, different durations with DC661 (3 μM). *P ≤ 0.05; **P ≤ 0.01; ***P ≤ 0.001; ****P ≤ 0.0001; ns: non-significant. One-way ANOVA followed by Tukey’s (A, C) or Dunnett’s (L) multiple comparisons procedures.
Figure 3:
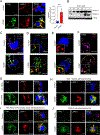
Figure 3:. LAI increases GM1+ membrane microdomains (GMM).
A. Representative confocal images of A375P cells treated with DMSO (vehicle control) or DC661 (1 μM) for 24 h and probed for GM1 with Alexa Fluor 488 labeled cholera toxin-subunit B (CTxB) and lysosome (LAMP-1 antibody); yellow arrows: colocalization. Mean +/− s.e.m. of Mander’s correlation coefficients for colocalization of LAMP-1 over CTxB from three separate image fields with a total of at least 20 cells / group. B. Immunoblot of lysates from A375P cells treated with different concentrations of DC661 for 24 h and probed for flotillin 1 and 2. In panels C-F, A375P cells were treated with DC661 (1 μM) for 24 h. (C-E) Representative high-resolution confocal images (350–500x magnification and deconvolved) of GM1 (CTxB) with C, membrane (Membrite stain), D, flotillin-2 (maximum intensity projection image of 3 planes), and E, LAMP1. F. Super-resolution STED images (400x magnification and deconvolved) of GM1 (CTxB) and LAMP1. G. A375P cells were given PPT1 siRNA or control scrambled siRNA (Scr siRNA) for 72h and labelled for GM1 (CTxB) and lysosomes (LAMP-1); yellow arrow: colocalization. (H-J) Representative confocal images of H, DLD-1, I, MIA PaCa-2 and J, A549 cancer cells treated with DC661 (0.6 μM for DLD-1, 1 μM for MIA PaCa-2 and A549 cells) for 24 h and were labelled for GM1 (CTxB) and lysosomes (LAMP-1); yellow arrow: colocalization. All images are representative of at least two independent experiments. Scale: 10 μm (A, G-J); 5 μm, inset 0.5 μm (C-F). **P ≤ 0.01, Student’s t-test (A).
Figure 4:
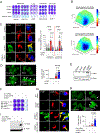
Figure 4:. Chemical or genetic inhibition of UGCG synergistically augments DC661-mediated cytotoxicity and abrogates DC661 induced GMM formation.
A. 7-day colony formation assays in different cancer lines treated with DC661 (0.3 μM for A375P and 0.1 μM for other lines), Genz-123346 (Genz) (5 μM for B16-F10 and A549; 10 μM for A375P, MIA PaCa2 and DLD-1) or their combination. B. BLISS synergy and antagonism 3D plots of human (A375P) and mouse (B16-F10) melanoma cells treated with indicated combinations of Genz and DC661. (C-D) Representative confocal images of A375P cells or A375P-galectin-3-GFP cells treated with DC661 (1 μM), Genz (20 μM), or combination for 24 h. C. GM1 (CTxB) and lysosomes (LAMP-1); yellow arrow: colocalization. Quantification of CTxB intensity from at least 50 single cells / experimental group (each dot represents a single cell). D. A375P-galectin-3-GFP cells with galectin-3 (Gal3) puncta (white arrows) and quantification. E. Immunoblotting for cleaved caspase-3 (c-csp3) in the lysates of A375P cells. (F- I) For UGCG genetic inhibition, A375P cells or A375P-galectin-3-GFP cells were given UGCG siRNA or control scrambled siRNA (Scr siRNA) for 48 h, followed by treatment with either DMSO or DC661 (1 μM) for 24 h. F. Colony formation assay in A375P cells treated with DC661 (0.6 μM), Genz (10 μM), or combination following the UGCG knockdown as shown in the panel. G. Representative confocal images of cells labelled for GM1 (CTxB) and lysosomes (LAMP-1); yellow arrow: colocalization. H. A375P-galectin-3-GFP cells with Gal3 puncta (white arrows) and quantification. I. Immunoblot of c-csp3 in the whole cell lysates of A375P cells. All experiments were repeated at least twice. Scale: 10 μm (C, G), 20 μm (D, H). *P ≤ 0.05; **P ≤ 0.01; ***P ≤ 0.001; ****P ≤ 0.0001; ns: non-significant. Welch’s ANOVA followed by Dunnett’s T3 multiple comparisons procedure (C). In D and H, each dot represents the % of puncta+ cells in an image field, a total of 100 cells were counted / group. We did not observe any significant number of puncta+ cells in Genz, Scr, and UGCG siRNA alone control groups. We excluded control groups and performed a two-tailed t-test between two groups (D and H).
Figure 5:
Figure 5:. UGCG expression in therapy resistance, melanoma cell survival and disease-specific survival of melanoma patients.
(A-F) A375P cells expressing vector (Vector) or a UGCG-DDK plasmid (UGCG) were used. A. Immunoblot in the whole cell lysates confirming overexpression of UGCG. B. 3-day MTT assay with DC661. C. 7-day colony formation assay with DC661 (0.6 μM). In the experiments from D-F, DC661 (3 μM) was used to treat the cells for 24 h. D. GM1 (CTxB) and lysosomes (LAMP-1), and colocalization (yellow). E. Representative images of A375P cells overexpressing UGCG and galectin-3-GFP, white arrows indicate galectin-3 (Gal3) puncta+ cells. F. Immunoblot of cleaved caspase-3 (c-csp3). G. Box plots show the chronos score (cancer dependency) for UGCG knock-out in multiple cancer lines (numbers of cell lines shown in the parenthesis) of different lineages (Y-axis) in The Cancer Dependency Map (DepMap). The cell lines (shown by dots) with chronos score <0 (red line) show UGCG dependency. H. Kaplan–Meier survival curves showing the disease-specific survival (years) of melanoma patients in the Training Dataset (n=211) with low and high UGCG levels. I. Kaplan–Meier survival curves showing the disease-specific survival (years) of melanoma patients (n=130) in the validation dataset with low and high UGCG levels. Scale: 10 μm (D), 20 μm (E). *P ≤ 0.05; **P ≤ 0.01; ***P ≤ 0.001; ****P ≤ 0.0001; ns: non-significant. Two-way ANOVA followed by Tukey’s multiple comparisons procedure (B). Log-rank (Mantel-Cox) test (B).
Figure 6:
Figure 6:. Anti-tumor activity of UGCG inhibition and LAI in immunocompetent mice bearing melanoma tumors.
A. Immunoblots of UGCG in the whole cell lysates from B16-F10 cells treated with different concentrations of DC661 for 24 h. B. MTT assay plot of B16-F10 cells treated with DC661 (0.01 to 10 μM) ± Genz-123346 (Genz). C. Immunoblots of flotillin 1 and 2 in the lysates from B16-F10 cells treated with different concentrations of DC661 for 24 h. D. B16-F10 average tumor volumes ± s.e.m. in different cohorts (n=8) of syngeneic C57BL/6J mice, measured every day following the treatment plan. Adjusted P values are shown for measurements on day 9. E. B16-F10 tumor weights at the end of the experiment. F. Representative pictures of animals from each group with tumors shown in red circles, and isolated tumor pictures from each animal with a scale bar of 3 c.m. G. Percent change in the average body weights in each cohort of tumor-bearing animals with respect to the day 1 of treatment, body weights were measured every two days as shown. H. Representative immunofluorescence images and quantification (mean ± s.e.m.) in the tumor tissue sections labelled for GM1 (CTxB) and lysosome (LAMP-1) with their merged pixels shown in yellow. Each circle in the bar represents an animal and the average intensity of fluorescently labelled CTxB, at least 80 cells were counted / animal. Scale: 50 μm. *P ≤ 0.05; **P ≤ 0.01; ***P ≤ 0.001; ****P ≤ 0.0001; ns, not significant. Two-way ANOVA followed by Tukey’s multiple comparisons procedure (D); Welch’s ANOVA test followed by Dunnett’s T3 multiple comparisons procedure (E); One-way ANOVA followed by Tukey’s multiple comparisons procedure (H).
Figure 7:
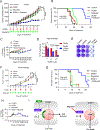
Figure 7:. UGCG inhibition combined with LAI impairs tumor growth in a xenograft and therapy resistant PDX tumor models.
(A-C) A375P tumors were generated in the flanks of NOD-SCID mice, and animals were treated with either vehicle, DC661 (1 mg/kg, every 2 days), eliglustat (60 mg/kg, every day), or the combination as shown in panel A. A. Tumor volumes (mean ± s.e.m.) in different cohorts (n=10–15) measured every day. Adjusted P values are shown for the measurements on day 18. B. Kaplan–Meier survival curves showing the percentage of tumor-bearing animals that survived in different cohorts (n=10–11). Animals were removed from the study when tumor size reached ~2000 mm3. C. Percent change in the average body weights in each cohort of tumor-bearing animals with respect to day 1 of treatment. Body weights were measured every three days, as shown. D. MTT assay graph for PDX-WM4552 cells treated with DC661 (0 to 0.3 μM) alone or in combination with Genz-123346 (Genz, 20 μM). E. 7-day colony formation assay with DC661 (0.1 μM) and Genz (5 μM) in PDX-WM4552 cells. (F-H) PDX-WM4552 tumors were generated in the flanks of NOD-SCID mice. After tumors reached 135 mm3, mice were treated with either vehicle, DC661 (3 mg/kg), eliglustat (30 mg/kg), or the combination as shown in panel F. F. Tumor volumes (mean ± s.e.m.) in different cohorts (n=8–10) measured every day. Adjusted P values are shown for measurements on day 9. G. Kaplan–Meier survival curves showing the percentage of animals that survived in different cohorts (n=6–9). H. Percent change in the average body weights in each cohort of tumor-bearing animals with respect to day 1 of treatment. Body weights were measured every three days, as shown. I. Graphical sketch illustrating that UGCG-dependent lipid remodeling predominantly increases glycosphingolipids (GSL) level, is associated with the increased formation of GMM on plasma membrane and lysosomes. UGCG upregulation is a druggable resistance mechanism to LAI-induced LMP associated cancer cell death. *P ≤ 0.05; **P ≤ 0.01; ***P ≤ 0.001; ****P ≤ 0.0001; ns, not significant. Two-way ANOVA followed by Tukey’s multiple comparisons procedure (A, D and F); Log-rank (Mantel-Cox) test (B and G).

References

    1. Amaravadi RK, Kimmelman AC, Debnath J. Targeting Autophagy in Cancer: Recent Advances and Future Directions. Cancer Discov; 2019;9:1167–81. - PMC - PubMed
    1. Towers CG, Thorburn A. Therapeutic Targeting of Autophagy. EBioMedicine; 2016;14:15–23. - PMC - PubMed
    1. Zoncu R, Perera RM. Built to last: lysosome remodeling and repair in health and disease. Trends Cell Biol; 2022;32:597–610. - PMC - PubMed
    1. Cao M, Luo X, Wu K, He X. Targeting lysosomes in human disease: from basic research to clinical applications. Signal Transduction and Targeted Therapy; 2021;6:1–28. - PMC - PubMed
    1. Rebecca VW, Nicastri MC, Fennelly C, Chude CI, Barber-Rotenberg JS, Ronghe A, et al. PPT1 Promotes Tumor Growth and Is the Molecular Target of Chloroquine Derivatives in Cancer. Cancer Discov; 2019;9:220–29. - PMC - PubMed

Publication types