. 2022 Dec;42(12):1331-1346.
doi: 10.1002/cac2.12383. Epub 2022 Nov 4.

Multiplexed imaging of tumor immune microenvironmental markers in locally advanced or metastatic non-small-cell lung cancer characterizes the features of response to PD-1 blockade plus chemotherapy

Affiliations

Multiplexed imaging of tumor immune microenvironmental markers in locally advanced or metastatic non-small-cell lung cancer characterizes the features of response to PD-1 blockade plus chemotherapy

Fengying Wu et al. Cancer Commun (Lond). 2022 Dec.

Abstract

Background: Although programmed cell death 1 (PD-1) blockade plus chemotherapy can significantly prolong the progression-free survival (PFS) and overall survival (OS) in first-line settings in patients with driver-negative advanced non-small-cell lung cancer (NSCLC), the predictive biomarkers remain undetermined. Here, we investigated the predictive value of tumor immune microenvironmental marker expression to characterize the response features to PD-1 blockade plus chemotherapy.

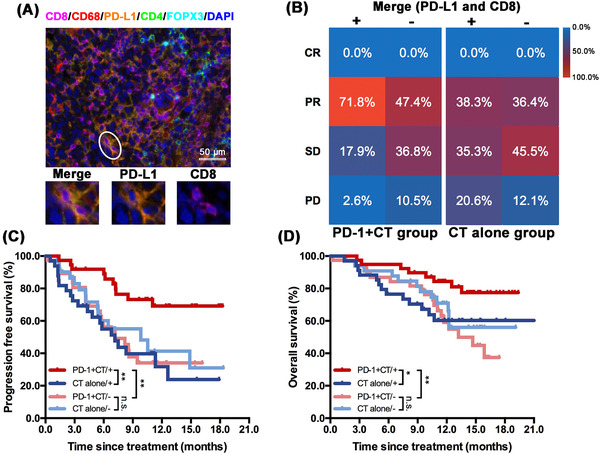
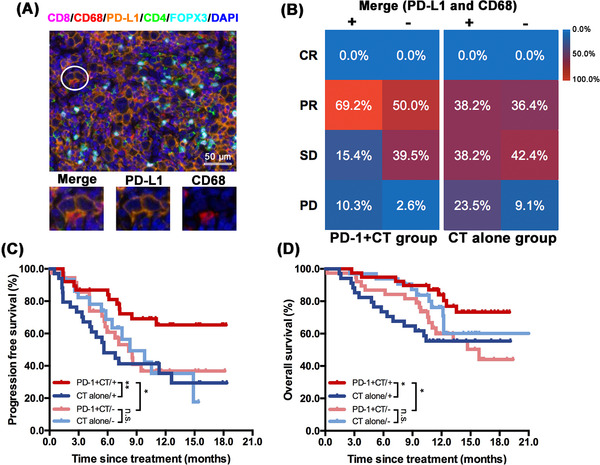
Methods: Tumor tissue samples at baseline were prospectively collected from 144 locally advanced or metastatic NSCLC patients without driver gene alterations who received camrelizumab plus chemotherapy or chemotherapy alone. Tumor immune microenvironmental markers, including PD-1 ligand (PD-L1), CD8, CD68, CD4 and forkhead box P3, were assessed using multiplex immunofluorescence (mIF) assays. Kaplan-Meier curves were used to determine treatment outcome differences according to their expression status. Mutational profiles were compared between tumors with distinct expression levels of these markers and their combinations.

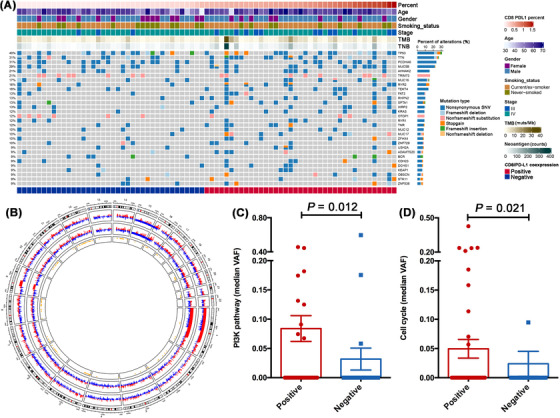
Results: Responders had significantly higher CD8/PD-L1 (P = 0.015) or CD68/PD-L1 co-expression levels (P = 0.021) than non-responders in the camrelizumab plus chemotherapy group, while no difference was observed in the chemotherapy group. Patients with high CD8/PD-L1 or CD68/PD-L1 co-expression level was associated with significantly longer PFS (P = 0.002, P = 0.024; respectively) and OS (P = 0.006, P = 0.026; respectively) than those with low co-expression in camrelizumab plus chemotherapy group. When comparing survival in the camrelizumab plus chemotherapy with chemotherapy by CD8/PD-L1 co-expression stratification, significantly better PFS (P = 0.003) and OS (P = 0.032) were observed in high co-expression subgroups. The predictive value of CD8/PD-L1 and CD68/PD-L1 co-expression remained statistically significant for PFS and OS when adjusting clinicopathological features. Although the prevalence of TP53 or KRAS mutations was similar between patients with and without CD8/PD-L1 or CD68/PD-L1 co-expression, the positive groups had a significantly higher proportion of TP53/KRAS co-mutations than the negative groups (both 13.0% vs. 0.0%, P = 0.023). Notably, enriched PI3K (P = 0.012) and cell cycle pathway (P = 0.021) were found in the CD8/PD-L1 co-expression group.

Conclusion: Tumor immune microenvironmental marker expression, especially CD8/PD-L1 or CD68/PD-L1 co-expression, was associated with the efficacy of PD-1 blockade plus chemotherapy as first-line treatment in patients with advanced NSCLC.

Trial registration: ClinicalTrials.gov NCT03134872.

Keywords: CD68; CD8; Non-small-cell lung cancer; PD-1; tumor immune microenvironment.


Figures

FIGURE 1
FIGURE 1
Correlations between the expression level of tumor immune microenvironmental markers and treatment response in camrelizumab plus chemotherapy group. (A) Study design and representative mIF images of each tumor immune microenvironmental markers, including PD‐L1, CD8, CD68, CD4 and FOXP3. (B) Correlations between each tumor immune microenvironmental markers expression level, including PD‐L1, CD8, CD68, CD4 and FOXP3, and treatment response in patients treated with camrelizumab plus chemotherapy. (C) Correlations between the expression level of five rational combinations of these markers, including CD8/PD‐L1, CD68/PD‐L1, CD4/FOXP3, CD8/CD68/PD‐L1 and CD4/FOXP3/PD‐L1, and treatment response in patients treated with camrelizumab plus chemotherapy. Abbreviations: Responders, patients achieved complete response or partial response; Non‐responders, patients achieved stable disease or disease progression.
FIGURE 2
FIGURE 2
Predictive value of CD8/PD‐L1 co‐expression in camrelizumab plus chemotherapy group. (A) Representative mIF images of CD8/PD‐L1 co‐expression. The white circle refers to the representative area of CD8/PD‐L1 co‐expression in the tumor microenvironment. (B) Comparison of treatment response between patients with high and low CD8/PD‐L1 co‐expression levels (Since some patients had the unconfirmed treatment response and were not included, the percentages did not add up to 100). From dark blue to red, the gradient degree of color represents the values of ORR. (C) PFS comparison of treatment response between patients with high and low CD8/PD‐L1 co‐expression levels. (D) OS comparison of treatment response between CD8/PD‐L1 patients with high and low CD8/PD‐L1 co‐expression levels. *, P < 0.05; **, P < 0.01; ***, P < 0.001. Abbreviations: PFS, progression‐free survival; OS, overall survival; n.s., not significant. PD‐1+CT/+, patients with high CD8/PD‐L1 co‐expression levels received camrelizumab plus chemotherapy. CT/+, patients with high CD8/PD‐L1 co‐expression levels received chemotherapy. PD‐1+CT/−, patients with low CD8/PD‐L1 co‐expression levels received camrelizumab plus chemotherapy. CT/−, patients with low CD8/PD‐L1 co‐expression levels received chemotherapy.
FIGURE 3
FIGURE 3
Predictive value of CD68/PD‐L1 co‐expression in camrelizumab plus chemotherapy group. (A) Representative mIF images of CD68/PD‐L1 co‐expression. The white circle refers to the representative area of CD68/PD‐L1 co‐expression in the tumor microenvironment. (B) Comparison of treatment response between patients with high and low CD68/PD‐L1 co‐expression levels (Since some patients had the unconfirmed treatment response and were not included, the percentages did not add up to 100). From dark blue to red, the gradient degree of color represents the values of ORR. (C) PFS comparison of treatment response between patients with high and low CD68/PD‐L1 co‐expression levels. (D) OS comparison of treatment response between patients with high and low CD68/PD‐L1 co‐expression levels. *, P < 0.05; **, P < 0.01; ***, P < 0.001. Abbreviations: PFS, progression‐free survival; OS, overall survival; n.s., not significant. PD‐1+CT/+, patients with high CD68/PD‐L1 co‐expression levels received camrelizumab plus chemotherapy. CT/+, patients with high CD68/PD‐L1 co‐expression levels received chemotherapy. PD‐1+CT/−, patients with low CD68/PD‐L1 co‐expression levels received camrelizumab plus chemotherapy. CT/−, patients with low CD68/PD‐L1 co‐expression levels received chemotherapy.
FIGURE 4
FIGURE 4
Mutational profiles of tumors from positive and negative CD8/PD‐L1 co‐expression groups. (A) Mutational landscape of tumors with different CD8/PD‐L1 co‐expression levels. (B) Circos plot of CNVs comparison between positive and negative CD8/PD‐L1 co‐expression group. From inside to out: the first circle represents the significantly different genomic region at the corresponding chromosome (orange dot represents the significantly different genomic area); the second circle represents the CNVs of tumors with positive CD8/PD‐L1 co‐expression; the third circle represents the CNVs of tumors with negative CD8/PD‐L1 co‐expression. The outermost cycle represents the chromosomes (number represents the chromosome number; range represents the sequenced base pair length at the chromosome). Read means amplification, and blue means loss or deletion. (C) Comparison of PI3K pathway enrichment between positive and negative CD8/PD‐L1 co‐expression group. (D) Comparison of cell cycle pathway enrichment between positive and negative CD8/PD‐L1 co‐expression group. For pathway enrichment, P value was calculated by the Hypergeometric test. Abbreviations: TMB, tumor mutation burden; TNB, tumor neoantigen burden; SNV, single nucleotide variation; CNV, copy number variation; VAF, variant allelic frequency.

Similar articles

Cited by

References

    1. Grant MJ, Herbst RS, Goldberg SB. Selecting the optimal immunotherapy regimen in driver‐negative metastatic NSCLC. Nat Rev Clin Oncol. 2021;18(10):625–44. - PubMed
    1. Wang M, Herbst RS, Boshoff C. Toward personalized treatment approaches for non‐small‐cell lung cancer. Nat Med. 2021;27(8):1345–56. - PubMed
    1. Zhou F, Qiao M, Zhou C. The cutting‐edge progress of immune‐checkpoint blockade in lung cancer. Cell Mol Immunol. 2021;18(2):279–93. - PMC - PubMed
    1. Gandhi L, Rodriguez‐Abreu D, Gadgeel S, Esteban E, Felip E, De Angelis F, et al. Pembrolizumab plus Chemotherapy in Metastatic Non‐Small‐Cell Lung Cancer. N Engl J Med. 2018;378(22):2078–92. - PubMed
    1. Socinski MA, Jotte RM, Cappuzzo F, Orlandi F, Stroyakovskiy D, Nogami N, et al. Atezolizumab for First‐Line Treatment of Metastatic Nonsquamous NSCLC. N Engl J Med. 2018;378(24):2288–301. - PubMed

Publication types

MeSH terms

Associated data