. 2022 Nov 4:11:e75474.
doi: 10.7554/eLife.75474.

The interpretation of computational model parameters depends on the context

Affiliations

The interpretation of computational model parameters depends on the context

Maria Katharina Eckstein et al. Elife. .

Abstract

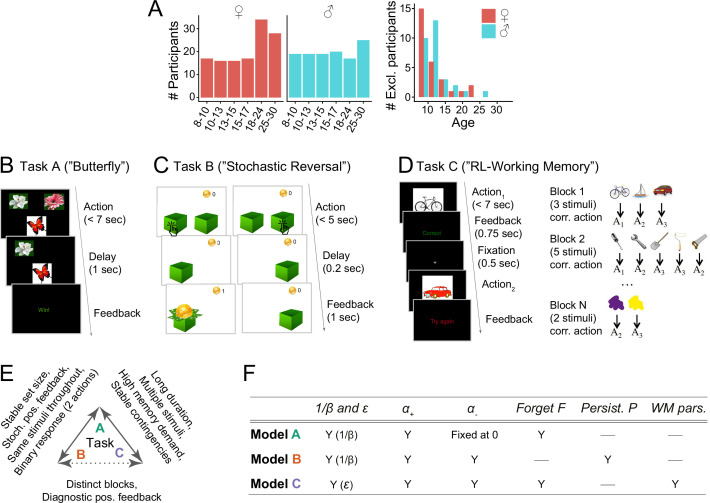
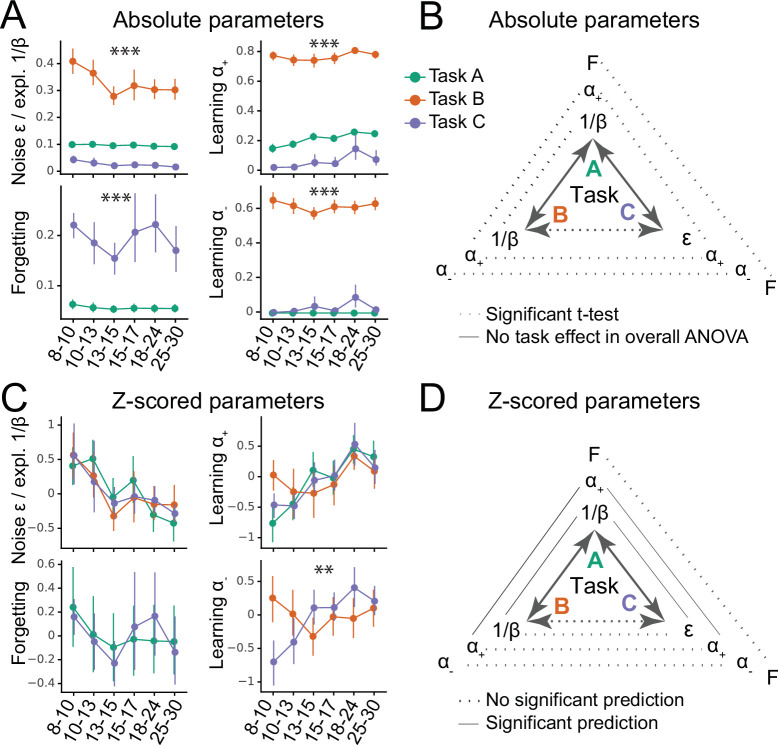
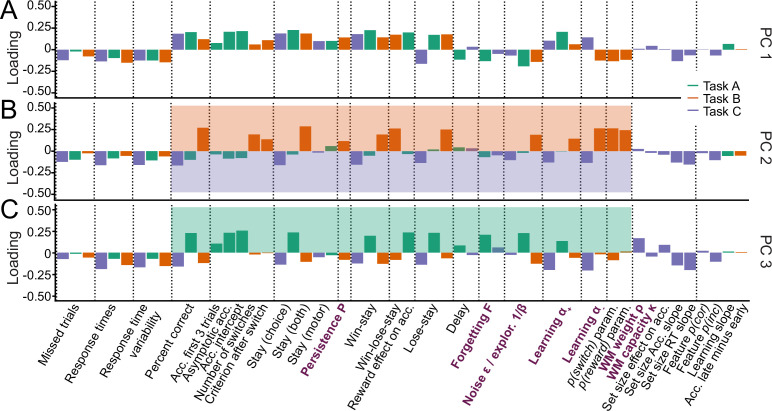
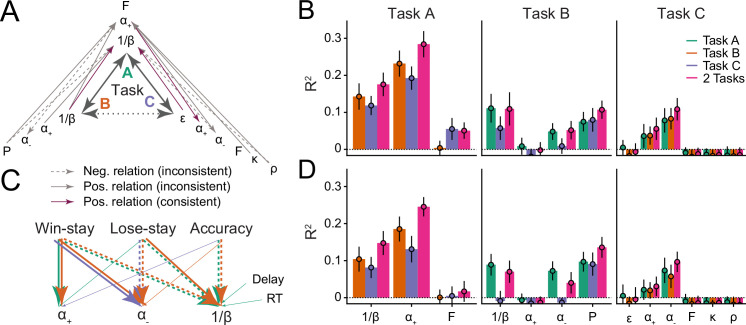
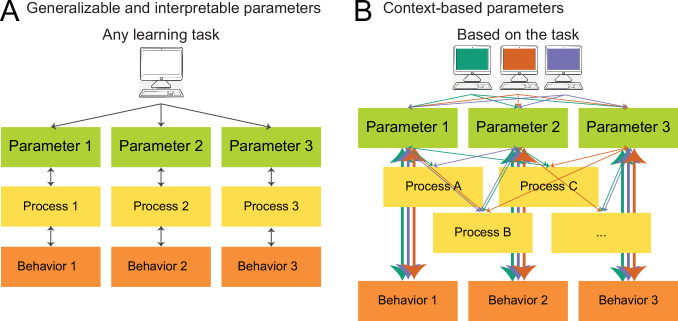
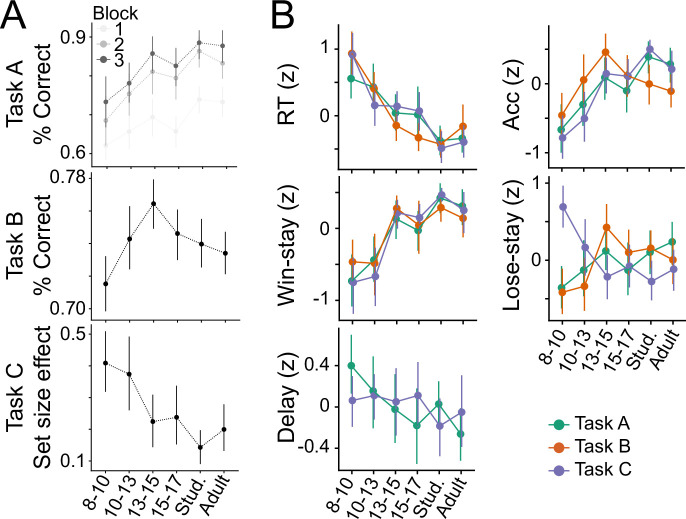
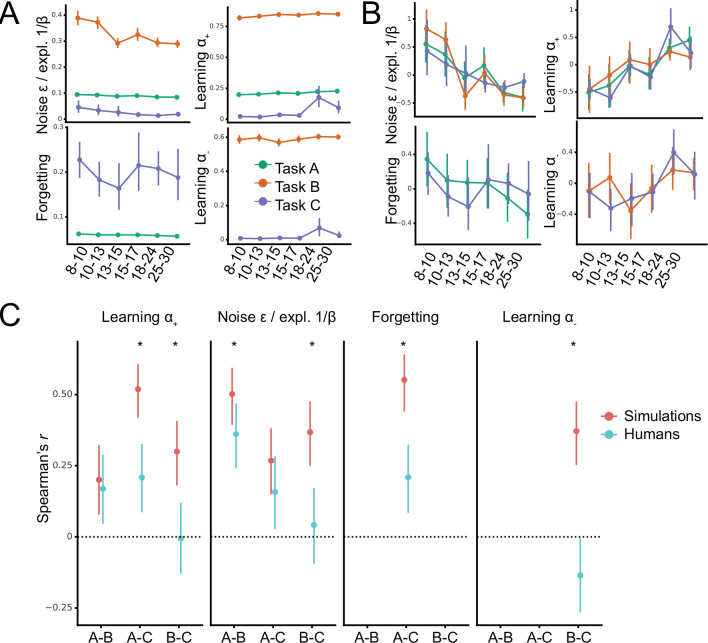
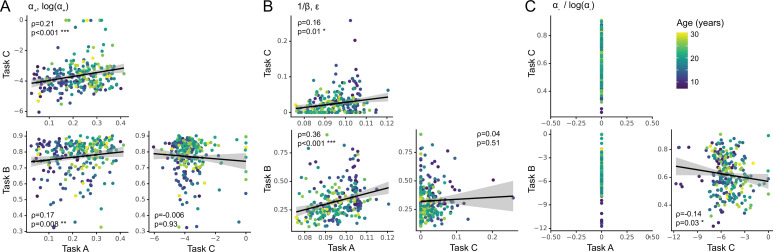
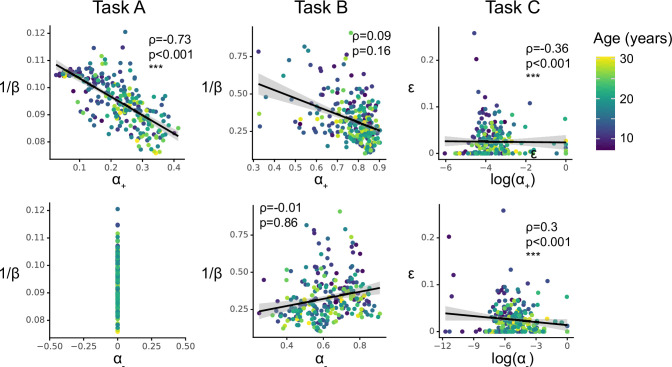
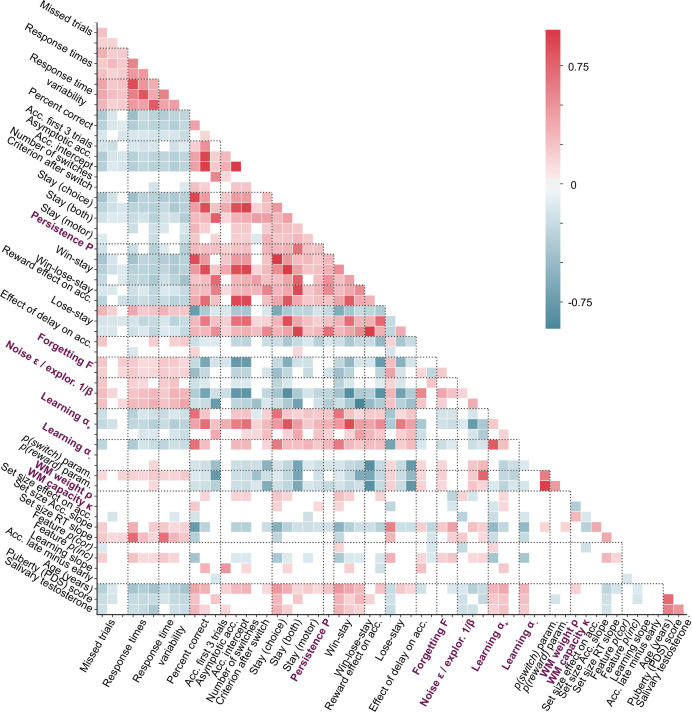
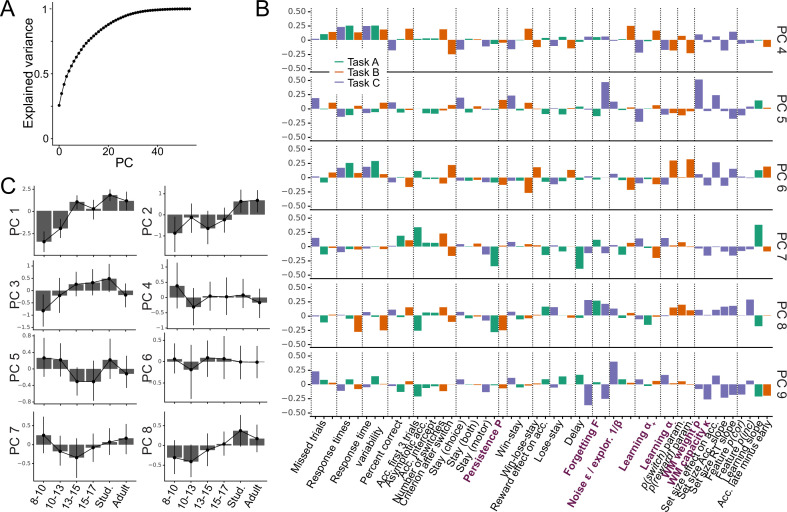
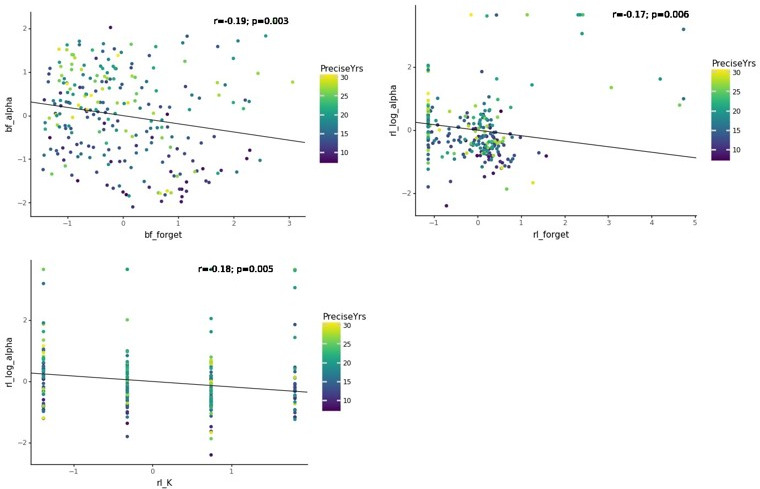
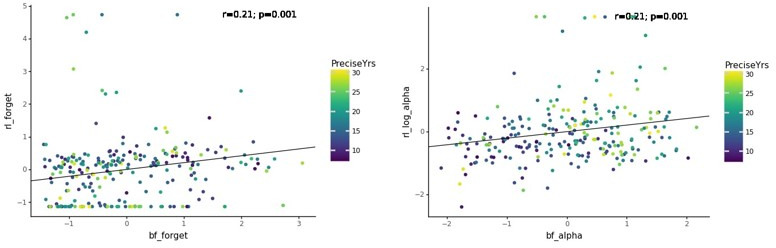
Reinforcement Learning (RL) models have revolutionized the cognitive and brain sciences, promising to explain behavior from simple conditioning to complex problem solving, to shed light on developmental and individual differences, and to anchor cognitive processes in specific brain mechanisms. However, the RL literature increasingly reveals contradictory results, which might cast doubt on these claims. We hypothesized that many contradictions arise from two commonly-held assumptions about computational model parameters that are actually often invalid: That parameters generalize between contexts (e.g. tasks, models) and that they capture interpretable (i.e. unique, distinctive) neurocognitive processes. To test this, we asked 291 participants aged 8-30 years to complete three learning tasks in one experimental session, and fitted RL models to each. We found that some parameters (exploration / decision noise) showed significant generalization: they followed similar developmental trajectories, and were reciprocally predictive between tasks. Still, generalization was significantly below the methodological ceiling. Furthermore, other parameters (learning rates, forgetting) did not show evidence of generalization, and sometimes even opposite developmental trajectories. Interpretability was low for all parameters. We conclude that the systematic study of context factors (e.g. reward stochasticity; task volatility) will be necessary to enhance the generalizability and interpretability of computational cognitive models.

Keywords: Development; Generalizability; Interpretability; cognition; computational biology; computational modeling; human; neuroscience; reinforcement learning; systems biology.


Conflict of interest statement

ME, SM, LX, RD, LW, AC No competing interests declared

Figures

Figure 1.
Figure 1.. Overview of the experimental paradigm.
(A) Participant sample. Left: Number of participants in each age group, broken up by sex (self-reported). Age groups were determined by within-sex age quartiles for participants between 8–17 years (see Eckstein et al., 2022 for details) and 5 year bins for adults. Right: Number of participants whose data were excluded because they failed to reach performance criteria in at least one task. (B) Task A procedure of (‘Butterfly task’). Participants saw one of four butterflies on each trial and selected one of two flowers in response, via button press on a game controller. Each butterfly had a stable preference for one flower throughout the task, but rewards were delivered stochastically (70% for correct responses, 30% for incorrect). For details, see section 'Task design' and the original publication (Xia et al., 2021). (C) Task B Procedure (‘Stochastic Reversal’). Participants saw two boxes on each trial and selected one with the goal of finding gold coins. At each point in time, one box was correct and had a high (75%) probability of delivering a coin, whereas the other was incorrect (0%). At unpredictable intervals, the correct box switched sides. For details, see section 'Task design' and Eckstein et al., 2022. (D) Task C procedure (‘Reinforcement learning-working memory’). Participants saw one stimulus on each trial and selected one of three buttons (A1-A3) in response. All correct and no incorrect responses were rewarded. The task contained blocks of 2–5 stimuli, determining its ‘set size’. The task was designed to disentangle set size-sensitive working memory processes from set size-insensitive RL processes. For details, see section 'Task design' and Master et al., 2020. (E) Pairwise similarities in terms of experimental design between tasks A (Xia et al., 2021), B (Eckstein et al., 2022), and C (Master et al., 2020). Similarities are shown on the arrows connecting two tasks; the lack of a feature implies a difference. E.g., a ‘Stable set size’ on tasks A and B implies an unstable set size in task C. Overall, task A shared more similarities with tasks B and C than these shared with each other. (F) Summary of the computational models for each task (for details, see section 'Computational models' and original publications). Each row shows one model, columns show model parameters. ‘Y’ (yes) indicates that a parameter is present in a given model, ‘—’ indicates that a parameter is not present. ‘1β and ϵ’ refer to exploration / noise parameters; α+ (α-) to learning rate for positive (negative) outcomes; ‘Persist. P’ to persistence; ‘WM pars’. to working memory parameters.
Figure 2.
Figure 2.. Generalizability of absolute parameter values (A–B) and of parameter age trajectories / z-scored parameters (C–D).
(A) Fitted parameters over participant age (binned) for all three tasks (A: green; B: orange; C: blue). Parameter values differed significantly between tasks; significance stars show the p-values of the main effects of task on parameters (Table 1; * p<.05; ** p<.01; *** p<.001). Dots indicate means of the participants in each age group (for n’s, see Figure 1A), error bars specify the confidence level (0–1) for interval estimation of the population mean. (B) Summary of the main results of part A. Double-sided arrows connecting tasks are replicated from Figure 1E and indicate task similarity (dotted arrow: small similarity; full arrow: large similarity). Lines connecting parameters between tasks show test statistics (Table 1). Dotted lines indicate significant task differences in Bonferroni-corrected pairwise t-tests (full lines would indicate the lack of difference). All t-tests were significant, indicating that absolute parameter values differed between each pair of tasks. (C) Parameter age trajectories, that is, within-task z-scored parameters over age. Age trajectories reveal similarities that are obscured by differences in means or variances in absolute values (part A). Significance stars show significant effects of task on age trajectories (Table 2). (D) Summary of the main results of part C. Lines connecting parameters between tasks show statistics of regression models predicting each parameter from the corresponding parameter in a different task (Table 4). Full lines indicate significant predictability and dotted lines indicate a lack thereof. In contrast to absolute parameter values, age trajectories were predictive in several cases, especially for tasks with more similarities (A and B; A and C), compared to tasks with fewer (B and C).
Figure 3.
Figure 3.. Identifying the major axes of variation in the dataset.
A PCA was conducted on the entire dataset (39 behavioral features and 15 model parameters). The figure shows the factor loadings (y-axis) of of all dataset features (x-axis) for the first three PCs (panels A, B, and C). Features that are RL model parameters are bolded and in purple. Behavioral features are explained in detail in Appendix 1 and Appendix 3 (note that behavioral features differed between tasks). Dotted lines aid visual organization by grouping similar features across tasks (e.g. missed trials of all three tasks) or within tasks (e.g. working-memory-related features for task C). (A) PC1 captured broadly-defined task engagement, with negative loadings on features that were negatively associated with performance (e.g. number of missed trials) and positive loadings on features that were positively associated with performance (e.g. percent correct trials). (B–C) PC2 (B) and PC3 (C) captured task contrasts. PC2 loaded positively on features of task B (orange box) and negatively on features of task C (purple box). PC3 loaded positively on features of task A (green box) and negatively on features of tasks B and C. Loadings of features that are negative on PC1 are flipped in PC2 and PC3 to better visualize the task contrasts (section 'Principal component analysis (PCA)').
Figure 4.
Figure 4.. Assessing parameter interpretability by analyzing shared variance.
(A) Parameter variance that is shared between tasks. Each arrow shows a significant regression coefficient when predicting a parameter in one task (e.g. α+ in task A) from all parameters of a different task (e.g. P, α-, α+, and 1β in task B). The predicted parameter is shown at the arrow head, predictors at its tail. Full lines indicate positive regression coefficients, and are highlighted in purple when connecting two identical parameters; dotted lines indicate negative coefficients; non-significant coefficients are not shown. Table 5 provides the full statistics of the models summarized in this figure. (B) Amount of variance of each parameter that was captured by parameters of other models. Each bar shows the percentage of explained variance (R2) when predicting one parameter from all parameters of a different task/model, using Ridge regression. Part (A) of this figure shows the coefficients of these models. The x-axis shows the predicted parameter, and colors differentiate between predicting tasks. Three models were conducted to predict each parameter: One combined the parameters of both other tasks (pink), and two kept them separate (green, orange, blue). Larger amounts of explained variance (e.g., Task A 1β and α-) suggest more shared processes between predicted and predicting parameters; the inability to predict variance (e.g. Task B α+; Task C working memory parameters) suggests that distinct processes were captured. Bars show mean R2, averaged over k data folds (k was chosen for each model based on model fit, using repeated cross-validated Ridge regression; for details, see section 'Ridge regression'); error bars show standard errors of the mean across folds. (C) Relations between parameters and behavior. The arrows visualize Ridge regression models that predict parameters (bottom row) from behavioral features (top row) within tasks (full statistics in Table 6). Arrows indicate significant regression coefficients, colors denote tasks, and line types denote the sign of the coefficients, like before. All significant within-task coefficients are shown. Task-based consistency (similar relations between behaviors and parameters across tasks) occurs when arrows point from the same behavioral features to the same parameters in different tasks (i.e. parallel arrows). (D) Variance of each parameter that was explained by behavioral features; corresponds to the behavioral Ridge models shown in part (C).
Figure 5.
Figure 5.. What do model parameters measure? (A) View based on generalizability and interpretability.
In this view, which is implicitly endorsed by much current computational modeling research, models are fitted in order to reveal individuals’ intrinsic model parameters, which reflect clearly delineated, separable, and meaningful (neuro)cognitive processes, a concept we call interpretability. Interpretability is the assumption that every model parameter captures a specific cognitive process (bidirectional arrows between each parameter and process), and that cognitive processes are separable from each other (no connections between processes). Task characteristics are treated as irrelevant, a concept we call generalizability, such that parameters of any learning task (within reason) are expected to capture similar cognitive processes. (B) Updated view, based on our results, that acknowledges the role of context (e.g. task characteristics, model parameterization, participant sample) in computational modeling. Which cognitive processes are captured by each model parameter is influenced by context (green, orange, blue), as shown by distinct connections between parameters and cognitive processes. Different parameters within the same task can capture overlapping cognitive processes (not interpretable), and the same parameters can capture different processes depending on the task (not generalizable). However, parameters likely capture consistent behavioral features across tasks (thick vertical arrows).
Appendix 3—figure 1.
Appendix 3—figure 1.. Main results of tasks A, B, and C.
(A) Top: In task A, performance increased with age and plateaued in early adulthood, as captured in decreases in decision temperature 1β and increases in learning rate α (Xia et al., 2021). Performance also increased over task time (blocks). Middle: In task B, performance showed a remarkable inverse U-shaped age trajectory: Performance increased markedly from early childhood (8–10 years) to mid-adolescence (13-15), but decreased in late adolescence (15-17) and adulthood (18-30) (Rosenbaum et al., 2020). Bottom: Task C showed that the effect of set size on performance (regression coefficient) decreased with age, which was captured by increases in RL learning rate, but stable WM limitations (Master et al., 2020). (B) Main behavioral features over age; colors denote task; all features are z-scored. Some measures (e.g. response times [RT], win-stay choices) were consistent across tasks, while others (e.g. accuracy [Acc.], lose-stay choices) showed significant differences (see Table Appendix 6—table 1).
Appendix 4—figure 1.
Appendix 4—figure 1.. Behavioral validation of the winning model for each task.
(A) Task A. The left figure shows performance (y-axis; probability of correct choice) over time on the task (x-axis; trial number). The right figure shows the average performance for each age group (in years). Red indicates human data, and blue indicates simulations from the winning model, based on best-fitting parameters. The close match between the red and blue datapoints indicates good model fit. (A) is reproduced from Figure 2 from Xia et al., 2021. (B) Task B. The top figure shows performance (y-axis; percentage of correct choices) aligned to switch trials (x-axis; i.e., trial on which the correct box switches sides), separately for male and female participants. The bottom figure shows another behavioral measures, the probability of repeating the same choice (y-axis; ‘% stay’) based on the previous outcome history (x-axis; ‘+ +’: two rewards in a row; ‘- +’: no reward followed by reward; etc.), separately for male and female participants. Colors indicate participant age. The columnwise panels compare human behavior (left) to simulated behavior of the winning RL model (right). The close correspondence between human and simulated model behavior indicates good model fit. (B) is reproduced from Figure 4 from Eckstein et al., 2022. (C) Task C. Each figure shows human performance (y-axis; percentage of correct trials) over time (x-axis; number of trials for each stimulus), with colors differentiating age groups. The two rows show blocks of different set sizes (top: set size of two stimuli per block; bottom: set size of five). The left two figures show human behavior, the right two show model simulations. (C) is reproduced from Figure 3C from Master et al., 2020.
Appendix 5—figure 1.
Appendix 5—figure 1.. Comparison of human parameter correlations to generalization ceiling.
(A–B) Same as Figure 2A and B, but for simulated agents with perfect generalization, rather than humans. (C) Parameter correlations (dots) for each pair of tasks (x-axis), with bootstrapped 95% confidence intervals (error bars). Stars indicate significance at the level of p=0.05, that is, the human correlation coefficient is not contained within the confidence interval of the corresponding simulated correlation coefficient.
Appendix 8—figure 1.
Appendix 8—figure 1.. Between-task parameter correlations.
(A) Parameter α+ across tasks (log(α+) in task C). (B) Parameters 1β (task A, B) and ϵ (task C). (C) Parameter α- across tasks (log(α-) in task C). Same conventions as in Fig. Appendix 8—figure 2.
Appendix 8—figure 2.
Appendix 8—figure 2.. Within-task parameter correlations, focusing on learning rates (x-axes) and exploration / noise parameters (y-axes).
Each column shows one task. Each dot in the scatter plots refers to a participant, colors indicates age. Inserted are Spearman correlation statistics.
Appendix 8—figure 3.
Appendix 8—figure 3.. Full Spearman correlation matrix of all features in the dataset.
Feature order is the same as in Figure 3. Deeper red (blue) colors indicate stronger positive (negative) correlations in terms of Spearman’s ρ (see color legend). Only correlations with p-values are shown; remaining squares are left blank.
Appendix 8—figure 4.
Appendix 8—figure 4.. Additional PCA results.
(A) Cumulative variance explained by all PCs of the PCA (Figure 3; 2.2.1). The smooth, non-stepped function does not provide evidence for lower-dimensional structure within the dataset. (B) Feature loadings (weights) of PC4-PC9. Loadings are flipped based on their relation to task performance, like for PC2-PC3 in Figure 3. (C) Age trajectories of the top 8 PCs, by age group. Corresponding statistics in Appendix 8—table 1.
Author response image 1.
Author response image 2.
Author response image 3.
Author response image 4.

References

    1. Abdi H, Williams LJ. Principal component analysis. Wiley Interdisciplinary Reviews: Computational Statistics. 2010;2:433–459. doi: 10.1002/wics.101. - DOI
    1. Adams RA, Huys QJM, Roiser JP. Computational psychiatry: towards a mathematically informed understanding of mental illness. Journal of Neurology, Neurosurgery, and Psychiatry. 2016;87:53–63. doi: 10.1136/jnnp-2015-310737. - DOI - PMC - PubMed
    1. Ahn WY, Busemeyer JR. Challenges and promises for translating computational tools into clinical practice. Current Opinion in Behavioral Sciences. 2016;11:1–7. doi: 10.1016/j.cobeha.2016.02.001. - DOI - PMC - PubMed
    1. Behrens TEJ, Woolrich MW, Walton ME, Rushworth MFS. Learning the value of information in an uncertain world. Nature Neuroscience. 2007;10:1214–1221. doi: 10.1038/nn1954. - DOI - PubMed
    1. Berridge KC. The debate over dopamine ’ S role in reward: the case for incentive salience. Psychopharmacology. 2007;191:391–431. doi: 10.1007/s00213-006-0578-x. - DOI - PubMed

Publication types