. 2022 Nov 11;7(77):eabl9925.
doi: 10.1126/sciimmunol.abl9925. Epub 2022 Nov 4.

CD103 fate mapping reveals that intestinal CD103- tissue-resident memory T cells are the primary responders to secondary infection

Affiliations

CD103 fate mapping reveals that intestinal CD103- tissue-resident memory T cells are the primary responders to secondary infection

Helen Y Fung et al. Sci Immunol. .

Abstract

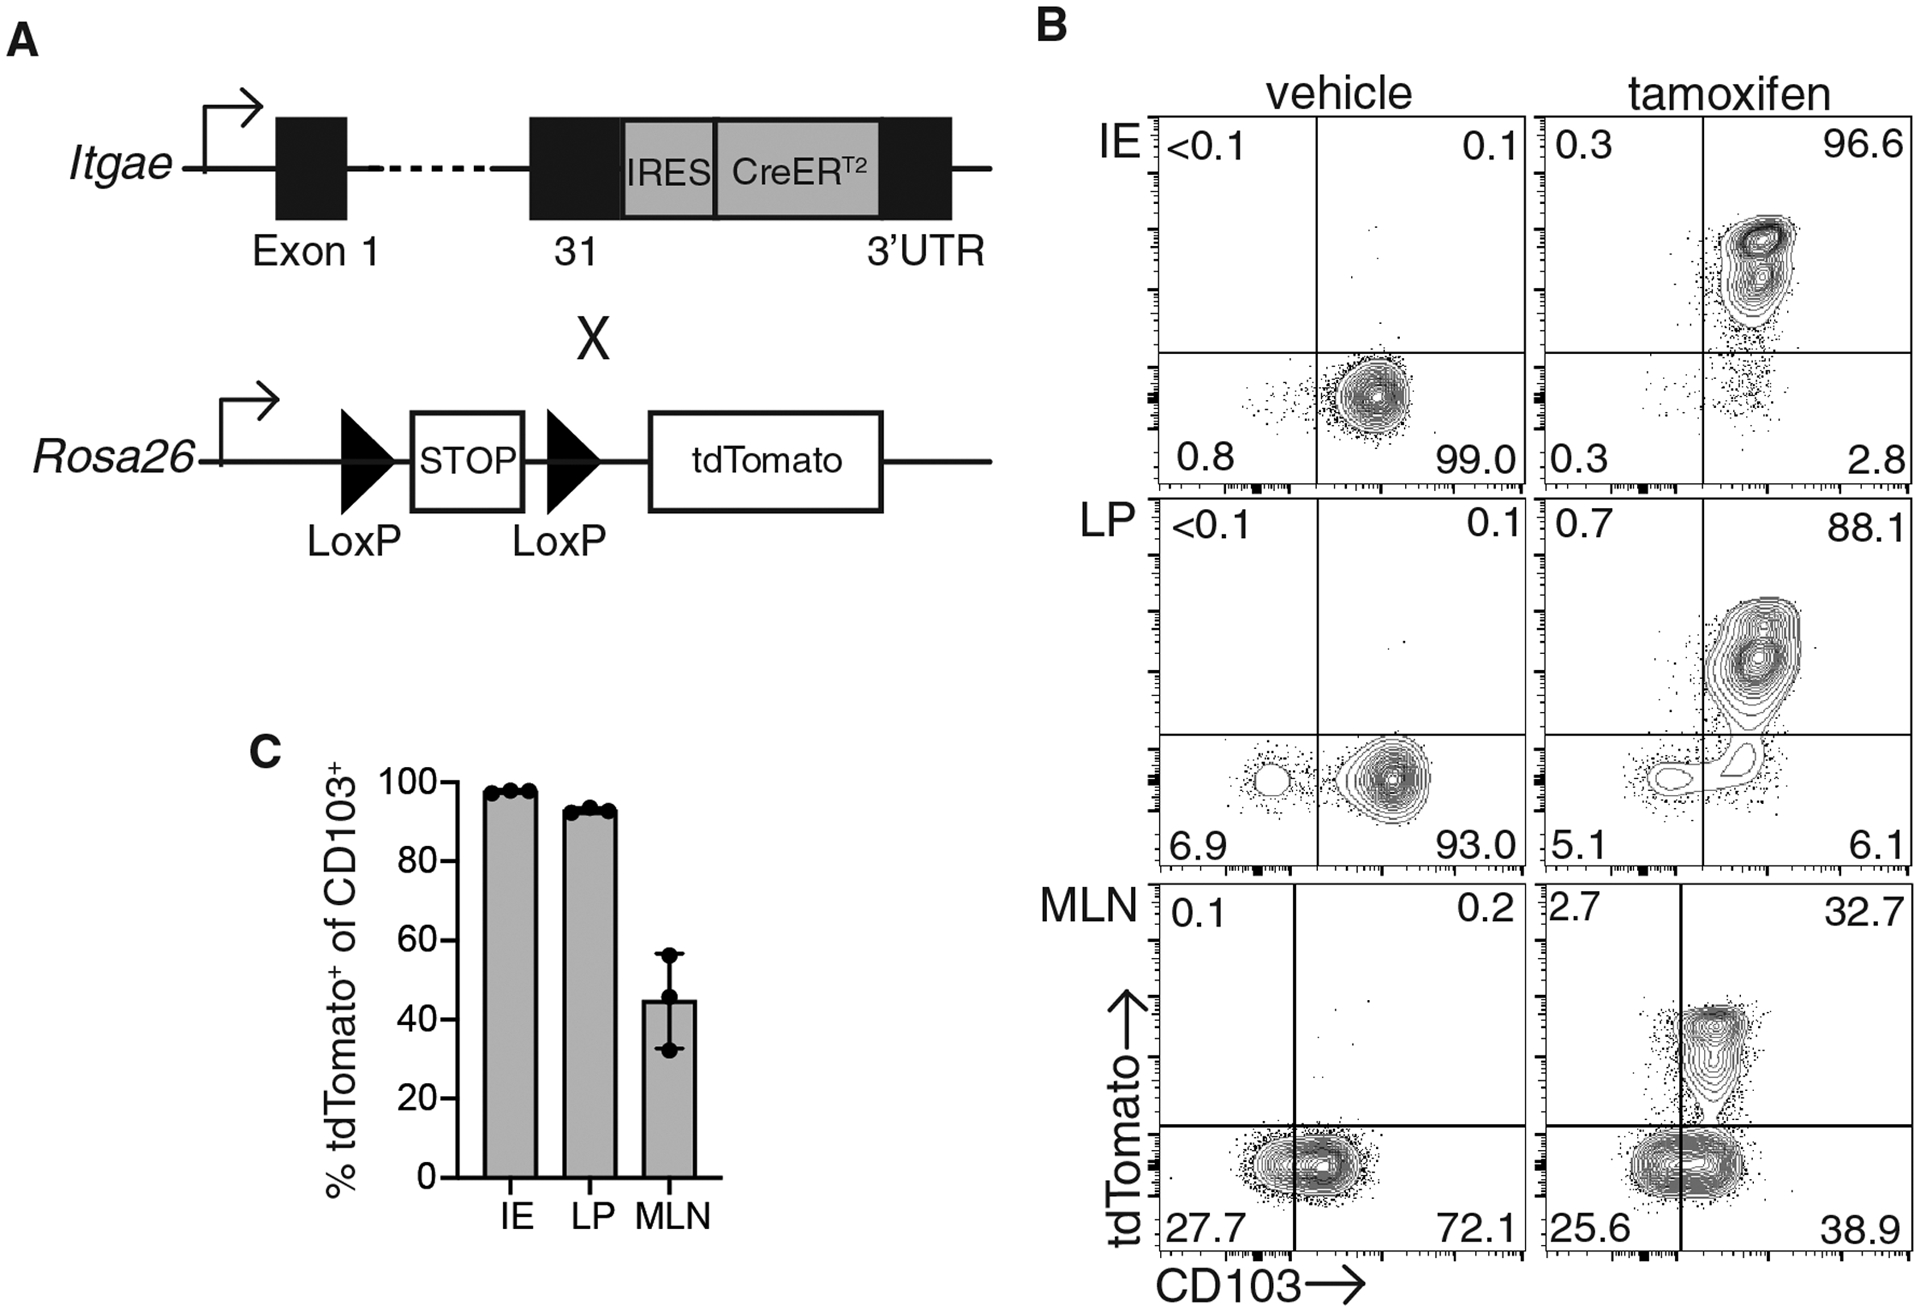
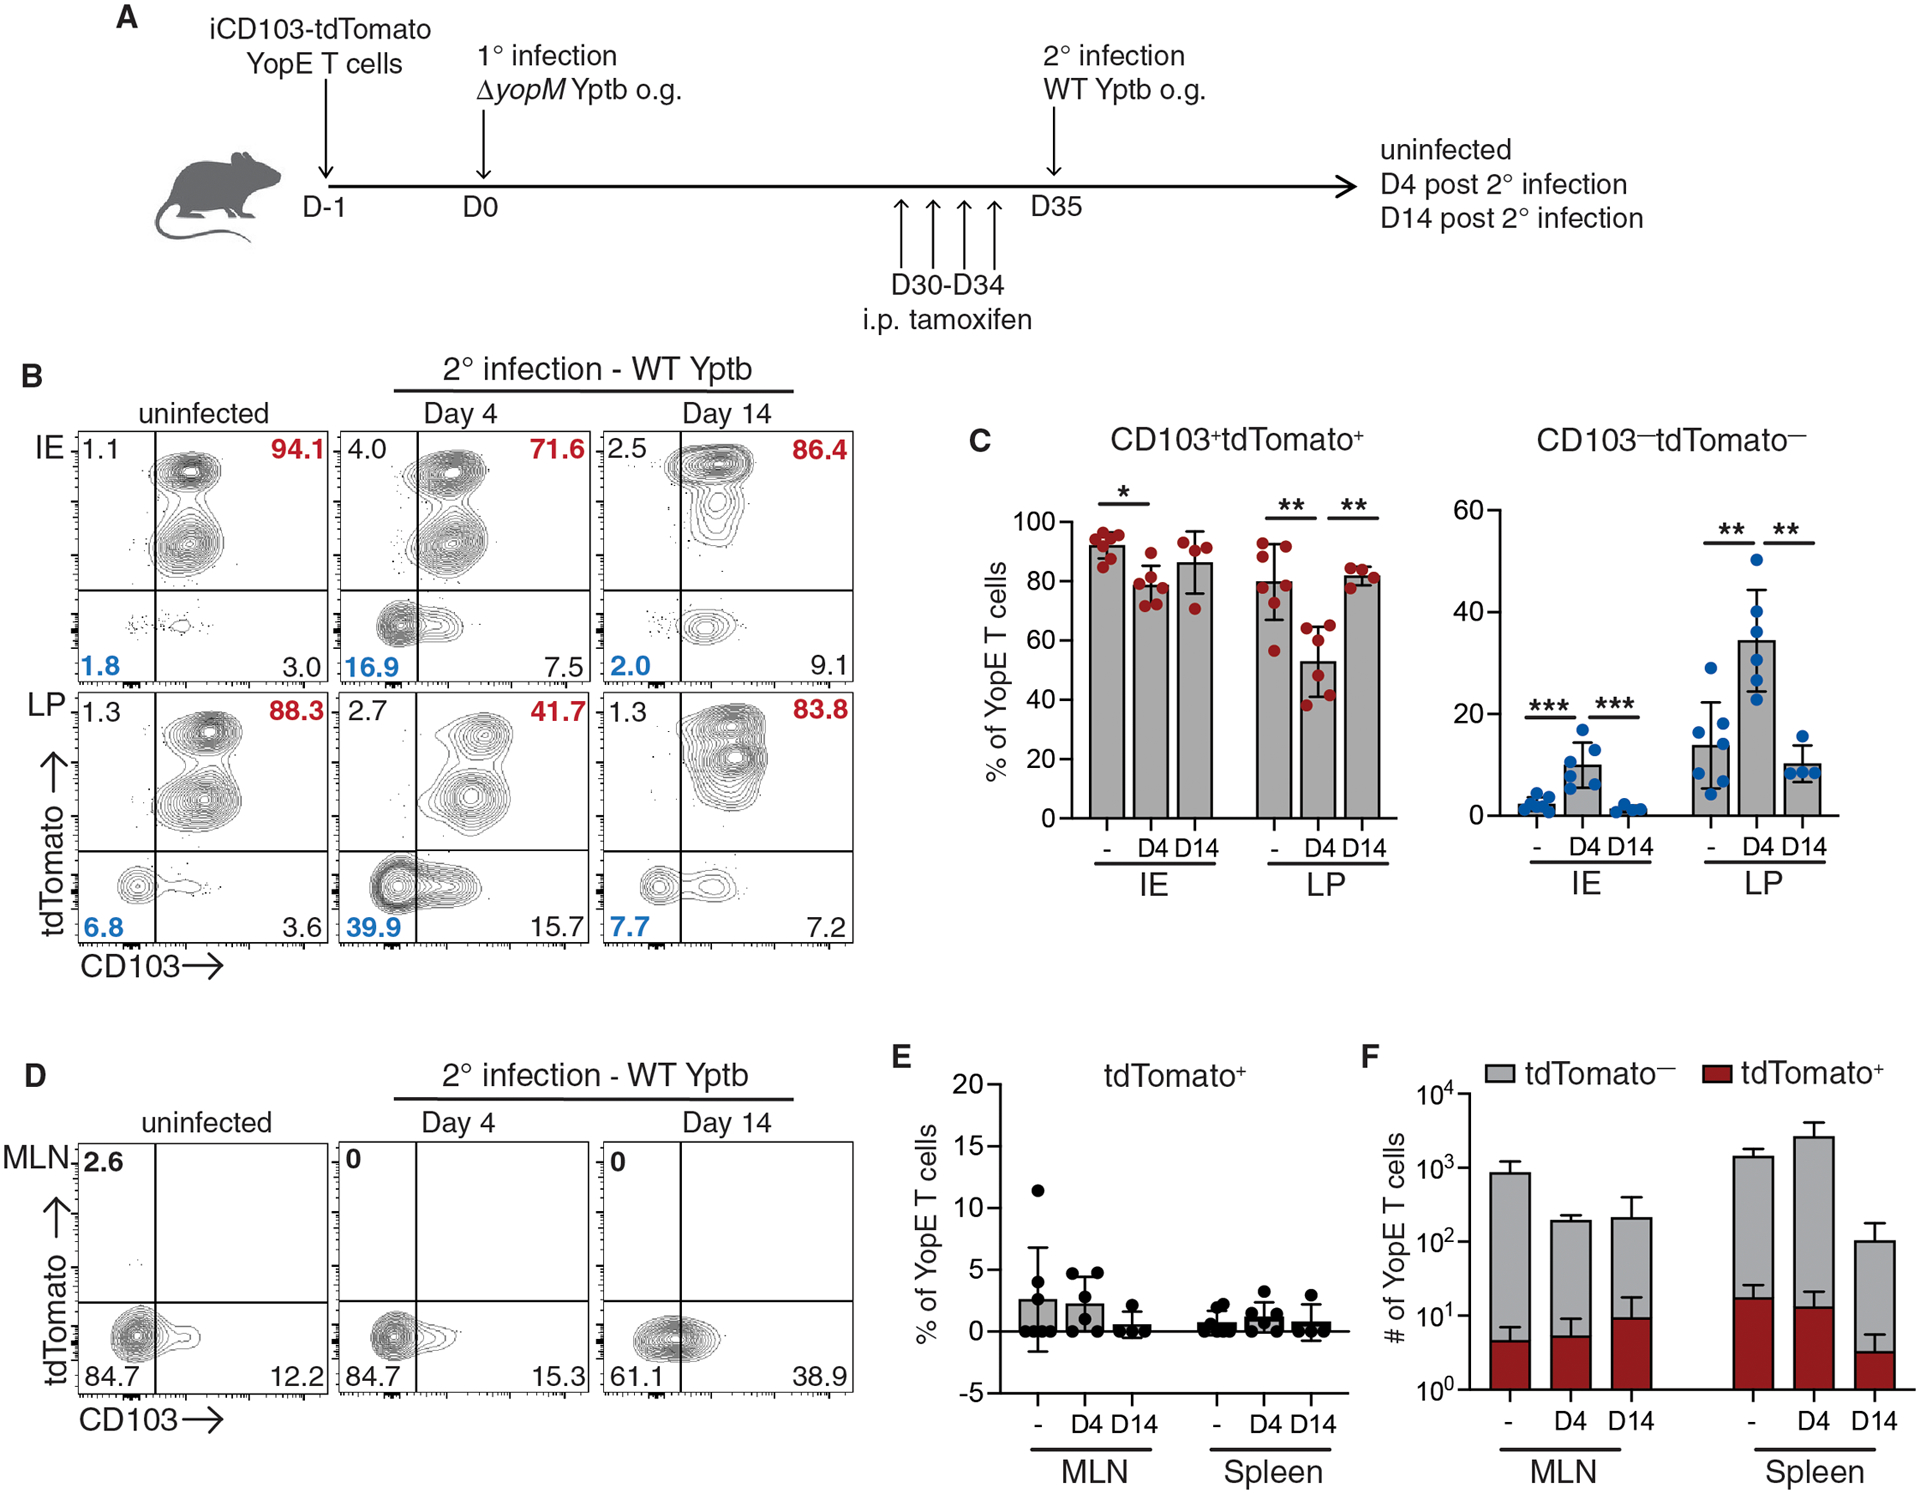
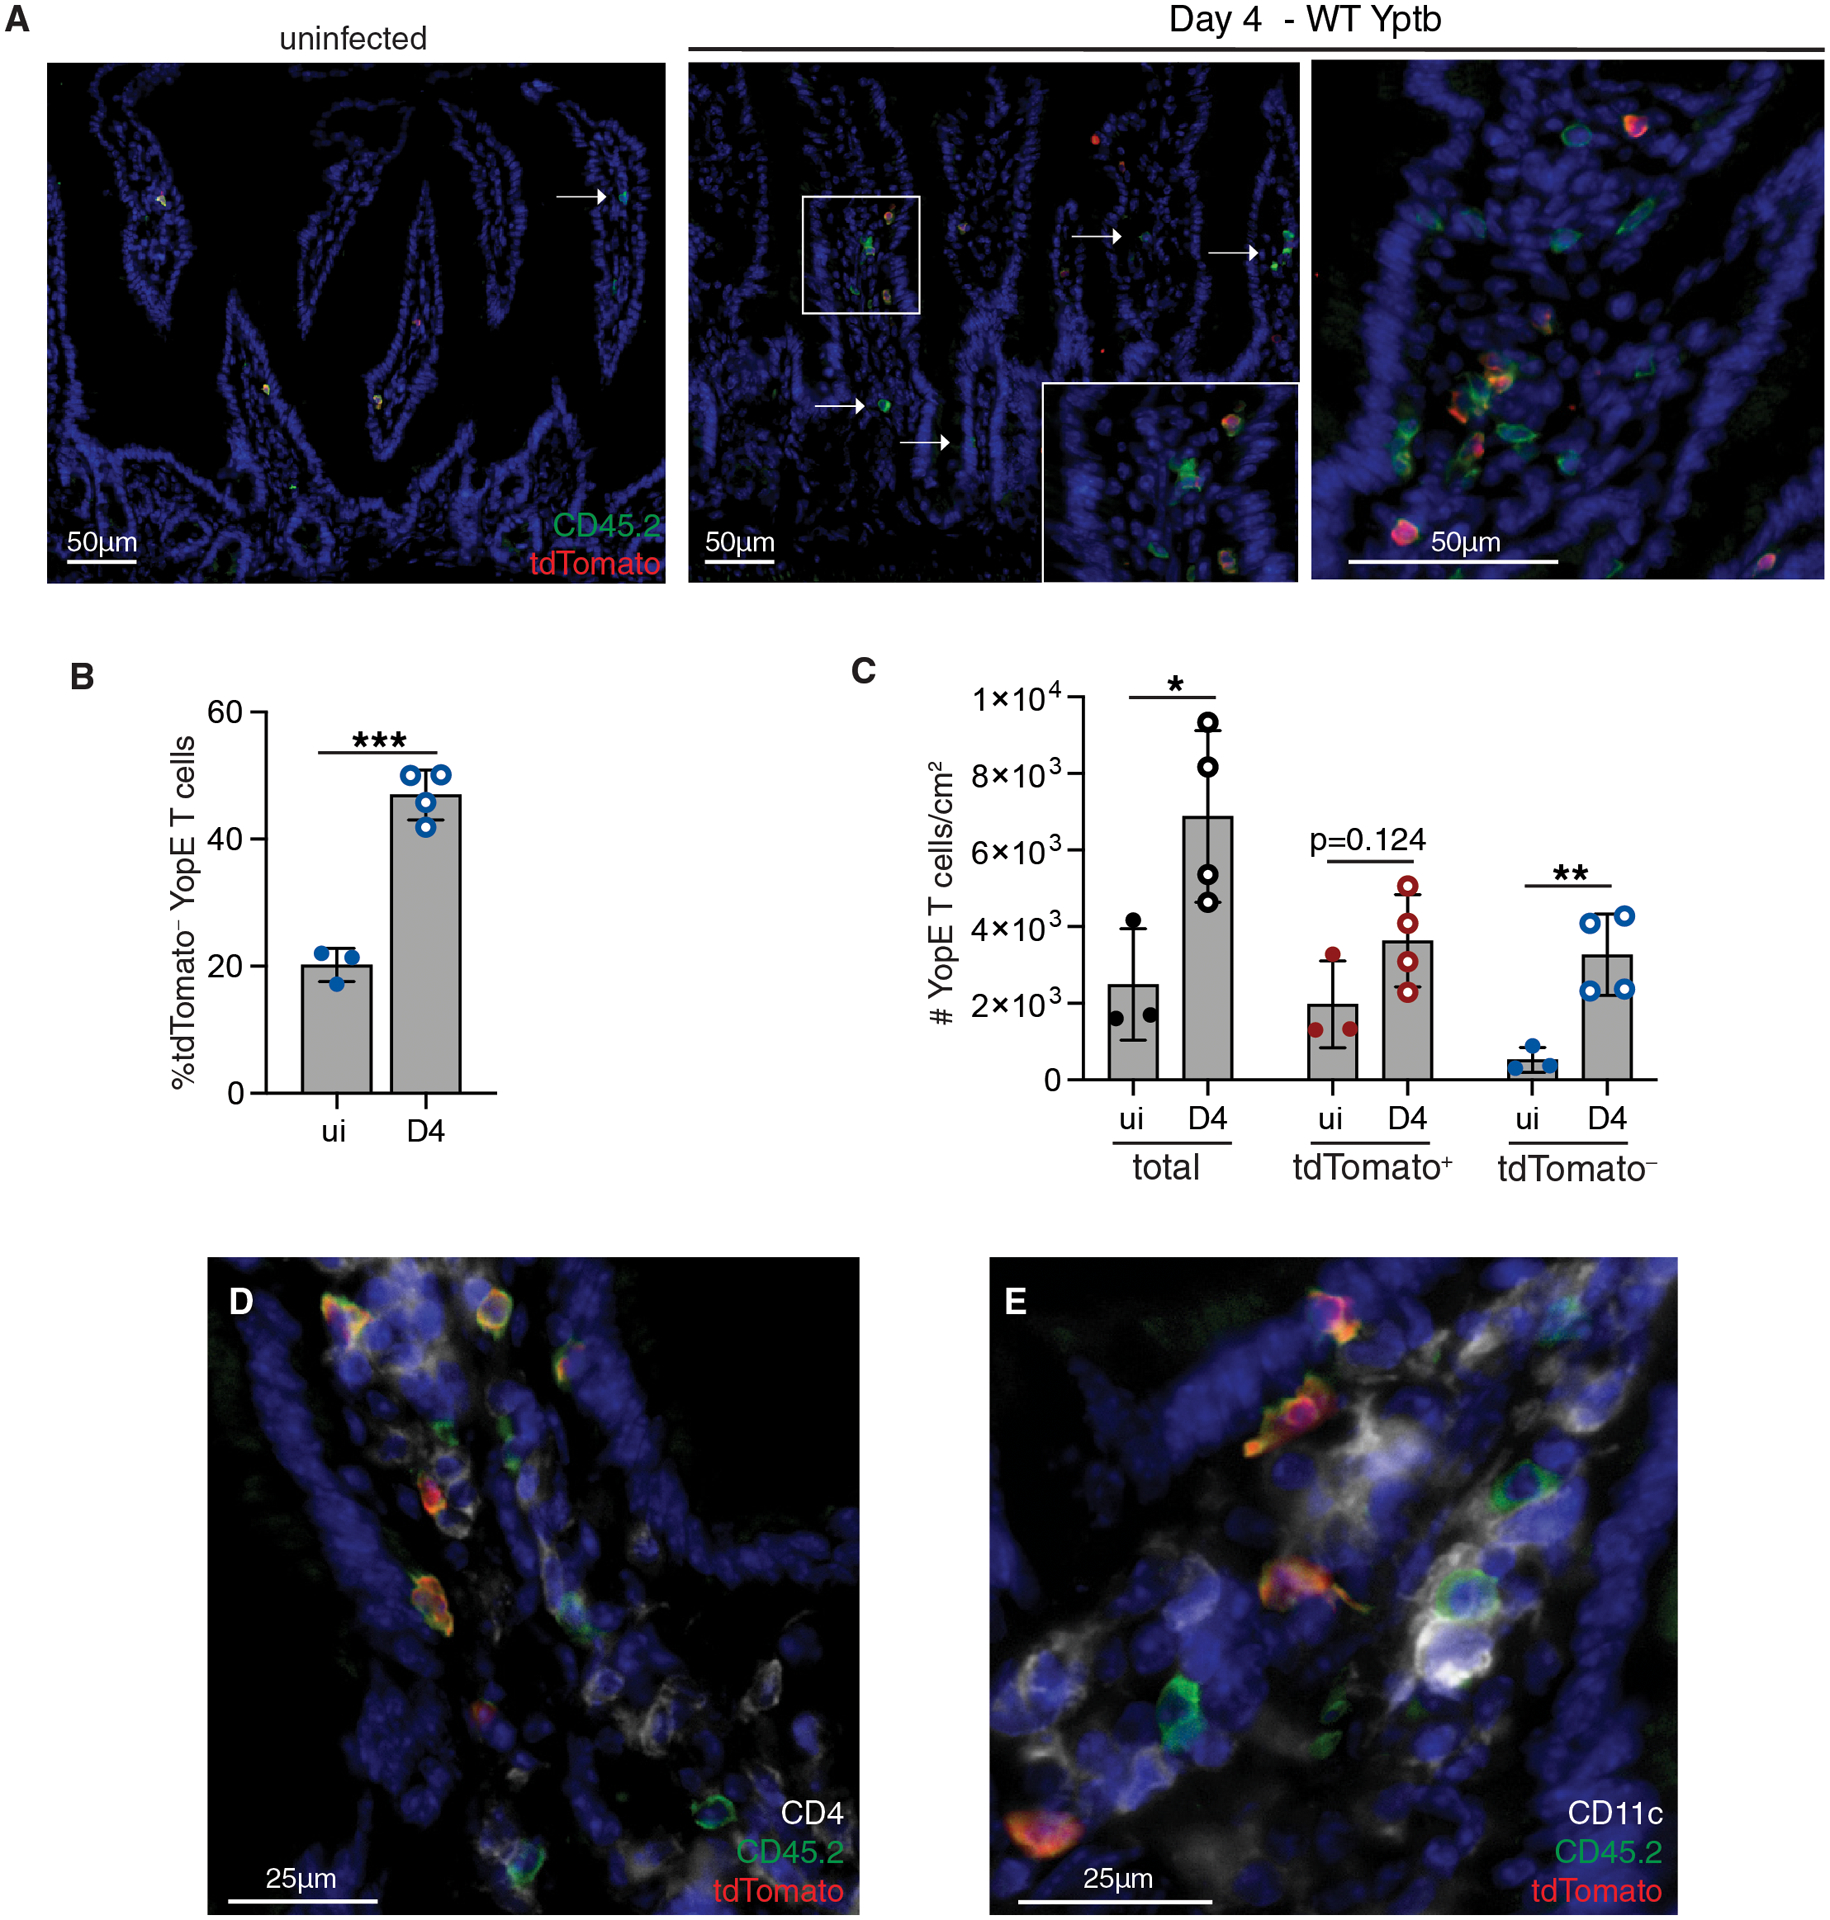
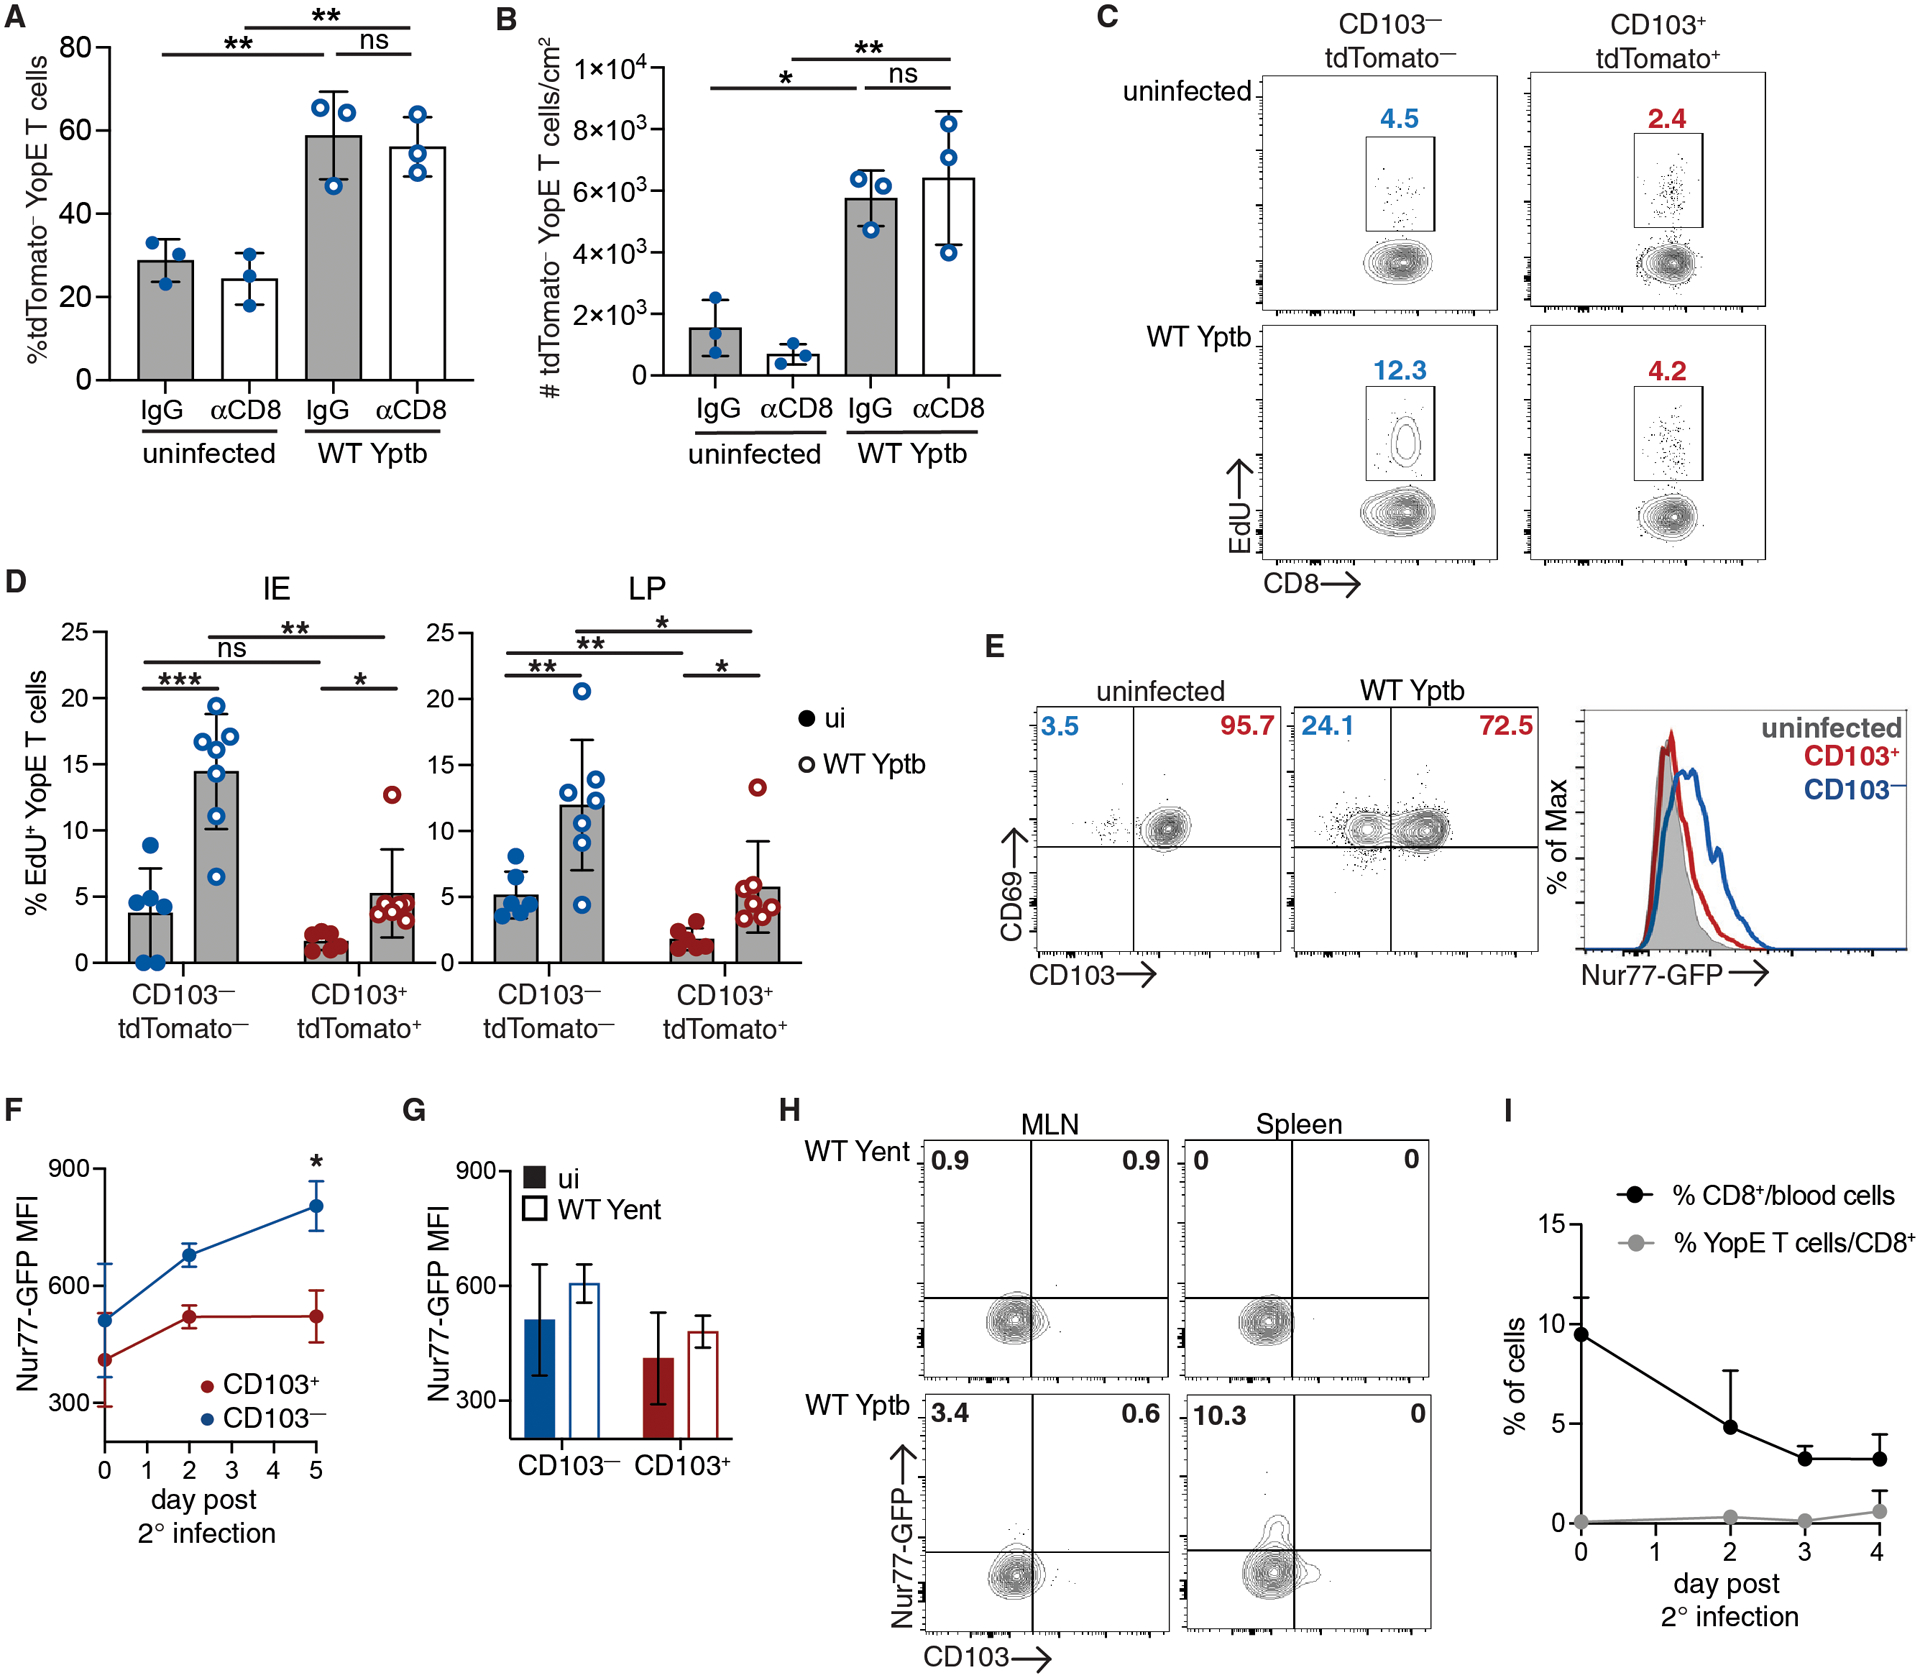
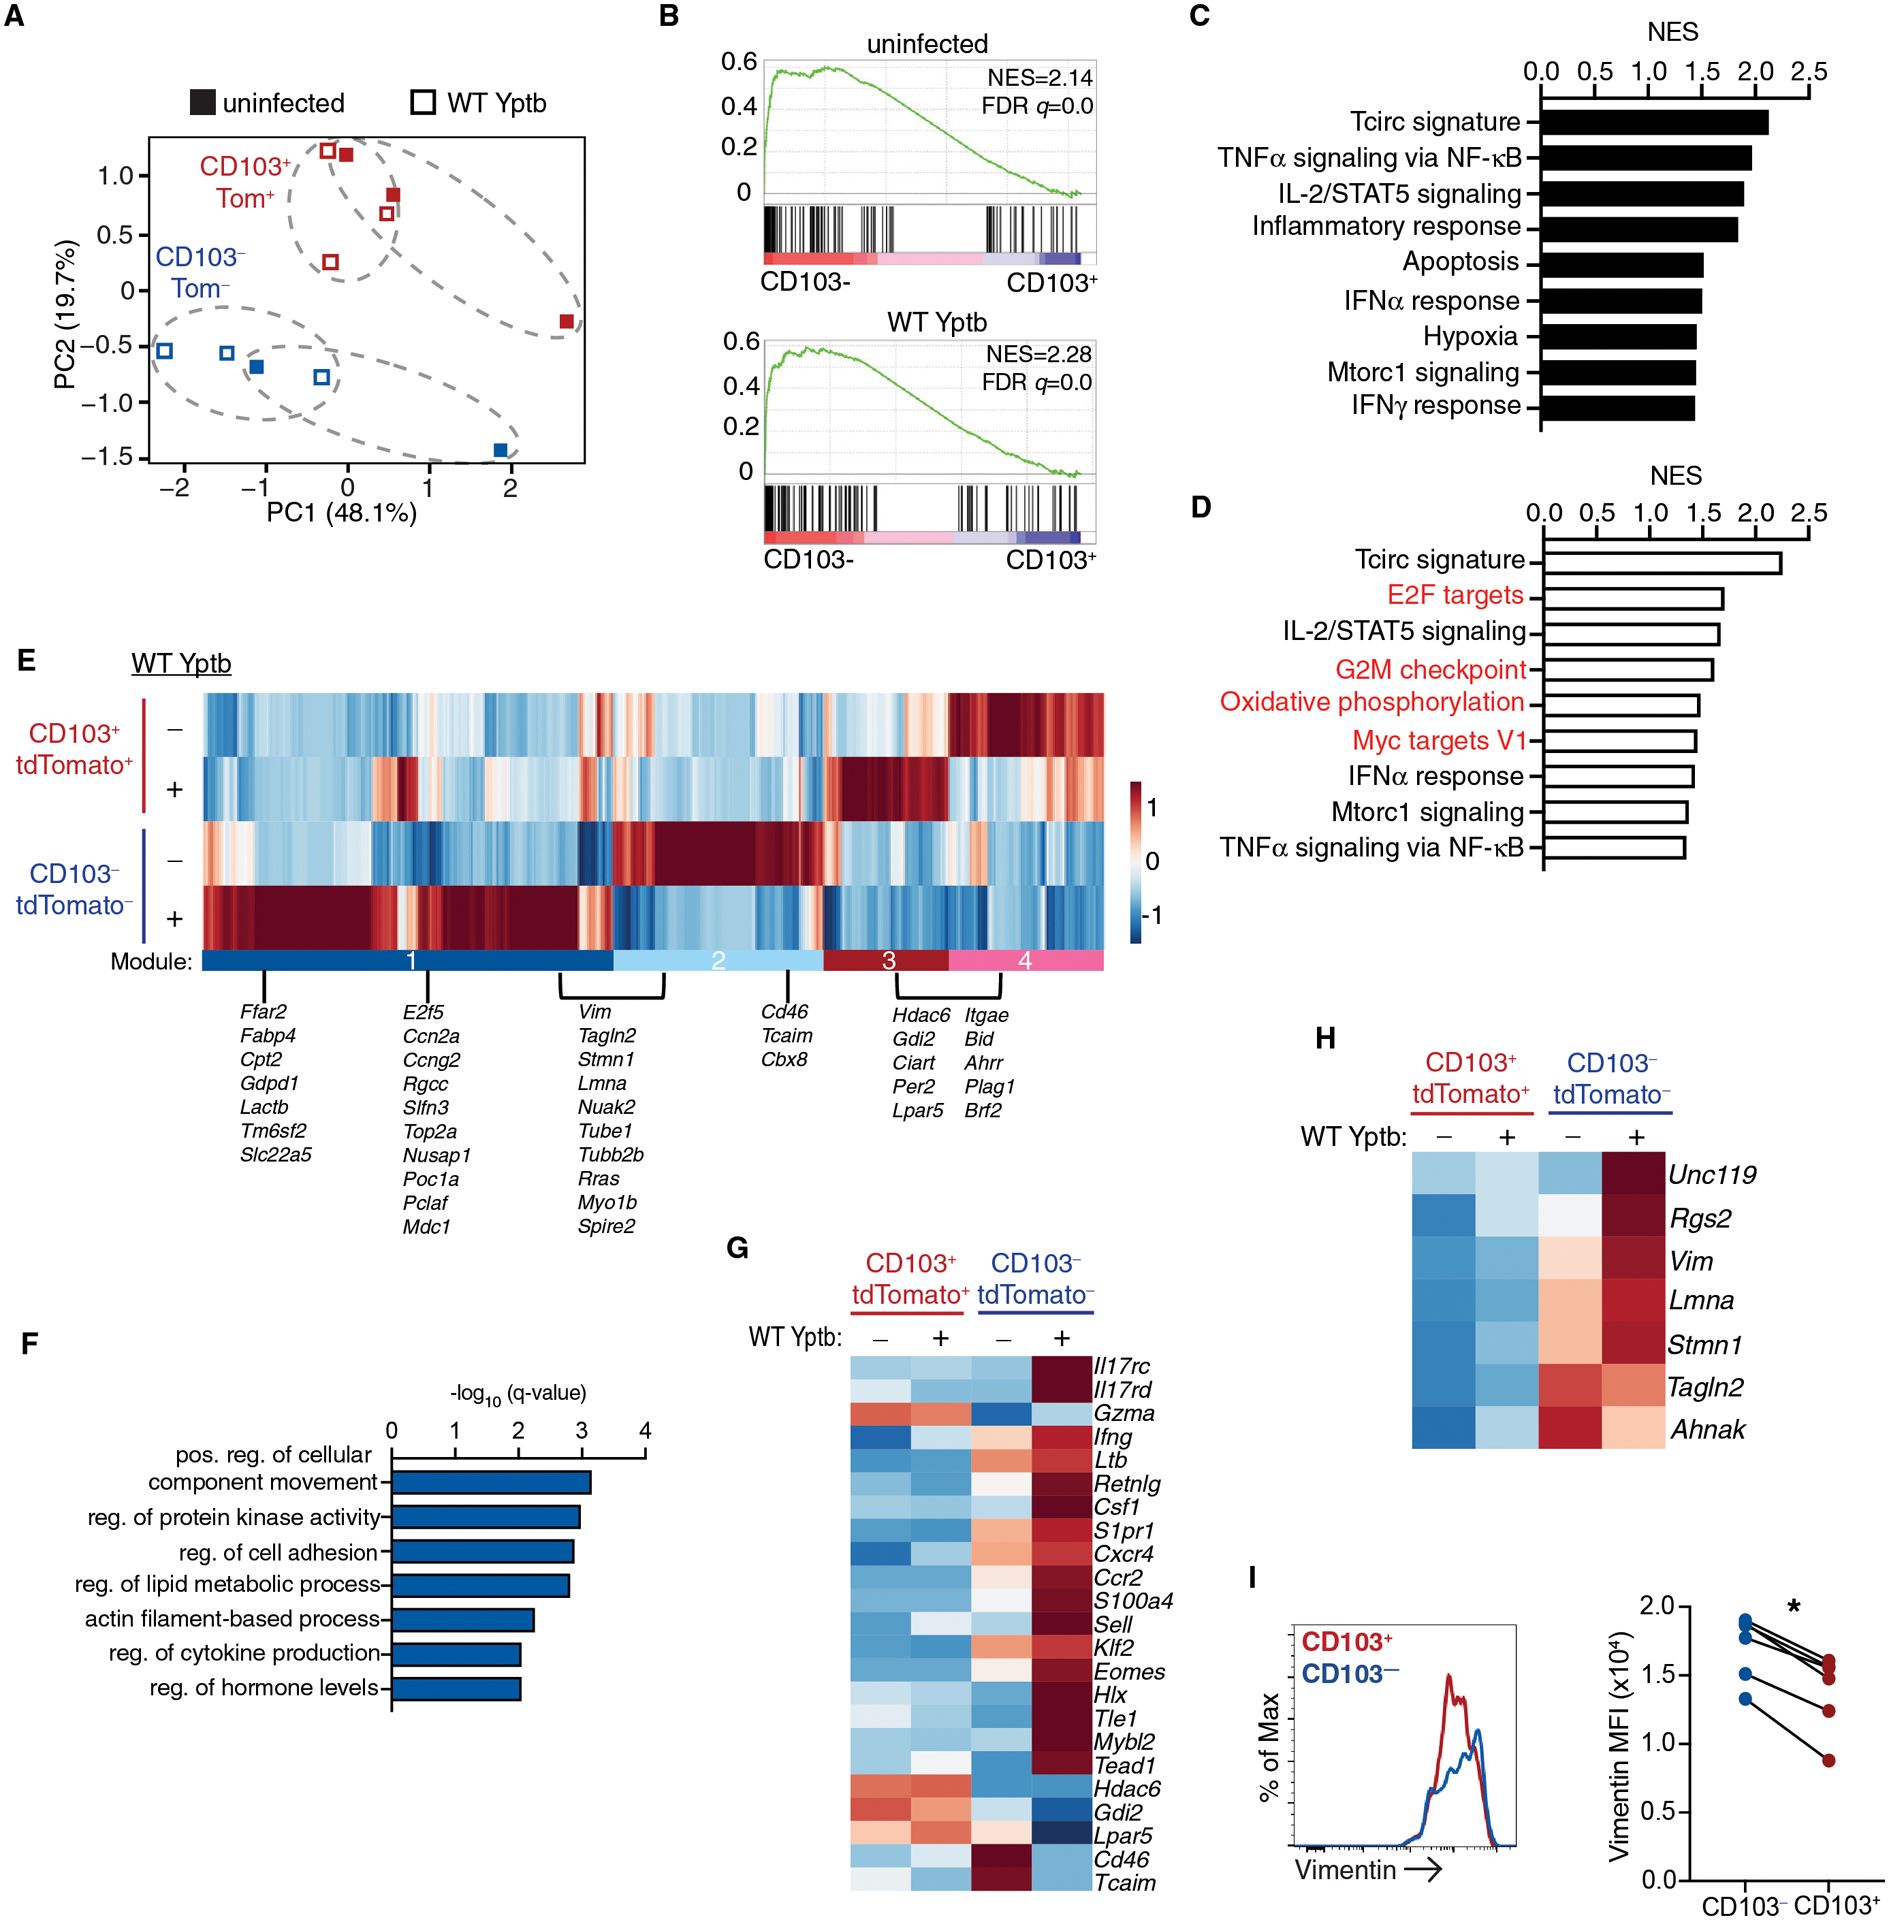
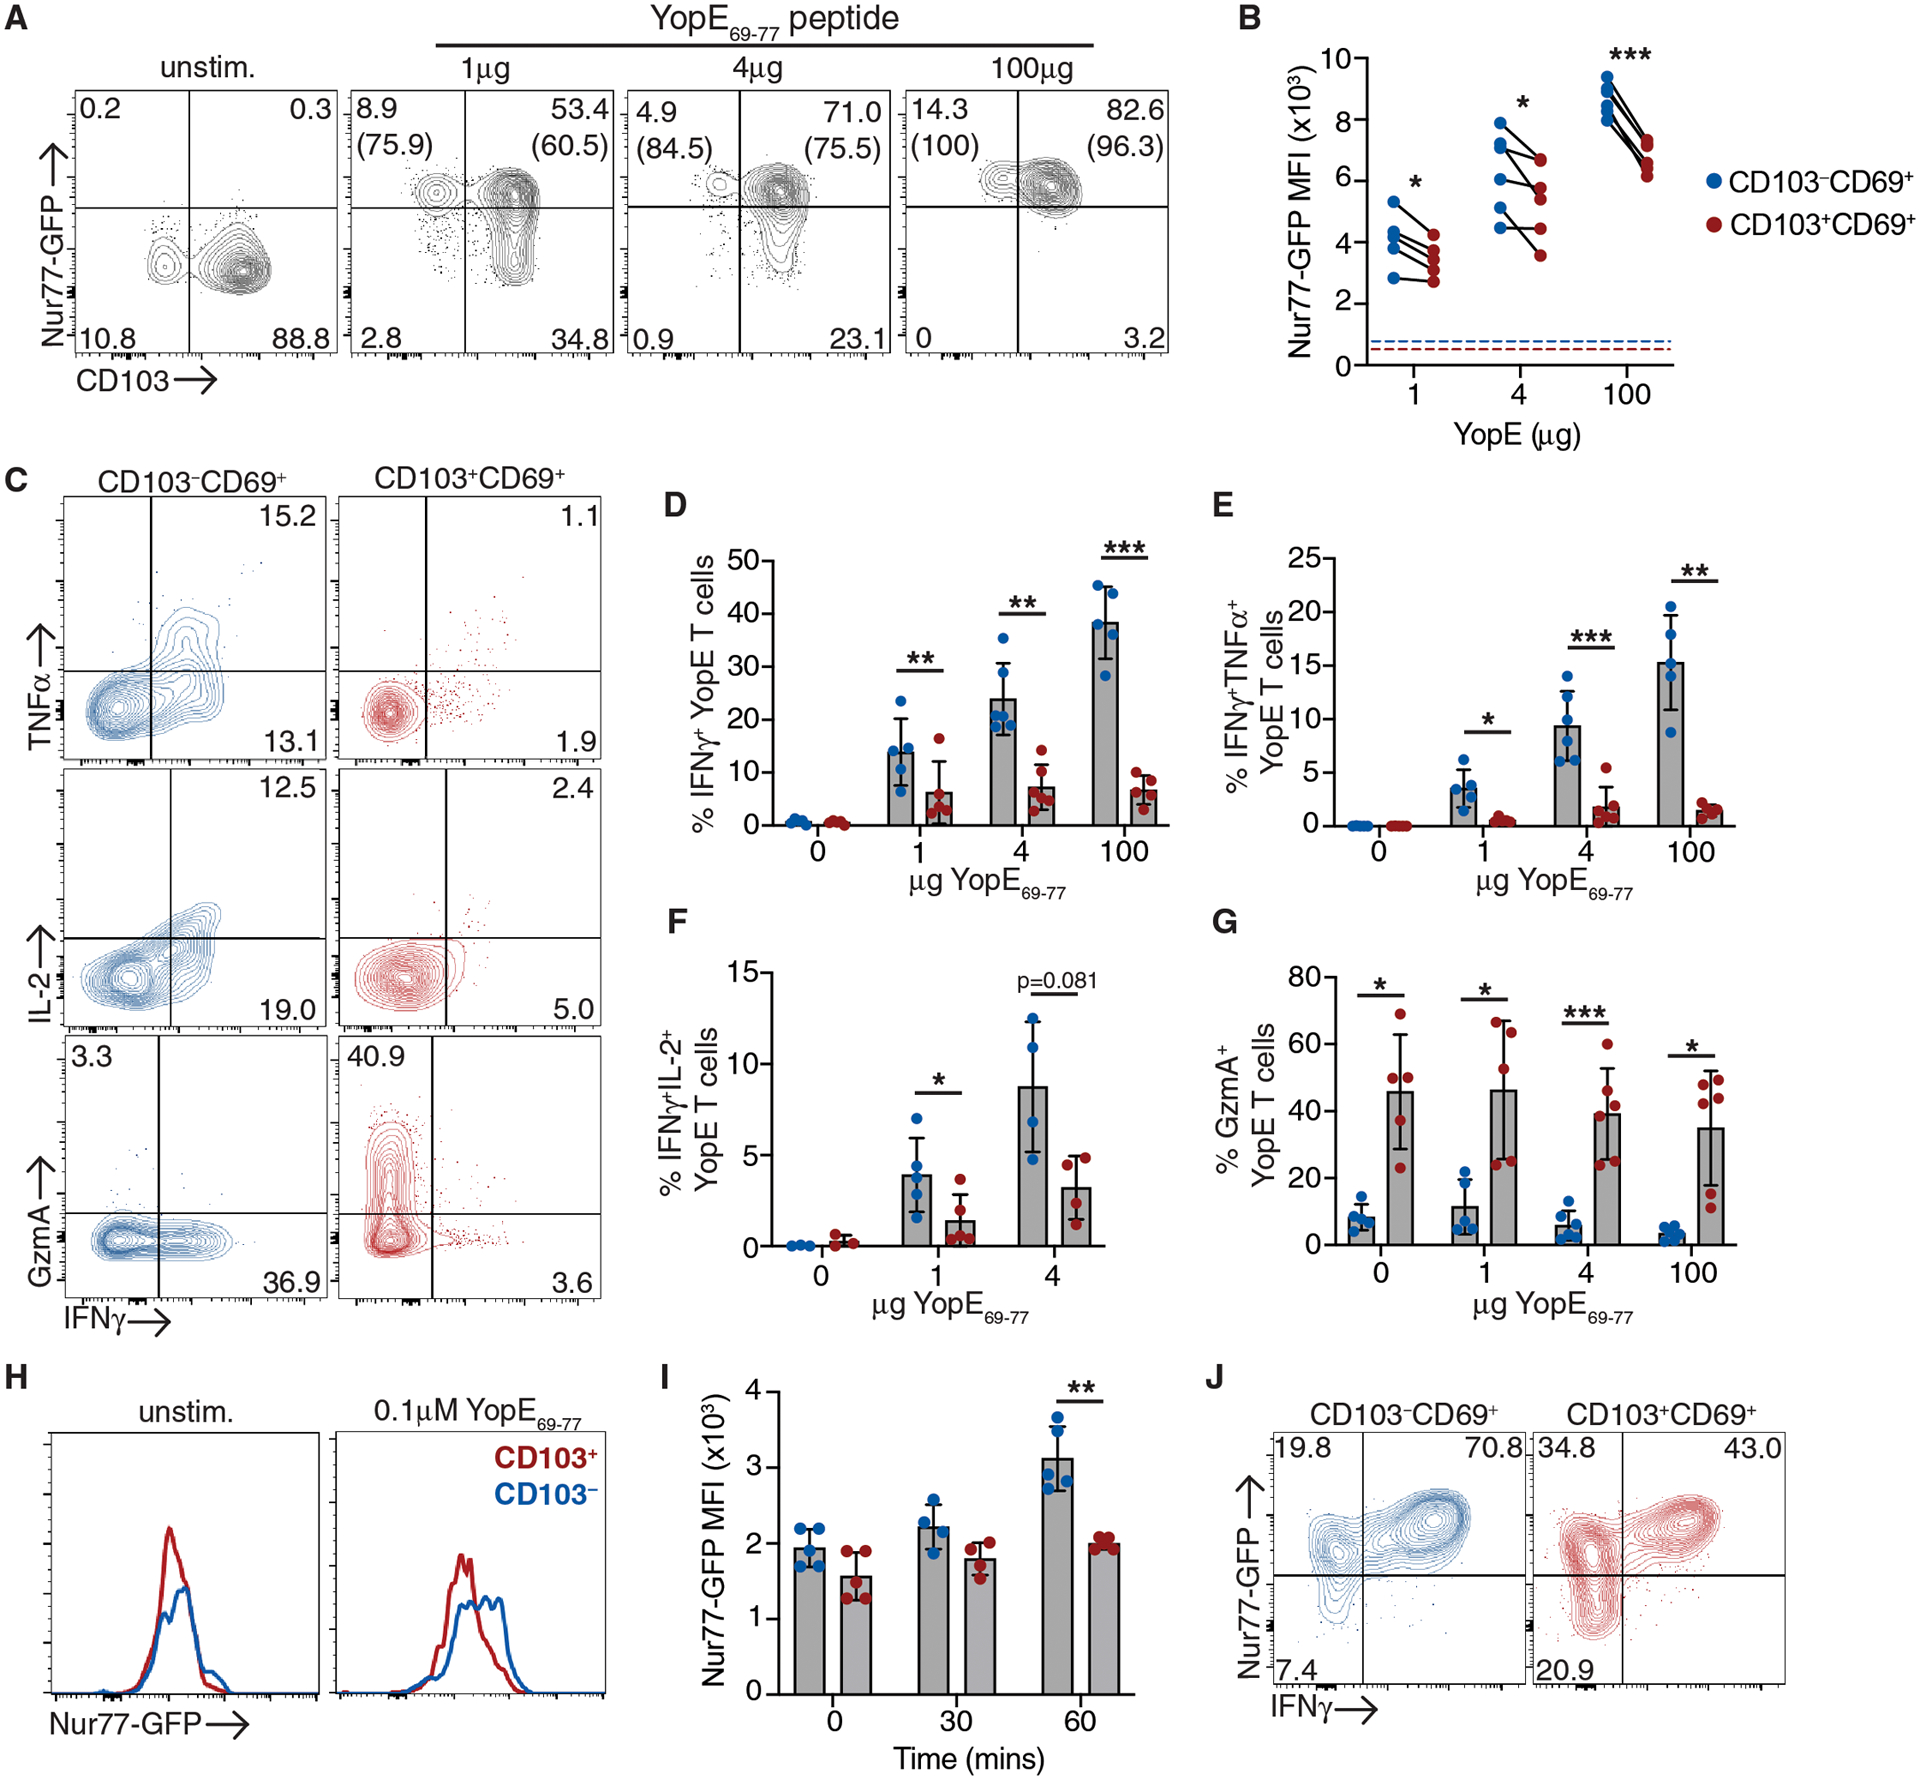
Tissue-resident memory T (TRM) cells remain poised in the tissue and mediate robust protection from secondary infection. TRM cells within the intestine and other tissues are heterogeneous in their phenotype and function; however, the contributions of these TRM subsets to secondary infection remain poorly defined. To address the plasticity of intestinal TRM subsets and their role in local and systemic immunity, we generated mice to fate map intestinal CD103+ TRM cells and track their location and function during secondary infection with Yersinia pseudotuberculosis. We found that CD103+ TRM cells remained lodged in the tissue and were poorly reactivated during secondary challenge. CD103- TRM cells were the primary responders to secondary infection and expanded within the tissue, with limited contribution from circulating memory T cells. The transcriptional profile of CD103- TRM cells demonstrated maintenance of a gene signature similar to circulating T cells along with increased cytokine production and migratory potential. CD103- TRM cells also expressed genes associated with T cell receptor (TCR) activation and displayed enhanced TCR-mediated reactivation both in vitro and in vivo compared with their CD103+ counterparts. These studies reveal the limited recall potential of CD103+ TRM subsets and the role of CD103- TRM cells as central memory-like T cells within peripheral tissues.


Conflict of interest statement

Competing interests: None

Figures

Fig. 1.
Fig. 1.. Cell fate mapping of CD103+ Trm cells.
(A) Itgae-CreERT2 mice were generated by inserting IRES-CreERT2 into target site at the junction of Exon 31 and the 3’UTR. Itgae-CreERT2 mice were crossed to Rosa26-LSL-tdTomato mice to generate iCD103-tdTomato mice. (B-C) iCD103-tdTomato mice were administered with either tamoxifen or vehicle for 4 consecutive days and analyzed for tdTomato and CD103 expression. (B) Representative flow cytometry plots of CD8αβ+ CD69+ T cells from the intestinal epithelium (IE) and lamina propria (LP) or CD8αβ+ mesenteric lymph node cells (MLN). Numbers represent the percent of cells in each quadrant. (C) The percentage of tdTomato+ cells among CD103+ cells in each tissue. Data are representative of 2 independent experiments with 3 mice/group.
Fig. 2.
Fig. 2.. Expansion of intestinal CD103 Trm cells during secondary infection.
CD45.1+ mice received CD45.2+ iCD103-tdTomato YopE T cells before oral gavage with ΔyopM Yptb. At 30 days post-infection, immune mice were administered tamoxifen and then infected with wild-type (WT) Yptb. Small intestinal IE and LP, MLN, and spleen cells were isolated from ΔyopM Yptb-immunized mice and at 4 and 14 days post-secondary infection with WT Yptb. (A) Illustration of experimental design. (B) Representative flow cytometry plots of tdTomato and CD103 expression in i.v.CD8αCD69+ CD45.2+ YopE Trm cells from uinfected and rechallenged mice. Numbers are percent of cells in each quadrant. (C) Quantification of both CD103+tdTomato+ and CD103tdTomato subsets as a percentage of YopE Trm cells. (D) Representative flow cytometry plots of tdTomato and CD103 expression by YopE T cells from the MLN in uinfected and rechallenged mice. Numbers are the percent of cells in each quadrant and (E) quantification of tdTomato+ cells as a percentage of YopE T cells in the MLN and spleen. (F) Number of tdTomato+ cells in the MLN and spleen of uninfected and rechallenged mice. Data are pooled from 2 independent experiments with 2–4 mice/group. Symbols represent individual mice and means and SDs are shown. P values were determined using one-way ANOVA with Tukey’s test in (C), *p<0.01, **p<0.005, ***p<0.001.
Fig. 3.
Fig. 3.. tdTomato Trm populations expand during secondary infection and form memory lymphocyte clusters.
CD45.2+ YopE TCR transgenic iCD103-tdTomato cells were transferred into CD45.1+ mice prior to oral infection with ΔyopM Yptb. At day 30 post-infection, mice were administered tamoxifen and then rechallenged with WT Yptb. At 4 days post-secondary infection, the ileum was harvested for immunofluorescence microscopy. (A) Tissue sections were stained for CD45.2 (green), tdTomato (red), and the nuclei were stained with DAPI (blue). Representative images of tissue from immunized mice (left panel) and at day 4 post infection (right panels). Arrows indicate individual or cluster of tdTomato YopE T cells (middle panel), with inset showing small cluster of CD45.2+ YopE T cells. Larger lymphocyte cluster (right panel). Scale bar, 50μm. (B) Quantification of percent tdTomato YopE T cells of total CD45.2+ cells. (C) Quantification of total YopE T cells and the tdTomato+ and tdTomato subsets per cm2. (D-E) Tissue sections were stained for CD45.2 (green), tdTomato (red), and (D) CD4 (white) or (E) CD11c (white). Nuclei were stained with DAPI (blue) and representative images of tissue from immunized mice are shown. Scale bar, 25μm. Data points represent individual mice and are representative of 2 independent experiments with 3–4 mice/group, means and SDs are shown. P values were determined by unpaired Student’s t-test in (B and C), *p<0.05, **p<0.01, ***p<0.005.
Fig. 4.
Fig. 4.. Local reactivation of CD103tdTomato Trm cells during secondary infection.
(A-C) CD45.1+ mice received CD45.2+ iCD103-tdTomato YopE T cells before oral gavage with ΔyopM Yptb. At 30 days post-infection, mice with iCD103-tdTomato YopE T cells were administered tamoxifen. (A-B) One day prior to infection with WT Yptb, mice were administered anti-CD8α depleting or IgG control antibodies. At 4 days post-secondary infection, the ileum was harvested for immunofluorescence microscopy and stained for CD45.2 and tdTomato expression. Quantification of the percent tdTomato cells/total CD45.2+ iCD103-tdTomato YopE T cells (A) and number tdTomato cells/cm2 (B) in the ileum. (C) Incorporation of EdU into tdTomato+CD103+CD69+ and tdTomatoCD103CD69+ IE and LP Trm subsets from immune mice and at 4 days post-secondary infection. (D-G) CD45.2+ mice received CD45.1/2+ Nur77-GFP YopE T cells before oral gavage with ΔyopM Yptb. At greater than 30 days post-infection, mice were rechallenged with WT Yptb or Yent. (D) Representative plots of CD103 and CD69 expression by LP YopE Trm cells on day 5 post infection and representative histograms of Nur77-GFP expression in total LP Trm cells from Yptb immune mice and CD103+CD69+ and CD103CD69+ LP Trm subsets after infection. Nur77-GFP MFI in LP Trm subsets after infection with Yptb (E) or Yent (F). (G) Representative plots of CD103 and Nur77-GFP expression by MLN and spleen YopE T cells 5 days post infection with Yent or WT Yptb. Numbers are percent of cells in each quadrant. (H) Percentage of CD8+ T cells of total blood cells and percentage of transferred YopE T cells of CD8+ T cells over the course of secondary infection. Data points represent mean (E, G, H) or individual mice (A-C) and are representative of 2–3 independent experiments (A,B,E) or pooled from 2–3 independent experiments (C,E) with 3–4 mice/group, means and SDs are shown. P values were determined by one-way ANOVA with Tukey’s test (A, B, E) or paired or unpaired Student’s t-test in (C, E, F), *p<0.05, **p<0.01, ***p<0.001.
Fig. 5.
Fig. 5.. RNAseq analysis of the CD103+tdTomato+ and CD103tdTomato LP Trm subsets reveal distinct functional capabilities.
CD45.1+ mice received CD45.2+ iCD103-tdTomato YopE T cells before oral gavage with ΔyopM Yptb. At 30 days post-infection, immune mice were administered tamoxifen and then infected with WT Yptb and T cells were sorted from the LP 4 days later. (A) Principal component analysis of global gene expression, biological replicate samples from individual mice are indicated by dotted ellipses. (B-D) GSEA comparing the CD103 to the CD103+ subset in immune mice before and after secondary infection. (B) GSEA plot showing enrichment of circulating T cell signature (Tcirc) genes in immune mice (top panel) and after secondary infection (bottom panel). Normalized enrichment score (NES) and FDR q-value are shown. GSEA of select Hallmark Gene Sets in the CD103 Trm subsets before (C) and after (D) infection. NES is shown and all have an FDR-q value <0.05. (E) Heatmap of differentially expressed genes from pairwise comparisons of all groups. Modules are highlighted and a subset of genes from each module are listed. (F) GO pathway analysis of genes that are in module 1 and 2 using Metascape. (G-H) Heatmap of genes of interest selected from (C). (I) Expression of vimentin by CD103tdTomato and CD103+tdTomato+ LP cells from uninfected mice. Representive flow cytometry is shown, and connected data points represent individual mice and are pooled from 2 independent experiments (I). P values were determined by paired Student’s t-test, *p<0.001.
Fig. 6.
Fig. 6.. Superior TCR-mediated reactivation and cytokine production by CD103tdTomato LP Trm in vivo and ex vivo.
CD45.2+ mice received CD45.1+ Nur77-GFP YopE T cells before oral gavage with ΔyopM Yptb. (A-G) At 30 days post-infection, mice were administered 1–100μg YopE69–77 peptide or vehicle control i.p. and tissue was harvested 1 hour later. (A) Representative flow cytometry plots of Nur77-GFP and CD103 expression by CD69+ YopE T cells from the LP. Numbers represent the percentage of cells in each quadrant, and numbers in parenthesis are the percentage of Nur77-GFPhi cells of the CD103−/+ subsets. (B) MFI of Nur77-GFP of CD103−/+ subsets, data points are individual mice with lines connected samples from the same mouse. Dashed lines represent MFI of Nur77-GFP in unstimulated control YopE T cells. (C) Representative flow cytometry plots of IFNγ, TNFα, IL-2, and granzyme A expression in CD103+CD69+ and CD103CD69+ YopE Trm subsets from the LP. Quantification of the percent of IFNg+ (D), IFNγ+TNFα+ (E), IFNγ+IL-2+ (F), and GranzymeA+ (G) cells from each subset. (H-J) LP cells were isolated and stimulated with 0.1μM YopE69–77 ex vivo. Representative histograms of Nur77-GFP expression by unstimulated CD103−/+ subsets and 30 or 60 minutes after YopE69–77 stimulation (H) and Nur77-GFP MFI at indicated timepoints (I). (J) Representative plots of Nur77-GFP and INFγ expression by CD103−/+ subsets after 4 hours of peptide stimulation. Gates were determined using unstimulated samples from the same mice. Data points represent individual mice and are pooled from 2–3 independent experiments, means and SDs are shown. P values were determined by paired Student’s t-test, *p<0.05, **p<0.01, ***p<0.005.

Similar articles

Cited by

References

    1. Masopust D, Soerens AG, Tissue-Resident T Cells and Other Resident Leukocytes. Annu Rev Immunol. 37, 1–26 (2019). - PMC - PubMed
    1. Mueller SN, Mackay LK, Tissue-resident memory T cells: local specialists in immune defence. Nat Rev Immunol. 16, 79–89 (2016). - PubMed
    1. Iijima N, Iwasaki A, A local macrophage chemokine network sustains protective tissue-resident memory CD4 T cells. Science. 346, 93–98 (2014). - PMC - PubMed
    1. Jiang X, Clark RA, Liu L, Wagers AJ, Fuhlbrigge RC, Kupper TS, Skin infection generates non-migratory memory CD8+ TRM cells providing global skin immunity. Nature. 483, 227–231 (2012). - PMC - PubMed
    1. Gebhardt T, Wakim LM, Eidsmo L, Reading PC, Heath WR, Carbone FR, Memory T cells in nonlymphoid tissue that provide enhanced local immunity during infection with herpes simplex virus. Nat Immunol. 10, 524–530 (2009). - PubMed

Publication types

Substances