

In situ diversity of metabolism and carbon use efficiency among soil bacteria
- PMID: 36332015
- PMCID: PMC9635821
- DOI: 10.1126/sciadv.abq3958
In situ diversity of metabolism and carbon use efficiency among soil bacteria
Abstract
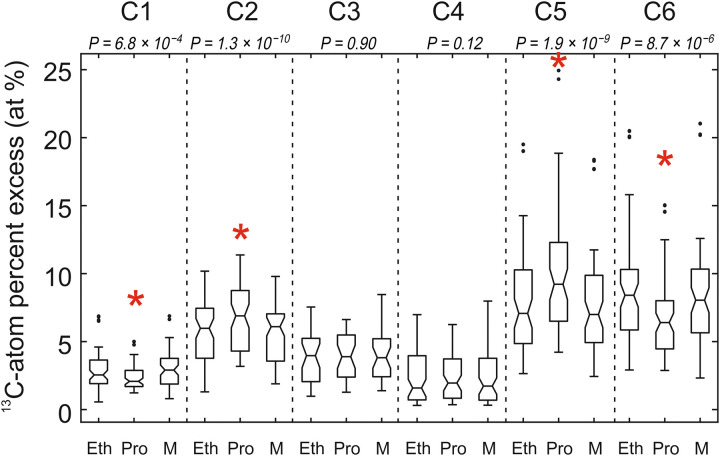
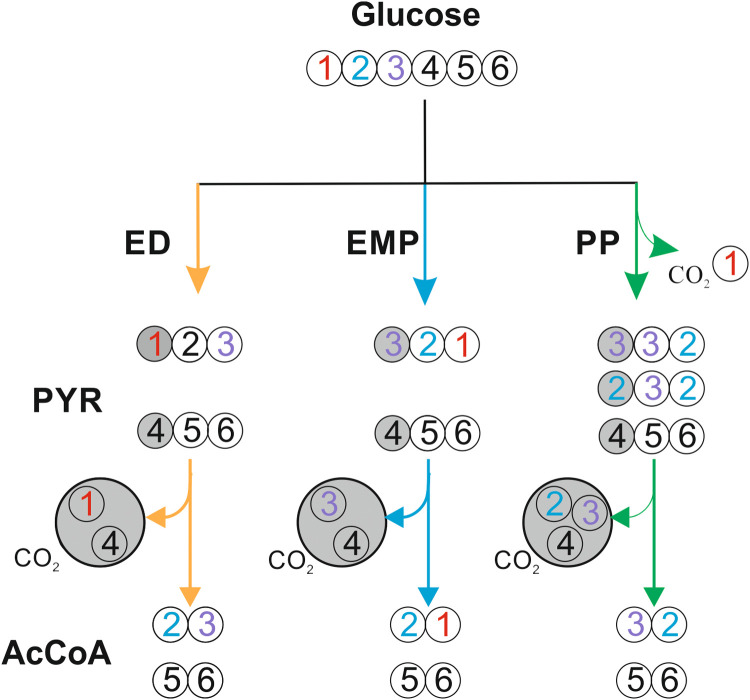
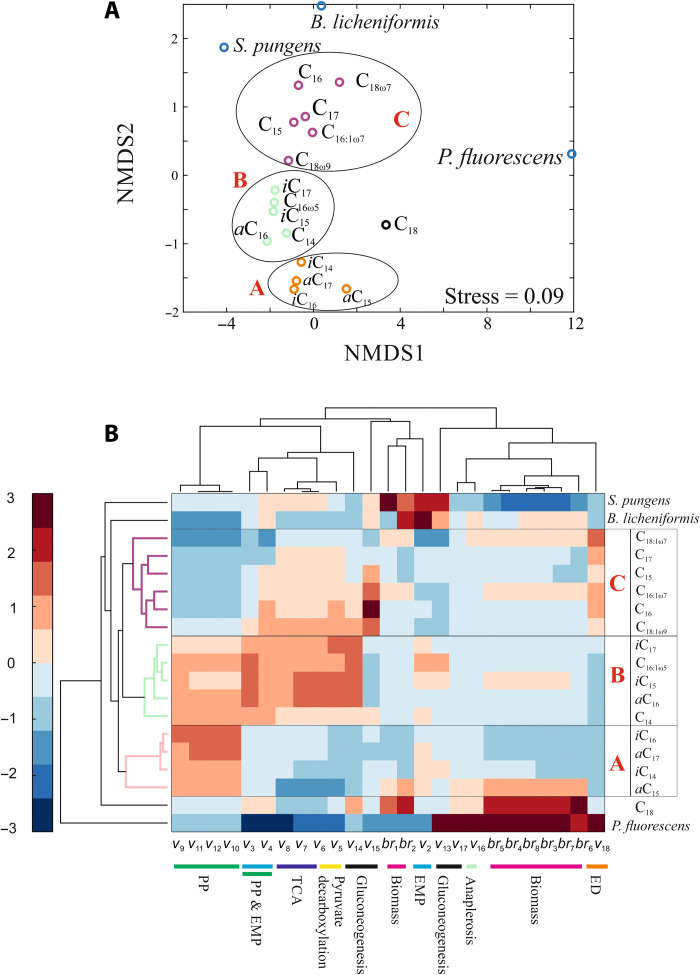
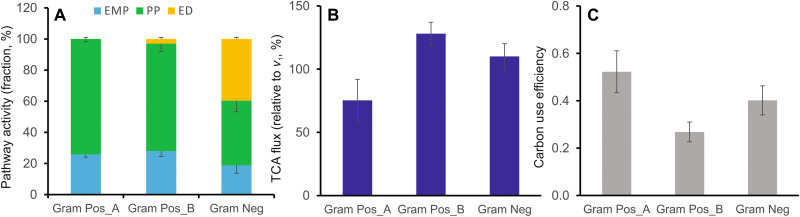
The central carbon (C) metabolic network harvests energy to power the cell and feed biosynthesis for growth. In pure cultures, bacteria use some but not all of the network's major pathways, such as glycolysis and pentose phosphate and Entner-Doudoroff pathways. However, how these pathways are used in microorganisms in intact soil communities is unknown. Here, we analyzed the incorporation of 13C from glucose isotopomers into phospholipid fatty acids. We showed that groups of Gram-positive and Gram-negative bacteria in an intact agricultural soil used different pathways to metabolize glucose. They also differed in C use efficiency (CUE), the efficiency with which a substrate is used for biosynthesis. Our results provide experimental evidence for diversity among microbes in the organization of their central carbon metabolic network and CUE under in situ conditions. These results have important implications for our understanding of how community composition affects soil C cycling and organic matter formation.
Figures
Similar articles
-
Microbial central carbon metabolism in a tidal freshwater marsh and an upland mixed conifer soil under oxic and anoxic conditions.Appl Environ Microbiol. 2024 Jun 18;90(6):e0072424. doi: 10.1128/aem.00724-24. Epub 2024 May 21. Appl Environ Microbiol. 2024. PMID: 38771053 Free PMC article.
-
The Entner-Doudoroff and Nonoxidative Pentose Phosphate Pathways Bypass Glycolysis and the Oxidative Pentose Phosphate Pathway in Ralstonia solanacearum.mSystems. 2020 Mar 10;5(2):e00091-20. doi: 10.1128/mSystems.00091-20. mSystems. 2020. PMID: 32156794 Free PMC article.
-
Fructose metabolism in Chromohalobacter salexigens: interplay between the Embden-Meyerhof-Parnas and Entner-Doudoroff pathways.Microb Cell Fact. 2019 Aug 13;18(1):134. doi: 10.1186/s12934-019-1178-x. Microb Cell Fact. 2019. PMID: 31409414 Free PMC article.
-
Energy use efficiency of soil microorganisms: Driven by carbon recycling and reduction.Glob Chang Biol. 2023 Nov;29(22):6170-6187. doi: 10.1111/gcb.16925. Epub 2023 Aug 30. Glob Chang Biol. 2023. PMID: 37646316 Review.
-
[The unique Entner-Doudoroff (ED) glycolysis pathway of glucose in archaea--a review].Wei Sheng Wu Xue Bao. 2008 Aug;48(8):1126-31. Wei Sheng Wu Xue Bao. 2008. PMID: 18956766 Review. Chinese.
Cited by
-
Microbial central carbon metabolism in a tidal freshwater marsh and an upland mixed conifer soil under oxic and anoxic conditions.Appl Environ Microbiol. 2024 Jun 18;90(6):e0072424. doi: 10.1128/aem.00724-24. Epub 2024 May 21. Appl Environ Microbiol. 2024. PMID: 38771053 Free PMC article.
-
Disproportionate Carbon Dioxide Efflux in Bacterial Metabolic Pathways for Different Organic Substrates Leads to Variable Contribution to Carbon-Use Efficiency.Environ Sci Technol. 2024 Jun 25;58(25):11041-11052. doi: 10.1021/acs.est.4c01328. Epub 2024 Jun 11. Environ Sci Technol. 2024. PMID: 38860668 Free PMC article.
-
Soil viral-host interactions regulate microplastic-dependent carbon storage.Proc Natl Acad Sci U S A. 2024 Nov 5;121(45):e2413245121. doi: 10.1073/pnas.2413245121. Epub 2024 Oct 28. Proc Natl Acad Sci U S A. 2024. PMID: 39467127 Free PMC article.
-
Hydrogen stable isotope probing of lipids demonstrates slow rates of microbial growth in soil.Proc Natl Acad Sci U S A. 2023 Apr 18;120(16):e2211625120. doi: 10.1073/pnas.2211625120. Epub 2023 Apr 10. Proc Natl Acad Sci U S A. 2023. PMID: 37036980 Free PMC article.
References
-
- Sinsabaugh R. L., Manzoni S., Moorhead D. L., Richter A., Carbon use efficiency of microbial communities: Stoichiometry, methodology and modelling. Ecol. Lett. 16, 930–939 (2013). - PubMed
-
- Hagerty S. B., van Groenigen K. J., Allison S. D., Hungate B. A., Schwartz E., Koch G. W., Kolka R. K., Dijkstra P., Accelerated microbial turnover but constant growth efficiency with warming in soil. Nat. Clim. Chang. 4, 903–906 (2014).
-
- Geyer K. M., Kyker-Snowman E., Grandy A. S., Frey S. D., Microbial carbon use efficiency: Accounting for population, community, and ecosystem-scale controls over the fate of metabolized organic matter. Biogeochemistry 127, 173–188 (2016).
-
- Dijkstra P., Dalder J. J., Selmants P. C., Hart S. C., Koch G. W., Schwartz E., Hungate B. A., Modeling soil metabolic processes using isotopologue pairs of position-specific 13C-labeled glucose and pyruvate. Soil Biol. Biochem. 43, 1848–1857 (2011).
-
- Dauner M., Bailey J. E., Sauer U., Metabolic flux analysis with a comprehensive isotopomer model in Bacillus subtilis. Biotechnol. Bioeng. 76, 144–156 (2001). - PubMed
LinkOut - more resources
Full Text Sources
