. 2022 Nov 4;8(44):eabl9583.
doi: 10.1126/sciadv.abl9583. Epub 2022 Nov 4.

Early developmental plasticity enables the induction of an intermediate extraembryonic cell state

Affiliations

Early developmental plasticity enables the induction of an intermediate extraembryonic cell state

Anusha Sathyanarayanan et al. Sci Adv. .

Abstract

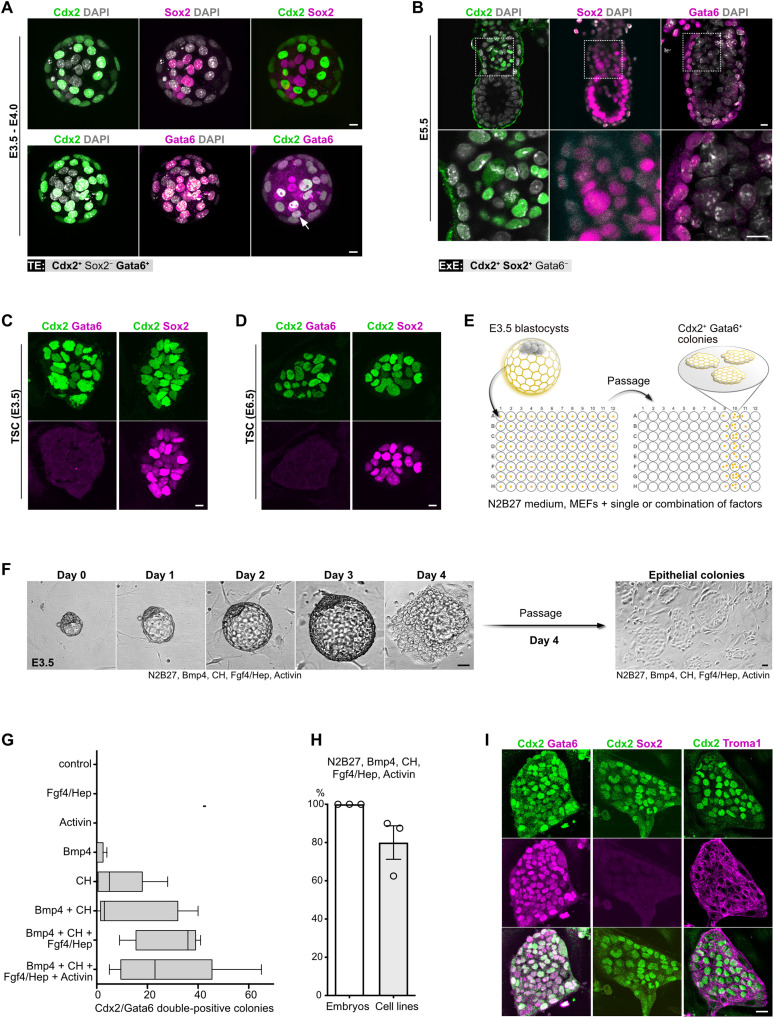
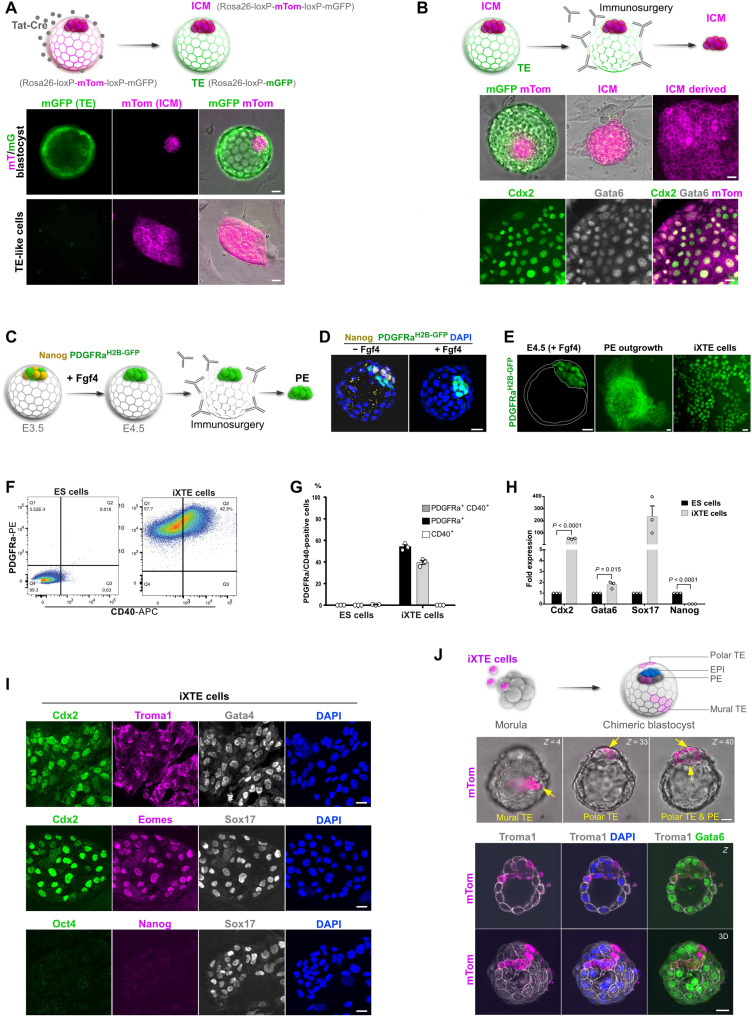
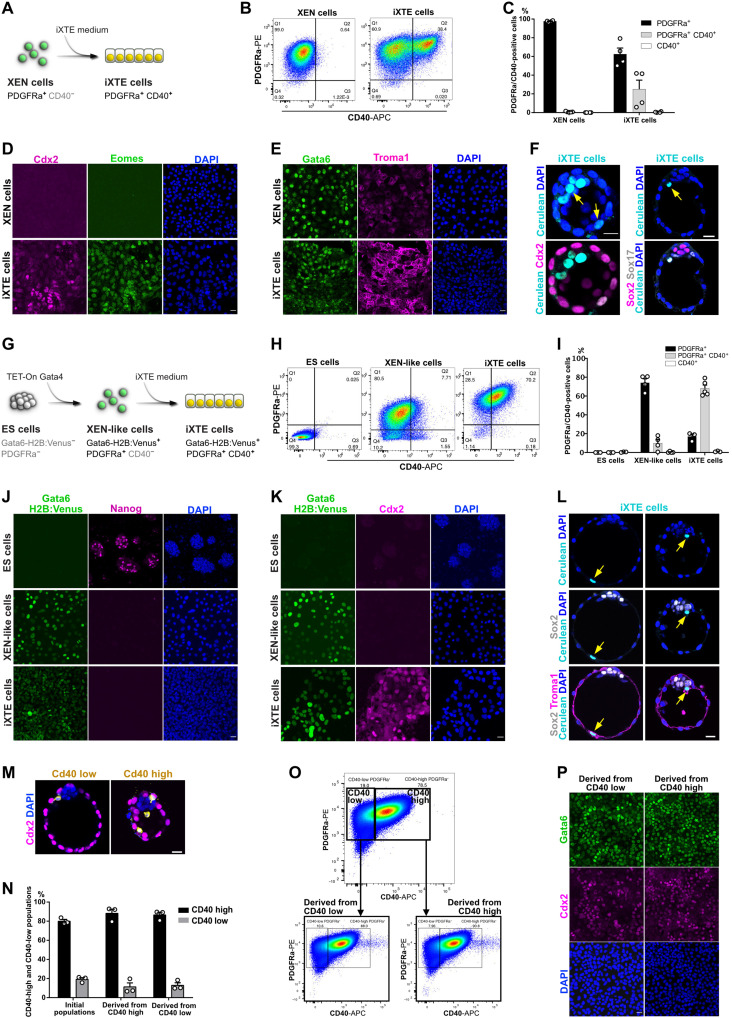
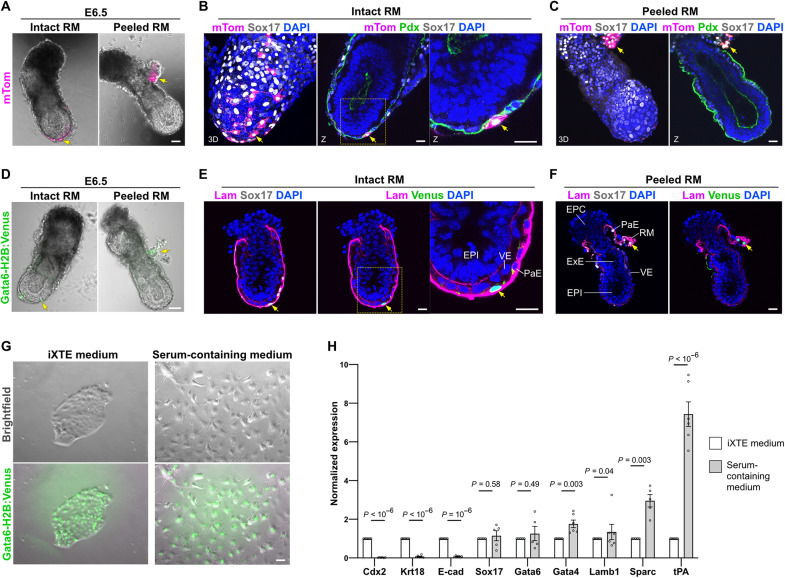
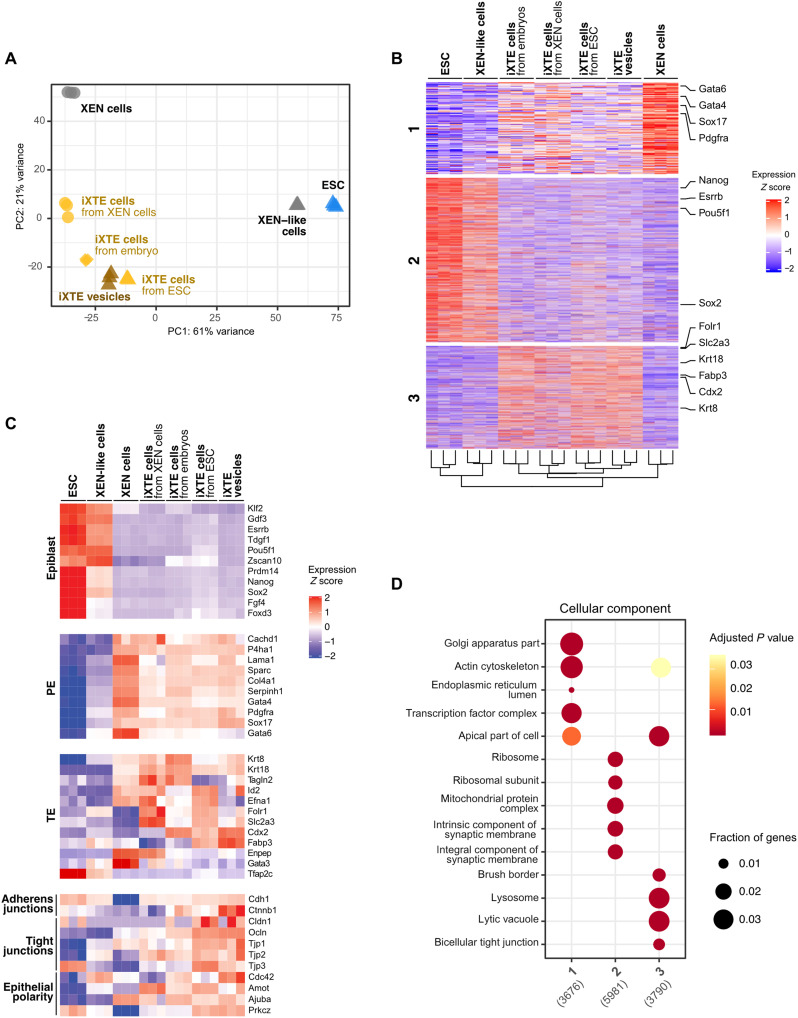
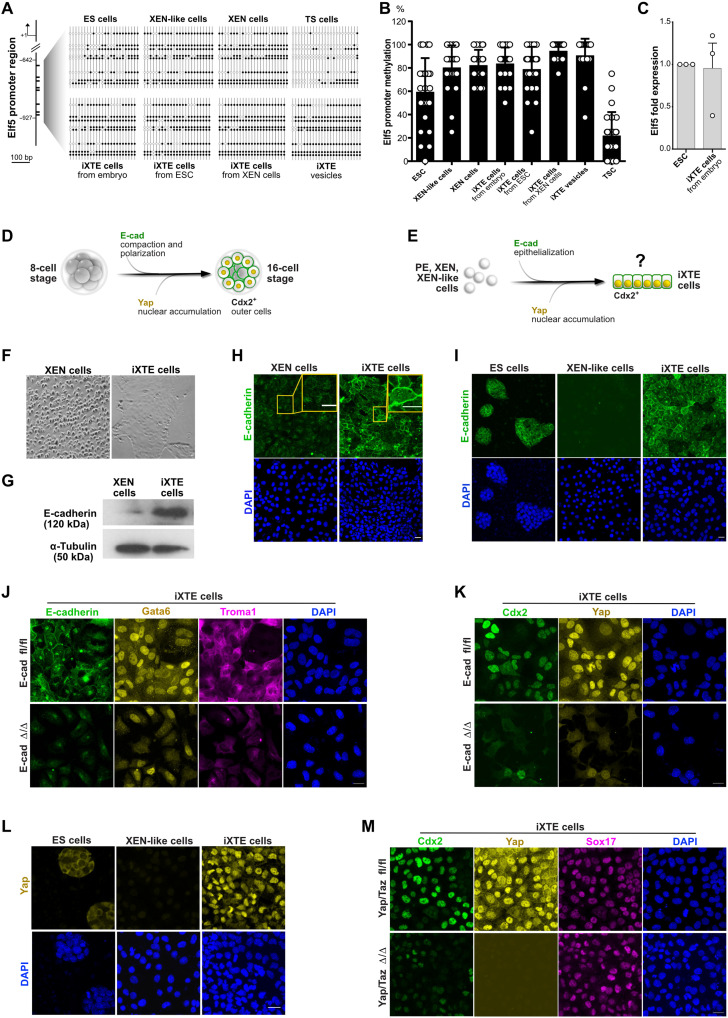
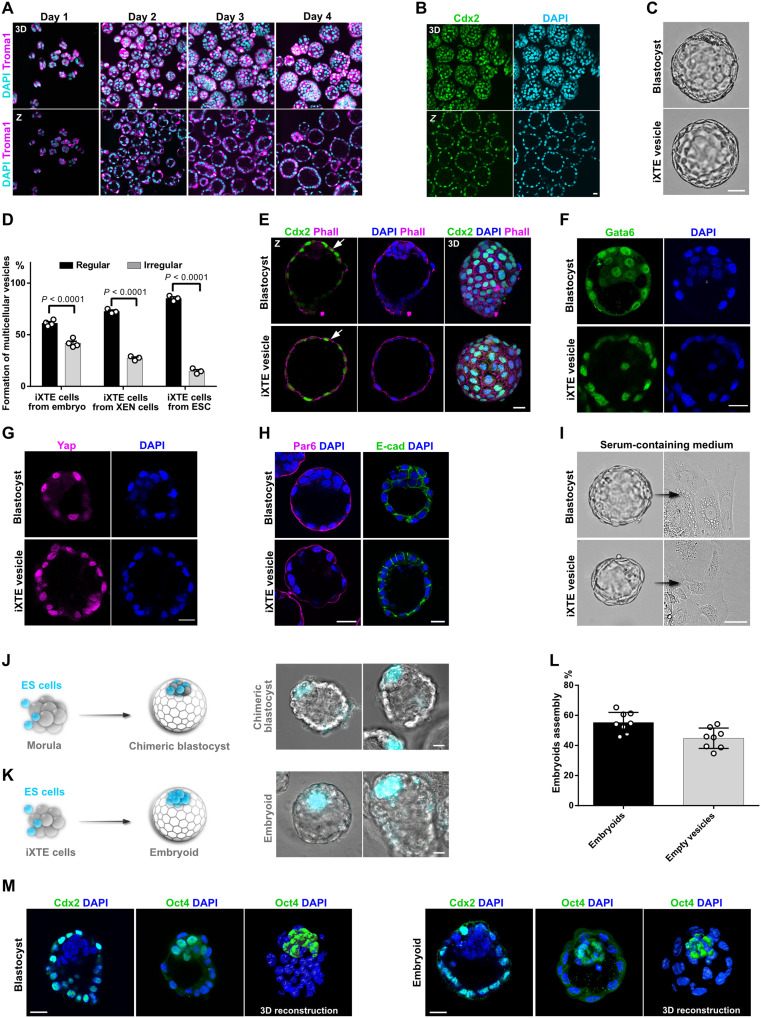
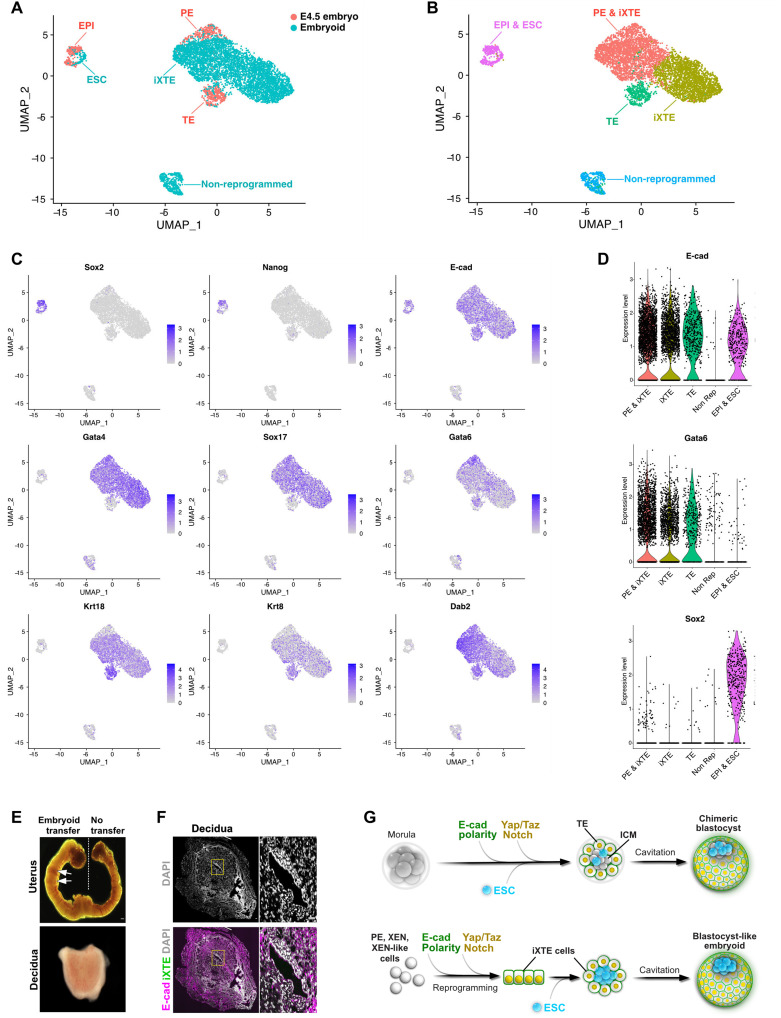
Two fundamental elements of pre-implantation embryogenesis are cells' intrinsic self-organization program and their developmental plasticity, which allows embryos to compensate for alterations in cell position and number; yet, these elements are still poorly understood. To be able to decipher these features, we established culture conditions that enable the two fates of blastocysts' extraembryonic lineages-the primitive endoderm and the trophectoderm-to coexist. This plasticity emerges following the mechanisms of the first lineage segregation in the mouse embryo, and it manifests as an extended potential for extraembryonic chimerism during the pre-implantation embryogenesis. Moreover, this shared state enables robust assembly into higher-order blastocyst-like structures, thus combining both the cell fate plasticity and self-organization features of the early extraembryonic lineages.


Figures

Fig. 1.
Fig. 1.. Derivation of TE-like cells from mouse blastocysts.
(A) Blastocyst-stage embryos stained for Cdx2, Sox2, and Gata6. Arrow indicates Gata6 and Cdx2 colocalization. Nuclei were counterstained with 4′,6-diamidino-2-phenylindole (DAPI). (B) E5.5 egg cylinders stained for Cdx2, Sox2, and Gata6. Nuclei were counterstained with DAPI. (C) TSC (E3.5) stained for Cdx2, Sox2, and Gata6. (D) TSC (E6.5) stained for Cdx2, Sox2, and Gata6. (E) Schematic representation of the experimental workflow used for TE-like cell derivation. (F) Snapshot images of mouse blastocyst cultured in iXTE medium and the subsequent establishment of epithelial colonies following the dissociation of the blastocyst outgrowth. (G) Number of Cdx2/Gata6 double-positive colonies formed in medium supplemented with different combinations of factors. Error bars represent SEM. (H) Efficiency of TE-like cell derivation from blastocyst-stage embryos using iXTE medium, n embryos = 26; three independent experiments, error bars represent SEM. (I) TE-like cells stained for Cdx2, Gata6, cytokeratin-8 (Troma1), and Sox2. Scale bars, 10 μm (A to D), 40 μm (F), and 20 μm (I).
Fig. 2.
Fig. 2.. Origin and developmental potential of the TE-like cells.
(A) Schematic representation of the Tat-Cre/loxP recombination of the mT/mG locus (top); mT/mG embryos after Tat-Cre treatment (middle) and cells derived from the Tat-Cre–treated embryos (bottom). (B) Schematic representation of TE immunosurgery using mT/mG embryos subjected to Tat-Cre recombination (top); embryo before and after removal of TE (middle); mTom+ ICM–derived TE-like cells stained for Cdx2 and Gata6 (bottom). (C) Schematic representation of the conversion of the ICM into PE and subsequent isolation of the PE via immunosurgery. (D) Control and Fgf4-treated embryos stained for Nanog, PDGFRaH2B-GFP, and DAPI. (E) E4.5 PDGFRaH2B-GFP blastocyst treated with Fgf4, PE outgrowth, and iXTE cells. (F) FACS analysis of iXTE cells and ESC using PDGFRα and CD40. (G) Quantification of PDGFRα- and CD40-expressing cells; three independent experiments, error bars represent SEM. (H) Quantitative polymerase chain reaction (qPCR) analysis in iXTE cells and ESC. β-Actin was used for normalization, and error bars represent SEM, unpaired Student’s t test, n = 3. (I) iXTE cells stained for TE markers—Cdx2, Troma1, and eomes; PE markers—Gata4 and Sox17; and epiblast markers—Oct4 and Nanog; nuclei were counterstained with DAPI. (J) Schematic representation of chimeric blastocyst formation (top); chimeric blastocyst with incorporated iXTE cells, arrows indicate the mTom-expressing iXTE cells (middle); chimeric embryos (n = 13) stained for mTom, Gata6, Troma1, and DAPI (bottom). Scale bars, 20 μm (A, B, D, E, and G) and 40 μm (H). See also fig. S1.
Fig. 3.
Fig. 3.. Establishment of XEN state is required for the activation of core TE genes.
(A) Conversion of XEN to iXTE cells. (B) FACS analysis of XEN reprogramming to iXTE cells. (C) Quantification of PDGFRα- and CD40-expressing cells based on FACS analysis; error bars represent SEM, n = 4. (D) XEN and XEN-derived iXTE cells stained for Cdx2, eomes, and DAPI. (E) XEN and XEN-derived iXTE cells stained for Gata6, Troma1, and DAPI. (F) Chimeric blastocysts stained for Cdx2 and DAPI (n = 18) or Sox2, Sox17, and DAPI (n = 11). Arrows indicate the Histone H2B:Cerulean-positive iXTE cells. (G) ESC reprogramming to iXTE cells via an intermediate XEN-like state. (H) FACS analysis for PDGFRα and CD40 expression in ESC, XEN-like cells, and iXTE cells. (I) Quantification of PDGFRα- and CD40-expressing cells based on the FACS analysis; error bars represent SEM, n = 3. (J) ESC, XEN-like, and iXTE cells stained for Gata6 H2B:Venus, Nanog, and DAPI. (K) ESC, XEN-like, and iXTE cells stained for Gata6 H2B:Venus, Cdx2, and DAPI. (L) Chimeric blastocyst (n = 10) stained for Troma1, Sox2, and DAPI. Arrows indicate the Histone H2B:Cerulean-positive iXTE cells. (M) Incorporation of CD40-low or CD40-high cells in chimeric embryos (n = 9) stained from Cdx2, mTom, and DAPI. (N) Quantification of CD40-low and CD40-high expressing cells based on FACS analysis, three independent experiments. (O) FACS analysis of the initial CD40-high and CD40-low expressing populations and after one passage. (P) Cells derived from CD40-high and CD40-low populations and stained for Cdx2, Gata6, and DAPI. Scale bars, 20 μm (D to F, J to M, and P); see also figs. S2 and S3.
Fig. 4.
Fig. 4.. Differentiation potential of iXTE cells.
(A) E6.5 chimeric embryo with intact (left) and peeled RM (right), containing mTom-positive cells. (B) E6.5 chimeric embryo with intact RM, containing mTom-positive cells (n chimeric E6.5 embryos = 23), stained for Sox17, mTom, Pdx (podocalyxin), and DAPI. All chimeric embryos showed iXTE contribution to the PaE but not to VE or ExE. (C) E6.5 chimeric embryo with peeled RM, containing mTom-positive cells, Sox17, mTom, Pdx, and DAPI. (D) E6.5 chimeric embryo with intact (left) and peeled RM (right), containing Gata6-H2B:Venus–positive cells. (E) E6.5 chimeric embryo with intact RM, containing Gata6-H2B:Venus–positive cells (n chimeric E6.5 embryos = 4), stained for Sox17, Laminin B1, Venus, and DAPI. (F) E6.5 chimeric embryo with peeled RM, containing Gata6-H2B:Venus–positive cells (n chimeric E6.5 embryos = 4), stained for Sox17, Laminin B1, Venus, and DAPI. (G) Gata6-H2B:Venus iXTE cells cultured for 2 days on fibronectin-coated plates in the presence of iXTE medium (left) or serum-containing medium (right). (H) qPCR analysis of marker gene expression in undifferentiated and differentiated iXTE cells; error bars represent SEM, n > 4; unpaired Student’s t test. Scale bars, 40 μm (A, D, and G) and 20 μm (B, C, E, and F). See also fig. S4.
Fig. 5.
Fig. 5.. Transcriptomic profiling of iXTE cells.
(A) PCA of gene expression in embryo-, ESC-, and XEN cell–derived iXTE cells and ESC/iXTE vesicles, including the parental cell lines, namely, XEN cells, ESC, and XEN-like cells. (B) K-means clustering of gene expression reveals three major clusters corresponding to gene expression enriched in XEN cells (cluster 1), ESC (cluster 2), and iXTE cells (cluster 3). (C) Expression of epiblast, PE, and TE markers and factors involved in the formation of adherens junctions, tight junctions, and epithelial polarity in iXTE cells, ESC, XEN-like, and XEN cells. (D) GO “cellular component” enrichment analysis for each gene cluster defined in (B). See also fig. S5.
Fig. 6.
Fig. 6.. Mechanism of XEN-state reprogramming into iXTE cells.
(A) Methylation status of the Elf5 promoter in ESC, XEN-like cells, XEN cells, iXTE cells, and TSC determined by bisulfite sequencing. White and black circles represent unmethylated and methylated CpGs, respectively. (B) Quantification of Elf5 promoter methylation. (C) qPCR analysis of Elf5 expression in ESC and embryo-derived iXTE normalized to β-actin expression; error bars represent SEM, n = 4. (D) Schematic representation of the 8- to 16-cell-stage transition during mouse pre-implantation embryogenesis including the process of E-cad–mediated compaction and Yap-mediated Cdx2 activation in the outer cells. (E) Schematic representation of the potential mechanism of XEN state reprogramming to iXTE cells, following the principles of the TE specification in mouse embryos. (F) Bright-field images of XEN cells and XEN-derived iXTE cells. (G) Western blot analysis for E-cad expression in XEN and iXTE cells. α-Tubulin was used an internal control. (H) XEN and XEN-derived iXTE cells stained for E-cad and DAPI. (I) Expression of E-cad in ESC, XEN-like cells, and ESC-derived iXTE cells. (J) Expression of E-cad, Gata6, Troma1, and DAPI in E-cad fl/fl iXTE cells and E-cad Δ/Δ iXTE cells. (K) E-cad fl/fl iXTE cells and E-cad Δ/Δ iXTE cells stained for Cdx2, Yap, and DAPI. (L) Expression of Yap in ESC, XEN-like cells, and iXTE cells. (M) Yap/Taz fl/fl iXTE cells and Yap/Taz Δ/Δ iXTE cells stained for Cdx2, Yap, Sox17, and DAPI. Scale bars, 20 μm (H to M). See also fig. S6.
Fig. 7.
Fig. 7.. Tissue-scale organization properties of iXTE cells and assembly of blastocyst-like embryoids.
(A) iXTE cells were grown on cell-repellent plates for a period of four days in iXTE medium to form multicellular vesicles. The vesicles were fixed at 24-hour intervals and stained for Troma1 and DAPI. (B) Day 4 iXTE vesicles stained for Cdx2 and DAPI. (C) Bright-field images of mouse blastocyst and an iXTE vesicle. (D) Percentage of cavitation representing the efficiency of vesicle formation of iXTE cells derived from embryo, XEN cells, and ESC. The regular vesicles are represented in black and irregular ones in gray. Error bars represent SEM, three independent experiments. (E) Blastocyst and iXTE vesicles stained for Cdx2, Phall, and DAPI. (F) Blastocyst and iXTE vesicles stained for Gata6 and DAPI. (G) Blastocyst and iXTE vesicles stained for Yap and DAPI. (H) Blastocyst and iXTE vesicles stained for Par6, E-cad, and DAPI. (I) Bright-field images of a blastocyst and iXTE vesicle placed in serum-containing medium. (J) Schematic representation of ESC/morula aggregation and formation of chimeric blastocyst (left); chimeric blastocyst with incorporated ESC (right). (K) Schematic representation of ESC/iXTE cell aggregation and formation of blastocyst-like embryoids (left); iXTE cell–based embryoids with incorporated ESC (right). (L) Efficiency of embryoids assembly, eight independent experiments. (M) Blastocysts and embryoids stained for Cdx2 or Oct4 and DAPI. 3D reconstruction of blastocyst and embryoid stained for Oct4 and DAPI is represented in the right. Scale bars, 20 μm. See also fig. S7 and movies S1 and S2.
Fig. 8.
Fig. 8.. scRNA-seq analysis.
(A) Uniform manifold approximation and projection (UMAP) plot of the single-cell transcriptomes of E4.5 blastocysts (orange) and iXTE/ESC-based embryoids (blue). (B) UMAP plot displaying cells clustering. (C) UMAP plots of lineage markers expression. (D) Violin plot of E-cad, Gata6, and Sox2 expression in the different cell clusters. (E) Embryoids transferred into the uterus of pseudopregnant females induce decidualization, arrows indicate deciduae. (F) Sections of decidua induced by embryoid transfer and stained for E-cad and iXTE cells expressing Venus. (G) TE lineage specification and incorporation of ESC (top). Reprogramming of XEN state cells to iXTE cells, subsequent cavitation and embryoids’ self-assembly (bottom). Scale bars, 40 μm (E and F). See also fig. S7.

Similar articles

Cited by

References

    1. Govindasamy N., Duethorn B., Oezgueldez H. O., Kim Y. S., Bedzhov I., Test-tube embryos–Mouse and human development in vitro to blastocyst stage and beyond. Int. J. Dev. Biol. 63, 203–215 (2019). - PubMed
    1. Morris S. A., Teo R. T. Y., Li H., Robson P., Glover D. M., Zernicka-Goetz M., Origin and formation of the first two distinct cell types of the inner cell mass in the mouse embryo. Proc. Natl. Acad. Sci. U.S.A. 107, 6364–6369 (2010). - PMC - PubMed
    1. Yamanaka Y., Lanner F., Rossant J., FGF signal-dependent segregation of primitive endoderm and epiblast in the mouse blastocyst. Development 137, 715–724 (2010). - PubMed
    1. Posfai E., Petropoulos S., de Barros F. R. O., Schell J. P., Jurisica I., Sandberg R., Lanner F., Rossant J., Position- and Hippo signaling-dependent plasticity during lineage segregation in the early mouse embryo. eLife 6, e22906 (2017). - PMC - PubMed
    1. Nichols J., Smith A., Pluripotency in the embryo and in culture. Cold Spring Harb. Perspect. Biol. 4, a008128 (2012). - PMC - PubMed