. 2022 Nov 4;8(44):eabo2336.
doi: 10.1126/sciadv.abo2336. Epub 2022 Nov 4.

Microtubule retrograde flow retains neuronal polarization in a fluctuating state

Affiliations

Microtubule retrograde flow retains neuronal polarization in a fluctuating state

Max Schelski et al. Sci Adv. .

Abstract

In developing vertebrate neurons, a neurite is formed by more than a hundred microtubules. While individual microtubules are dynamic, the microtubule array has been regarded as stationary. Using live-cell imaging of neurons in culture or in brain slices, combined with photoconversion techniques and pharmacological manipulations, we uncovered that the microtubule array flows retrogradely within neurites to the soma. This flow drives cycles of microtubule density, a hallmark of the fluctuating state before axon formation, thereby inhibiting neurite growth. The motor protein dynein fuels this process. Shortly after axon formation, microtubule retrograde flow slows down in the axon, reducing microtubule density cycles and enabling axon extension. Thus, keeping neurites short is an active process. Microtubule retrograde flow is a previously unknown type of cytoskeletal dynamics, which changes the hitherto axon-centric view of neuronal polarization.


Figures

Fig. 1.
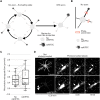
Fig. 1.. The entire microtubule array in the neurite flows retrogradely before axon growth.
The tubulin subtype TUBB2a was fused either (A to C) to the photoconvertible fluorophore mEos3.2 or (D to F) to the photoactivatable fluorophore Dronpa expressed in neurons and imaged after 1 day in culture. (A) Illustration of photoconversion experiment for (B) and (C). (B and C) Small microtubule patches were photoconverted in two neurites of neurons without an axon. (B) MT-RF in neurons without axons (n = 71 cells, N = 11 independent experiments). Each data point represents one neurite. (C) Representative cell for (B). (D) Illustration of photoactivation experiment for (E) and (F). (E) Two or three microtubule patches were photoactivated in a single neurite. For each neurite, the distance difference of the patch that moved furthest and the patch that moved the least was divided by the lower distance (n = 44 cells, N = 9 independent experiments). (F) Representative cell for (E). The thick line in boxplots shows mean. Scale bars, 20 μm (overview images) and 5 μm (zoomed images).
Fig. 2.
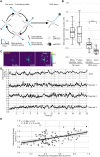
Fig. 2.. MT-RF slows down in the axon.
The tubulin subtype TUBB2a was fused to the photoconvertible fluorophore mEos3.2 expressed in neurons and imaged after 1 day in culture. (A) Illustration of photoconversion experiment for (B) and (C). (B and C) MT-RF in minor neurites and axons (n = 26 cells, N = 8 independent experiments). Arrows indicate location of photoconversion at 0:00 min. (D to F) Embryonic brains were electroporated ex utero at embryonic day 14.5 (E14.5) with tubulin subtype TUBB2a, fused to three times photoconvertible fluorophore mEos3.2. Brains were then sliced coronally, kept in the incubator for 2 days, and then imaged. (D) Illustration of the photoconversion experiment for (E) and (F). (E) MT-RF of neurons in brain slices. (n = 25 cells, N = 8 independent experiments). (F) Maximum intensity projection of the neuron photoconverted at 0:00 min, with arrows pointing to the photoconversion site. The thick line in boxplots shows mean. Arrows indicate the location of photoconversion at 0:00 min. **P < 0.01 and ***P < 0.001, Wilcoxon signed-rank test. Scale bars, 20 μm (overview images) and 5 μm (zoomed images).
Fig. 3.
Fig. 3.. MT-RF slows down shortly after axon growth.
CAMSAP3 was fused to the fluorophore mNeonGreen and the cytosolic fluorophore tandem-mCherry (cytosol) expressed in neurons and imaged after 1 day in culture. (A) Illustration of long-term imaging of MT-RF by imaging the microtubule (minus) end-binding protein CAMSAP3 for (B) and (C). (B and C) MT-RF was averaged over 200 min and was considered slowed down once it was 20% slower in the axon compared to all other neurites for 95% of time points for at least 180 min (n = 15 cells, from those, 10 cells for time of MT-RF slowdown, N = 6 independent experiments). (D) Cell morphology of neuron from (E) with the fluorophore tandem-mCherry to label the cytosol before (0:30 hours) and after (5:48 hours) the axon reached axon-like length and when MT-RF slowed down in the axon (10:22 hours). Neurites from (E) are labeled at 10:22 hours. (E) Neon-CAMSAP3 intensity along each neurite (x axis) over time (y axis; kymograph). The left site is close to the soma. Thus, a trace from top right to lower left indicates MT-RF. The thick and thin dashed lines indicate the time when the future axon reached axon-like length (5:48 hours) and when MT-RF slowed down in the axon compared to all other neurites (8:02 hours), respectively. The thick line in boxplots shows mean. Scale bar, 20 μm.
Fig. 4.
Fig. 4.. MT-RF does not slow down in neurites with axon-like properties.
Neurons expressing the tubulin subtype TUBB2a fused to the photoconvertible fluorophore mEos3.2, and caKIF5C fused to the fluorophore Cerulean3, were cultured for 1 day and then imaged. (A) Illustration of fluctuations of caKIF5C before axon formation. (B) Illustration of photoconversion experiments for (C) and (D). (C and D) MT-RF quantified in neurites without and with caKIF5C accumulation in neurons without axons (n = 18 cells, N = 8 independent experiments). White arrows in the photoconverted channel of (D) indicate areas of photoconversion and, in the caKIF5C channel, point to the growth cone with caKIF5C accumulation. The thick line in boxplots shows mean. P > 0.05, Wilcoxon signed-rank test. Scale bars, 20 μm (overview images) and 5 μm (zoomed images).
Fig. 5.
Fig. 5.. MT-RF could keep neurons in the fluctuating state.
Neurons expressing the fluorophore mNeonGreen fused to CAMSAP3 and TUBB2a fused to the fluorophore mScarlet were cultured for 1 day. Then, microtubules and MT-RF were imaged simultaneously in neurons from before to after axon formation. Microtubule density was calculated by dividing the average tubulin intensity by the tubulin expression level in the neuron, modeled as a quadratic function of the average intensity in all neurites for each time point. Changes of average microtubule density in a neurite of 0.2 or more were considered half a cycle. For a full cycle, an increase followed by a decrease, or vice versa, was required [n = 15 cells after axon growth (With axon), of those n = 14 cells before axon growth (No axon), N = 3 independent experiments]. (A) Illustration of fluctuations of microtubule density and caKIF5C before axon formation. (B) Microtubule density cycles in neurons before and after axon formation. Microtubule density cycles were averaged for all minor neurites of one neuron. (C and D) Representative cell for (B). (C) Morphology and color-coded tubulin intensity (blue, lower intensity; yellow, higher intensity) at the start of imaging (0:30 hours), directly after (13:09 hours), and some hours after (18:20 hours) axon growth. Neurite numbers from (D) are annotated at the last time frame. (D) Microtubule density was smoothed with a rolling window of 2. The dashed line indicates the time of axon formation. (E) Correlation and linear regression of MT-RF with microtubule density cycles (Pearson r = 0.46, P = 0.0000021; n = 95 neurites from 14 cells, N = 3 independent experiments). The thick line in boxplots shows mean. ***P < 0.001, Wilcoxon signed-rank test. Scale bar, 20 μm.
Fig. 6.
Fig. 6.. Stabilizing axon identity in multiple neurites slows down MT-RF.
The tubulin subtype TUBB2a fused to the photoconvertible fluorophore mEos3.2 was expressed in neurons and imaged after 1 day in culture directly after treating neurons for 20 to 240 min with pa-Blebb (40 μM), taxol (6 nM), or control [dimethyl sulfoxide (DMSO)]. (A) Illustration of photoconversion experiment after drug treatments shown in (B) and (C). (B and C) MT-RF after pa-Blebb, taxol, and control treatment (n = 22 cells, N = 4 for taxol; n = 32 cells, N = 4 for pa-Blebb; n = 54 cells, N = 11 for control without axon; and n = 40 cells, N = 9 for control with axon; N, number of independent experiments). (C) Arrows indicate location of photoconversion at 0:00 min. ***P < 0.001, Kruskal-Wallis multiple comparison with Dunn’s post hoc test with Bonferroni correction. Scale bars, 20 μm (overview images) and 5 μm (zoomed images).
Fig. 7.
Fig. 7.. Stabilizing axon identity in multiple neurites reduces microtubule density cycles.
The tubulin subtype TUBB2a fused to the fluorophore mNeonGreen was expressed in neurons and imaged after 1 day in culture directly after treating neurons for 20 to 240 min with pa-Blebb (40 μM), taxol (6 nM), or control (DMSO). (A) Illustration of experiment after drug treatments shown in (B) and (C). (B to D) Microtubule density was obtained by normalizing the average tubulin intensity by the tubulin expression level in the neuron, modeled as a linear function of the average intensity in all neurites for each time point. Microtubule density cycles were measured by counting the density increases followed by decreases in neurites of at least 0.2. Neurons were traced, and average intensity along neurites was measured using a self-made fully automated algorithm. (B) The number of cycles per hour was averaged for all neurites of a neuron before axon formation (n = 34 cells for taxol, N = 3; n = 21 cells for pa-Blebb, N = 2; and n = 27 cells for control, N = 3). (C) Morphology and color-coded tubulin intensity (blue, lower intensity; yellow, higher intensity) of neurons at the start of imaging. (D) Microtubule density was smoothed with a rolling window of two frames. The thick line in boxplots shows mean. ***P < 0.001, Kruskal-Wallis multiple comparison with Dunn’s post hoc test with Bonferroni correction. Scale bar, 20 μm.
Fig. 8.
Fig. 8.. Dynein inhibition slows down MT-RF.
Neurons expressed the tubulin subtype TUBB2a fused to the photoconvertible fluorophore mEos3.2 and were imaged after 1 day in culture. (A) Illustration of experiments. (B) Neurons were treated with 50 μM ciliobrevin A for 30 to 60 min and then imaged (n = 26 cells, N = 3 for control; n = 32 cells, N = 4 for ciliobrevin). (C) Neurons expressed the Cerulean3-labeled N-terminal 234 amino acids of the dynein intermediate chain 2 (IC2N), which inhibits dynein through the dynein-dynactin interaction (n = 19 cells, N = 3 for control; n = 24 cells, N = 4 for IC2N). (D and E) Representative neurons for (D) ciliobrevin treatment in (B) and for (E) IC2N expression in (C). Arrows indicate the location of photoconversion at 0:00 min. ***P < 0.001, Dunn’s test. Scale bars, 20 μm (overview images) and 5 μm (zoomed images).
Fig. 9.
Fig. 9.. Dynein at the plasma membrane speeds up MT-RF.
Neurons expressed the fluorophore mNeonGreen fused to CAMSAP3 and were imaged after 1 day in culture. (A) Illustration of the chemical dimerization used to recruit proteins to the plasma membrane. Dimerization domains 1 and 2 are FK506-binding protein (FKBP) and FKBP-rapamycin binding (FRB), respectively. (B) The N-terminal domain of the dynein adaptor bicDN (amino acids 1 to 594) was recruited to the membrane anchor CAAX in (C) and (D). (C and D) Neurons expressed FRB-Cerulean3-CAAX for control, and with bicDN additionally tdTomato-bicDN-FKBP. Neurons were imaged for 20 to 40 min, after which 0.5 μM rapalog A/C Dimerizer was added, and imaging continued. (C) Average MT-RF before and 6 min to 1 hour after dimerization was calculated from CAMSAP3 traces (for bicDN, n = 28 cells, N = 5; for control, n = 49, N = 3). (D) CAMSAP3 intensity along neurites (x axis) over time (y axis; kymograph). Dashed lines show the time at which the dimerizer was added. (E) Wild-type or adenosine triphosphatase (ATPase)–deficient mutated (K2599T) dynein1 motor domain (Dync1h1motor; amino acids 1453 to 4644) was recruited to the membrane anchor C2 for (F) and (G). (F and G) Neurons expressed FRB-C2-Cerulean3 with FKBP-mScarlet-Dync1h1motor (wild type) or FKBP-mScarlet-Dync1h1motorK2599T (motor deficient). Neurons were imaged for 1 to 2 hours, and then 0.5 μM rapalog A/C Dimerizer was added before continuing imaging. (F) Average MT-RF was calculated before and 6 min to 1 hour after dimerization from CAMSAP traces (n = 23 cells for wild-type dynein motor, n = 22 cells for motor-deficient dynein motor, N = 5 independent experiments). (G) CAMSAP3 intensity along neurites (x axis) over time (y axis; kymograph). Dashed lines show the time at which the dimerizer was added. **P < 0.01 and ***P < 0.001, Kruskal-Wallis multiple comparison with Dunn’s post hoc test with Bonferroni correction.
Fig. 10.
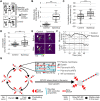
Fig. 10.. Dynein at the plasma membrane induces immediate MT density decrease and retraction.
Neurons expressed the fluorophore mNeonGreen fused to CAMSAP3 and were imaged after 1 day in culture. (A) The wild-type motor domain of dynein1 was recruited to the membrane anchor C2 for (B) to (F). (B to F) Neurons expressed FRB-C2-Cerulean3, FKBP-Halo-Dync1h1motor, and TUBB2a-mScarlet. Neurons were imaged for 20 to 40 min, and then 62.5 nM rapalog A/C Dimerizer was added before continuing imaging. (B) MT-RF was measured from CAMSAP3 traces by averaging MT-RF from 1.5 to 15 min after dimerization. To obtain neurites with speedup from neurons with membrane-recruited dynein motor, neurites with MT-RF faster than 1 μm/min were used, while control neurites were analyzed independent of their MT-RF. Speedup was observed for membrane-recruited dynein in 86 of 368 neurites, but in 0 of 243 neurites for control. For control in (C) to (F), n = 62 cells; of those for (B), n = 48 cells, N = 6; for speedup, n = 30 cells, N = 5. (C) Immediate MT density decrease was calculated as the difference in normalized microtubule intensity in one neurite from before dimerization to the lowest intensity 6 to 12 min after dimerization. (D) Retraction was calculated as the difference in length of one neurite before dimerization to the smallest length 6 to 18 min after dimerization. (E) Morphology of representative cells with the neurites shown in (F) indicated by arrows. (F) Normalized tubulin intensity and length of representative neurites. (G) Illustration of MT-RF fueling fluctuations and then MT-RF slowing down in the axon. The thick line in boxplots shows mean. **P < 0.01 and ***P < 0.001, Dunn’s test. Scale bar, 20 μm.

Similar articles

Cited by

References

    1. Yu W., Baas P. W., Changes in microtubule number and length during axon differentiation. J. Neurosci. 14, 2818–2829 (1994). - PMC - PubMed
    1. Kapitein L. C., Hoogenraad C. C., Building the neuronal microtubule cytoskeleton. Neuron 87, 492–506 (2015). - PubMed
    1. Baas P. W., Nadar C. V., Myers K. A., Axonal transport of microtubules: The long and short of It. Traffic 7, 490–498 (2006). - PubMed
    1. Lüders J., Nucleating microtubules in neurons: Challenges and solutions. Dev. Neurobiol. 81, 273–283 (2020). - PubMed
    1. Stiess M., Maghelli N., Kapitein L. C., Gomis-Rüth S., Wilsch-Bräuninger M., Hoogenraad C. C., Tolić-Nørrelykke I. M., Bradke F., Axon extension occurs independently of centrosomal microtubule nucleation. Science 327, 704–707 (2010). - PubMed