

miRNA probe integrated biosensor platform using bimetallic nanostars for amplification-free multiplexed detection of circulating colorectal cancer biomarkers in clinical samples
- PMID: 36332335
- PMCID: PMC9881606
- DOI: 10.1016/j.bios.2022.114855
miRNA probe integrated biosensor platform using bimetallic nanostars for amplification-free multiplexed detection of circulating colorectal cancer biomarkers in clinical samples
Abstract
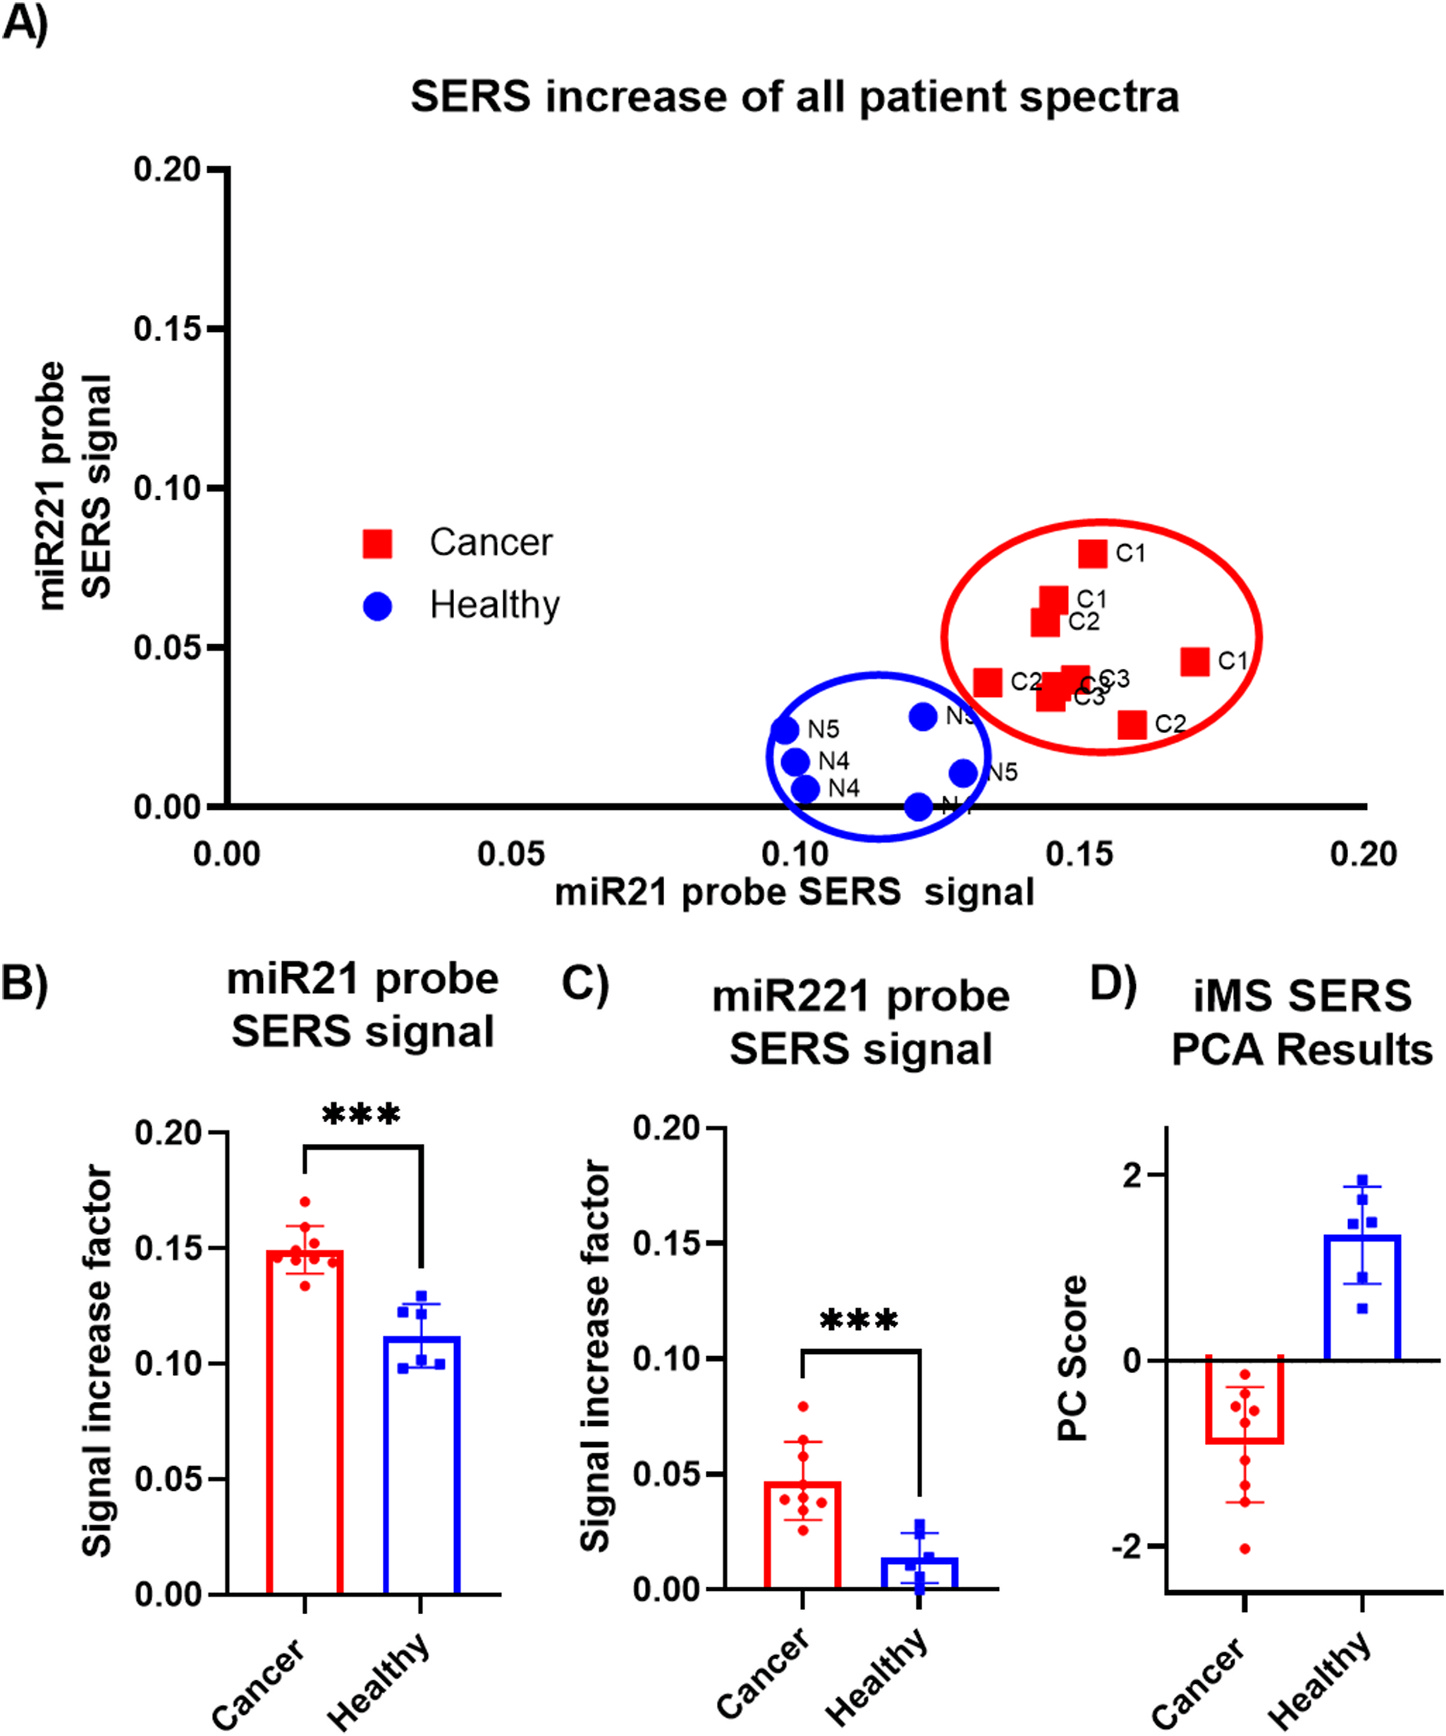
There is a critical need for sensitive and rapid detection technologies utilizing molecular biotargets such as microRNAs (miRNAs), which regulate gene expression and are a promising class of diagnostic biomarkers for disease detection. Here, we present the development and fabrication of a highly reproducible and robust plasmonic bimetallic nanostar biosensing platform to detect miRNA targets using surfaced-enhanced Raman scattering (SERS)-based gene probes called the inverse Molecular Sentinel (iMS). We investigated and optimized the integration of iMS gene probes onto this SERS substrate, achieving ultra-sensitive detection with limits of detection of 6.8 and 16.7 zmol within the sensing region for two miRNA sequences of interest. Finally, we demonstrated the biomedical usefulness of this nanobiosensor platform with the multiplexed detection of upregulated miRNA targets, miR21 and miR221, from colorectal cancer patient plasma. The resulting SERS data are in excellent agreement with PCR data obtained from patient samples and can distinguish between healthy and cancerous patient samples. These results underline the potential of the iMS-integrated substrate nanobiosensing platform for rapid and sensitive diagnostics of cancer biomarkers for point-of-care applications.
Keywords: Biosensor; Early detection; Plasmonic nanoparticle; SERS Substrate; miRNA detection.
Copyright © 2022 Elsevier B.V. All rights reserved.
Conflict of interest statement
Declaration of competing interest The authors declare that they have no known competing financial interests or personal relationships that could have appeared to influence the work reported in this paper.
Figures


References
-
- Bailey C, Richardson LC, Allemani C, Bonaventure A, Harewood R, Moore AR, Stewart SL, Weir HK, Coleman MP, Members CWGU, 2018. Adult leukemia survival trends in the United States by subtype: a population-based registry study of 370,994 patients diagnosed during 1995–2009. Cancer-Am Cancer Soc 124 (19), 3856–3867. - PMC - PubMed
-
- Bath J, Turberfield AJ, 2007. DNA nanomachines. Nat. Nanotechnol. 2 (5), 275–284. - PubMed
-
- Campion A, Kambhampati P, 1998. Surface-enhanced Raman scattering. Chem. Soc. Rev. 27 (4), 241–250.
-
- Chen K, Leona M, Vo-Dinh T, 2007. Surface-enhanced Raman scattering for identification of organic pigments and dyes in works of art and cultural heritage material. Sens. Rev. 27 (2), 109–120.
-
- Cialla D, März A, Böhme R, Theil F, Weber K, Schmitt M, Popp J, 2012. Surface-enhanced Raman spectroscopy (SERS): progress and trends. Anal. Bioanal. Chem. 403 (1), 27–54. - PubMed
MeSH terms
Substances
Grants and funding
LinkOut - more resources
Full Text Sources
Medical
Miscellaneous
