. 2022 Nov 3;29(11):1594-1610.e8.
doi: 10.1016/j.stem.2022.09.010.

A single-cell transcriptome atlas of glial diversity in the human hippocampus across the postnatal lifespan

Affiliations

A single-cell transcriptome atlas of glial diversity in the human hippocampus across the postnatal lifespan

Yijing Su et al. Cell Stem Cell. .

Erratum in

Abstract

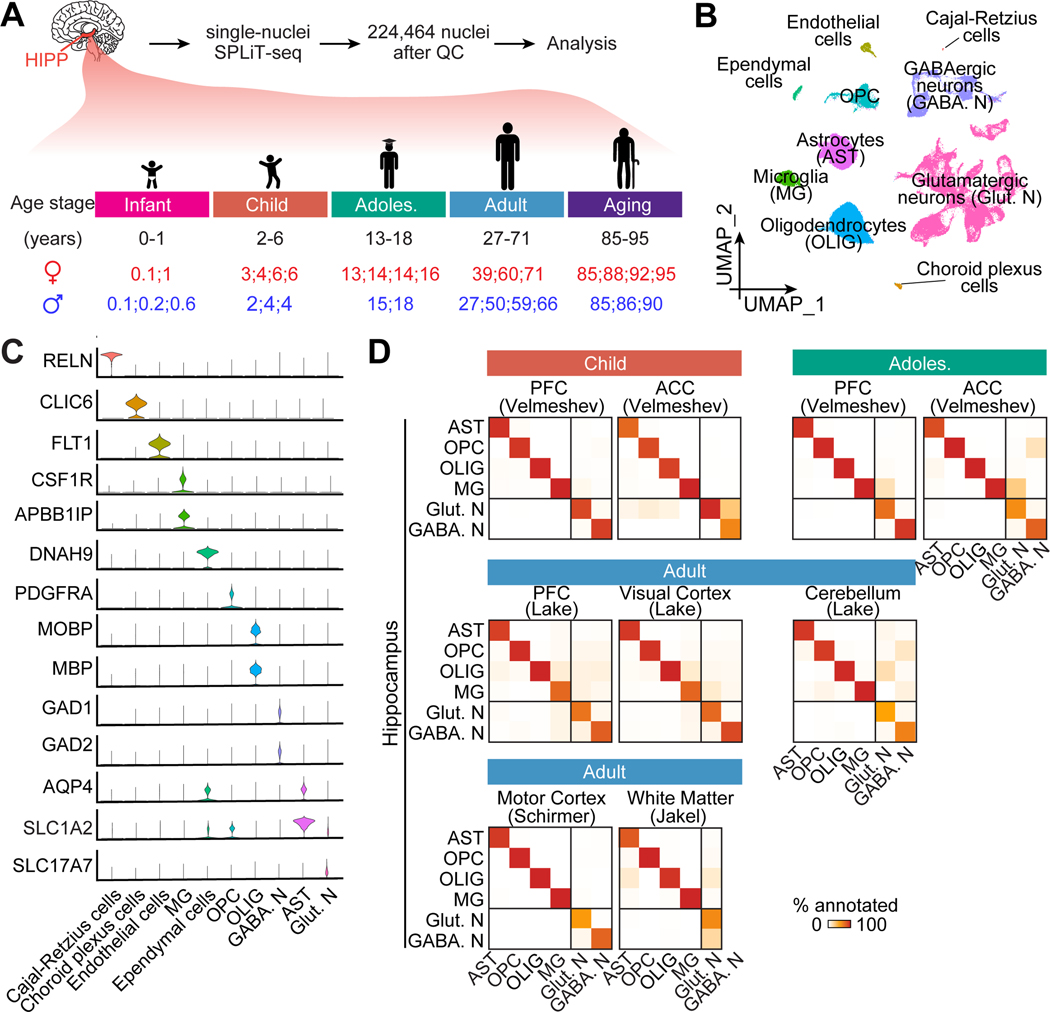
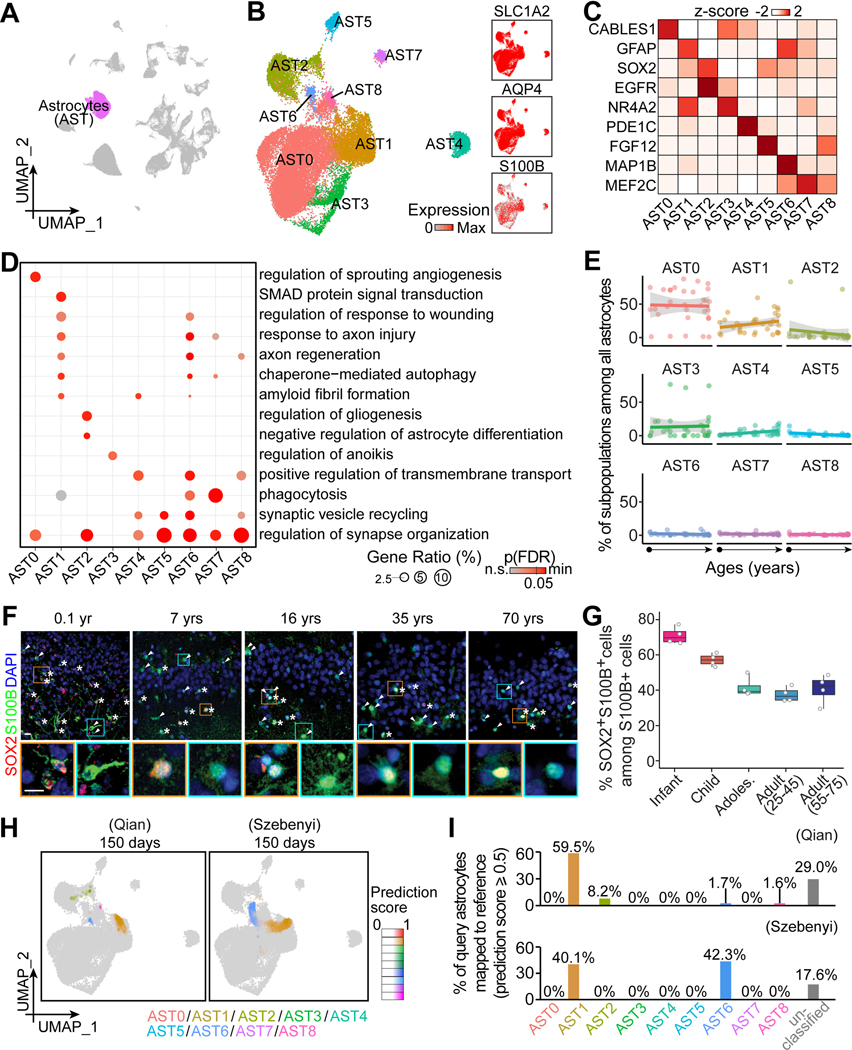
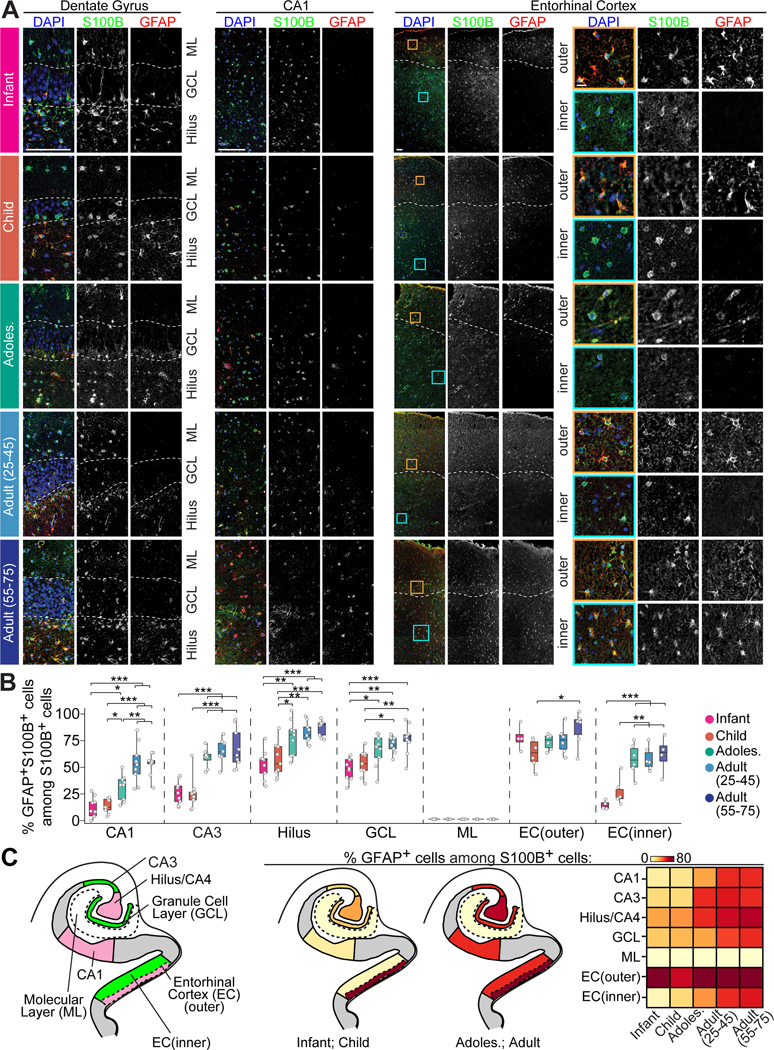
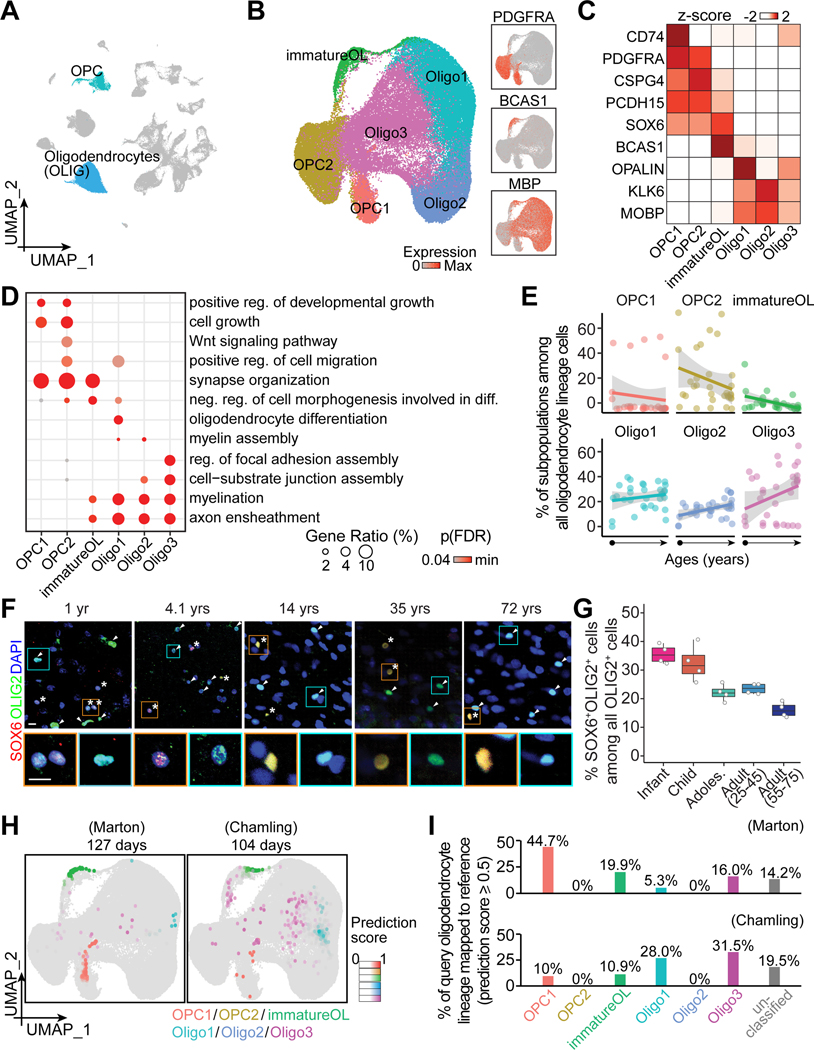
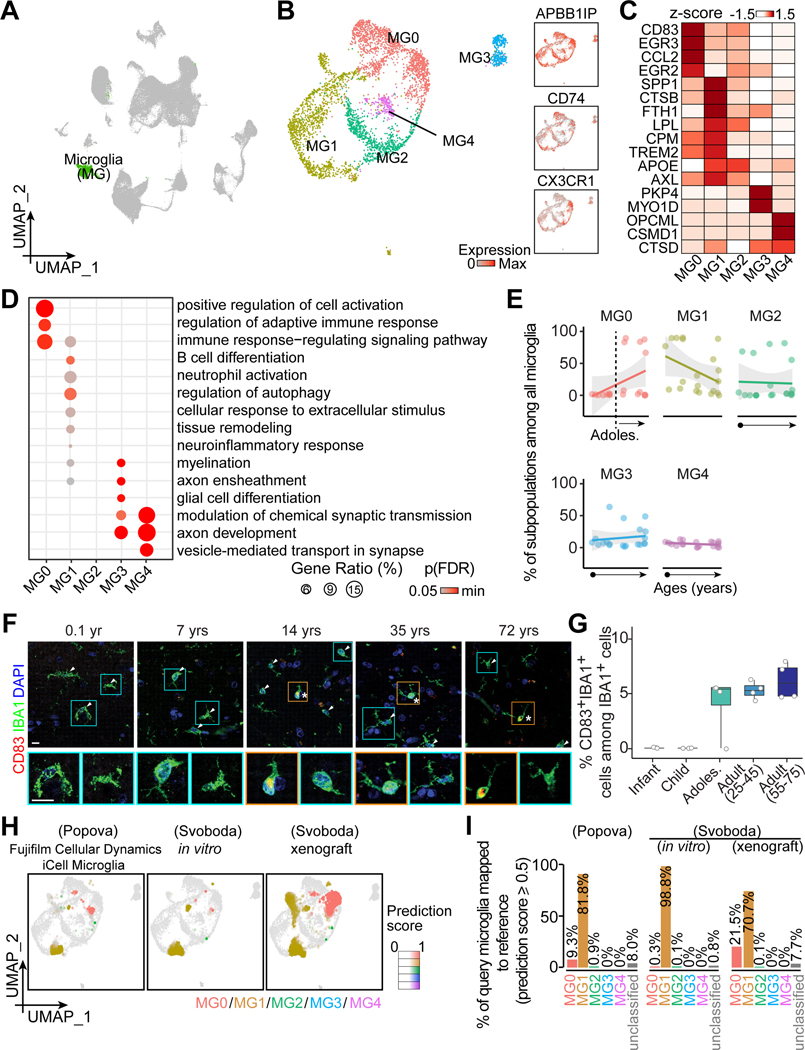
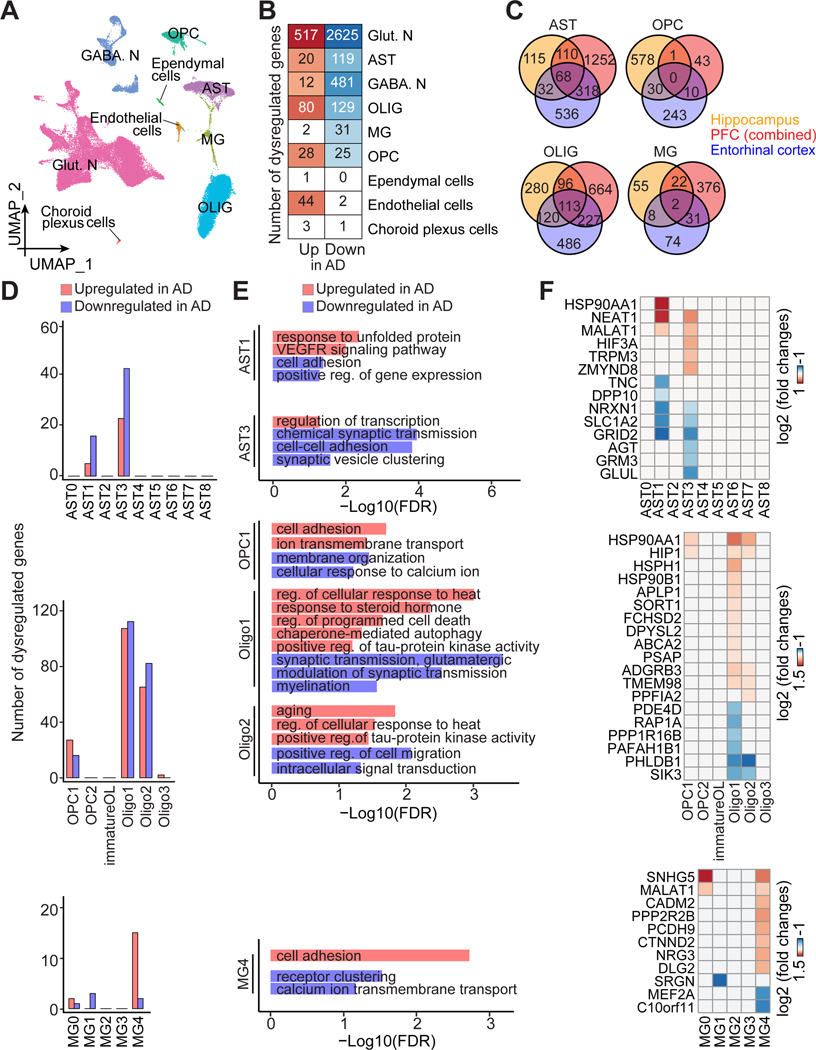
The molecular diversity of glia in the human hippocampus and their temporal dynamics over the lifespan remain largely unknown. Here, we performed single-nucleus RNA sequencing to generate a transcriptome atlas of the human hippocampus across the postnatal lifespan. Detailed analyses of astrocytes, oligodendrocyte lineages, and microglia identified subpopulations with distinct molecular signatures and revealed their association with specific physiological functions, age-dependent changes in abundance, and disease relevance. We further characterized spatiotemporal heterogeneity of GFAP-enriched astrocyte subpopulations in the hippocampal formation using immunohistology. Leveraging glial subpopulation classifications as a reference map, we revealed the diversity of glia differentiated from human pluripotent stem cells and identified dysregulated genes and pathological processes in specific glial subpopulations in Alzheimer's disease (AD). Together, our study significantly extends our understanding of human glial diversity, population dynamics across the postnatal lifespan, and dysregulation in AD and provides a reference atlas for stem-cell-based glial differentiation.

Keywords: Alzheimer’s disease; astrocytes; brain disorders; brain organoids; glial cell diversity; glial differentiation; human hippocampus; microglia; oligodendrocytes; single-nucleus transcriptomics.


Conflict of interest statement

Declaration of interests G.-l.M. is a member of the Advisory Board for Cell Stem Cell.

Figures

Figure 1.
Figure 1.. snRNA-seq profiling of the postnatal human hippocampus across ages
(A) A schematic of experimental design. HIPP: hippocampus; QC: quality control; Adoles.: adolescent. (B-C) Uniform Manifold Approximation and Projection (UMAP) of integrated data of cross-age analysis, colored by cell type (B). Cell clusters identified by known marker genes, depicted in violin plots in (C). OPC: oligodendrocyte precursor cells. (D) Heatmap showing transcriptomic correspondence of major cell types between published datasets of various brain regions and ours using a random forest classifier (Shekhar et al., 2016). PFC: prefrontal cortex; ACC: anterior cingulate cortex. See also Figure S1, Tables S1 and S2.
Figure 2.
Figure 2.. Transcriptomic diversity of human hippocampal astrocytes across the postnatal lifespan
(A and B) UMAP of integrated data highlighting astrocytes (A), which were sub-clustered and visualized in UMAP colored by subpopulation and generic marker expression (B). (C and D) Characteristics of astrocyte subpopulations. Heatmap (C) and bubble plot (D) showing representative enriched gene expression and Gene Ontology (GO) terms, respectively. p(FDR): p-value controlled for false-discovery rate. (E) Dot plots showing the proportion of each subpopulation among all astrocytes across ages. Dots for individual specimens are fitted with linear regression fitting (lines) with 95% confidence interval (grey shades). (F and G) Sample confocal images (F) and quantification (G) of SOX2+ cells among all S100B+ cells in the human hippocampus across ages. Asterisks and arrowheads indicate SOX2+S100B+ and SOX2-S100B+ cells, respectively. Insets boxed in orange and cyan colors show enlarged view of representative S100B+ cells that were SOX2+ and SOX2-, respectively. Scale bars, 10 μm (F). Dots represent value of quantification for individual subjects and box values represent median ± quantiles with whiskers for max and min (n = 4 subjects per stage) (G). (H and I) UMAP projection of “astroglia” in two query datasets of hPSC-derived long-term brain organoid cultures (Qian et al., 2020; Szebenyi et al., 2021) to our in vivo astrocyte reference map (H). Colors represent the assigned subpopulations and intensity represents the prediction score for each query cell. Bar plots in (I) show the proportions of query cells mapped to our in vivo glia reference. Cells with prediction scores lower than 0.5 to any in vivo subpopulation were categorized as “unclassified”. See also Figure S2, Tables S2 and S3.
Figure 3.
Figure 3.. Spatiotemporal patterns of GFAP+ astrocytes in the human hippocampal formation across the postnatal lifespan
(A and B) Sample confocal images (A) and quantification (B) of GFAP expression patterns among S100B+ cells in hippocampal subregions across ages. Dashed lines in representative images of the dentate gyrus indicate the upper and lower borders of the granule cell layer (A). For representative images of the entorhinal cortex, dashed lines separate the outer and inner layers, and insets boxed in orange and cyan colors show an enlarged view of representative expression patterns of S100B and GFAP in the outer and inner layers, respectively (A). Scale bars, 100 μm for low-magnification images and 10 μm for insets (A). Individual dots represent the value of quantification for different sections (B). Box plots represent mean ± quantiles with whiskers for max and min (n = 3 specimens per age group; * p < 0.01, ** p < 0.001, *** p < 0.0001; Pairwise ANOVA with post-hoc Tukey HSD tests) (B). (C) Schematic illustrations showing the human hippocampal formation colored by anatomical subregion (left panel) and summary of the proportion of GFAP+ cells among S100B+ cells in young and adult stages (middle two panels). Heatmap showing the percentage of GFAP+ cells among S100B+ cells in each subregion across ages (right panel). See also Figure S2.
Figure 4.
Figure 4.. Transcriptomic diversity of human hippocampal oligodendrocyte lineage cells across the postnatal lifespan
(A and B) UMAP of integrated data highlighting oligodendrocyte lineage cells (A), which were sub-clustered and visualized in UMAP colored by subpopulation and generic marker expression (B). (C-E) Characteristics of oligodendrocyte lineage subpopulations and their abundance across ages. Heatmap (C) and dot plots (D and E) similar as in Figures 2C-E. reg.: regulation. (F and G) Sample confocal images (F) and quantification (G) of SOX6+ among all OLIG2+ oligodendrocyte lineage cells in the human hippocampus across ages. Asterisks and arrowheads indicate SOX6+ and SOX6- cells among OLIG2+ cells, respectively. Insets boxed in orange and cyan colors show enlarged view of representative OLIG2+ cells that were SOX6+ and SOX6-, respectively. Scale bars, 10 μm (F). Box plot similar as in Figure 2G (n = 4 subjects per stage) (G). (H and I) Assessing hPSC-derived oligodendrocyte lineage cells in two query datasets (Chamling et al., 2021; Marton et al., 2019) with our in vivo reference map (H). UMAPs (H) and bar plots (I) similar as in Figures 2H and 2I. See also Figure S3, Tables S2 and S3.
Figure 5.
Figure 5.. Transcriptomic diversity of human hippocampal microglia across the postnatal lifespan
(A and B) UMAP of integrated data highlighting microglia (A), which were sub-clustered and visualized in UMAP colored by subpopulation and generic marker expression (B). (C-E) Characteristics of microglia subpopulations and their abundance across ages. Heatmap (C) and dot plots (D and E) similar as in Figures 2C-E. (F and G) Sample confocal images (F) and quantification (G) of CD83+ cells among all IBA1+ microglia in the human hippocampus across ages. Asterisks and arrowheads indicate CD83+ and CD83- cells among IBA1+ cells, respectively. Insets boxed in orange and cyan colors show enlarged view of representative IBA1+ cells that were CD83+ and CD83-, respectively. Scale bars, 10 μm (F). Box plot similar as in Figure 2G (n = 4 subjects per stage) (G). (H and I) Assessing hPSC-derived microglia in three query datasets (Popova et al., 2021; Svoboda et al., 2019) with our in vivo reference map (H). UMAPs (H) and bar plots (I) similar as in Figures 2H and 2I. See also Figure S4, Tables S2 and S3.
Figure 6.
Figure 6.. Subpopulation-specific transcriptomic dysregulation in glial cells in AD
(A) UMAP of snRNA-seq of AD human hippocampus and matched controls, colored by major cell type. (B) Heatmap showing the number of dysregulated genes in AD in each major cell type. (C) Venn diagram showing comparison of dysregulated genes in different glial cells in AD among brain regions, including hippocampus (current study), PFC (combining all dysregulated genes in (Lau et al., 2020; Mathys et al., 2019; Sadick et al., 2022; Zhou et al., 2020); See Figure S6F), and entorhinal cortex (Grubman et al., 2019). (D-F) Selective disruption in glia subpopulations in AD, showing the number of dysregulated genes (D), GO terms of biological processes (E), and exemplary gene expression (F). See also Figures S5 and S6, Tables S4, S5 and S6.

References

    1. Ayhan F, Kulkarni A, Berto S, Sivaprakasam K, Douglas C, Lega BC, and Konopka G. (2021). Resolving cellular and molecular diversity along the hippocampal anterior-to-posterior axis in humans. Neuron 109, 2091–2105 e2096. - PMC - PubMed
    1. Barres BA (2008). The mystery and magic of glia: a perspective on their roles in health and disease. Neuron 60, 430–440. - PubMed
    1. Ben Haim L, and Rowitch DH (2017). Functional diversity of astrocytes in neural circuit regulation. Nat Rev Neurosci 18, 31–41. - PubMed
    1. Bennett ML, and Bennett FC (2020). The influence of environment and origin on brain resident macrophages and implications for therapy. Nat Neurosci 23, 157–166. - PubMed
    1. Bergles DE, Roberts JD, Somogyi P, and Jahr CE (2000). Glutamatergic synapses on oligodendrocyte precursor cells in the hippocampus. Nature 405, 187–191. - PubMed

Publication types