. 2022 Nov 3;82(21):4018-4032.e9.
doi: 10.1016/j.molcel.2022.09.022.

LncRNA CCTT-mediated RNA-DNA and RNA-protein interactions facilitate the recruitment of CENP-C to centromeric DNA during kinetochore assembly

Affiliations

LncRNA CCTT-mediated RNA-DNA and RNA-protein interactions facilitate the recruitment of CENP-C to centromeric DNA during kinetochore assembly

Chong Zhang et al. Mol Cell. .

Abstract

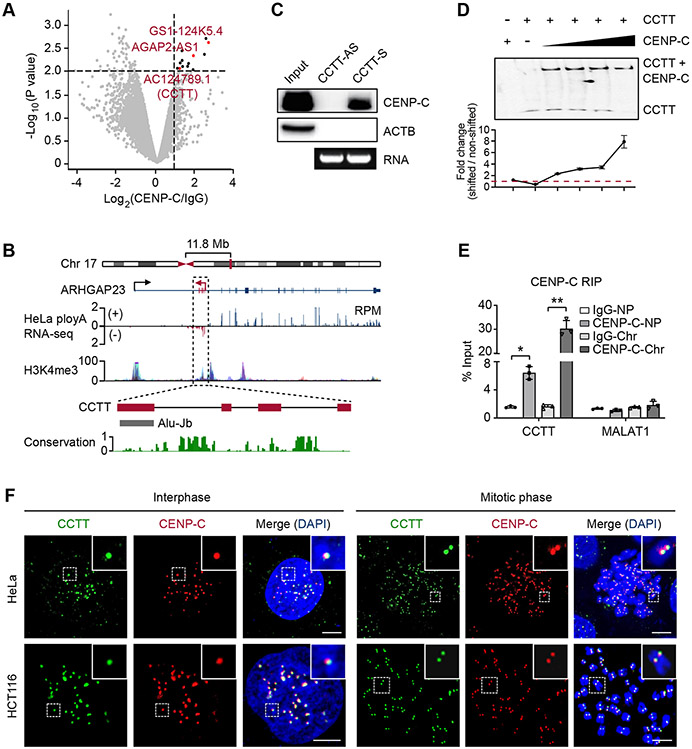
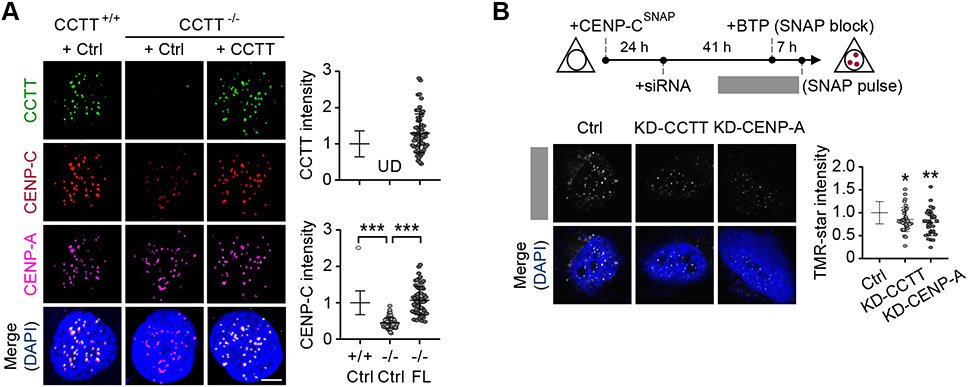
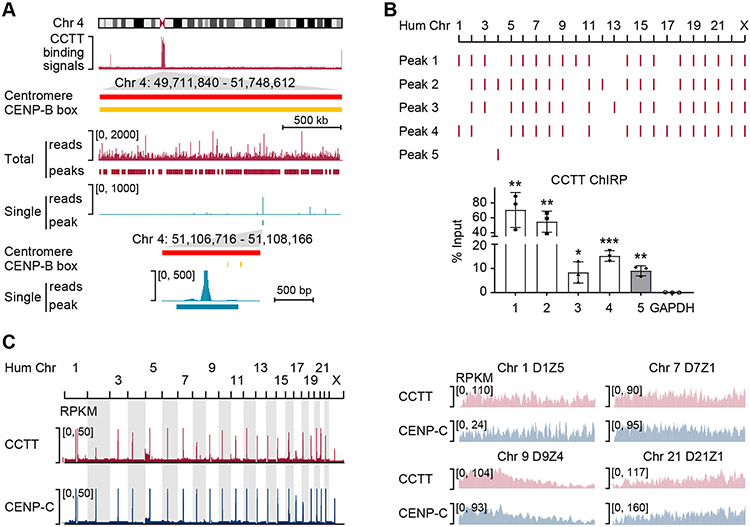
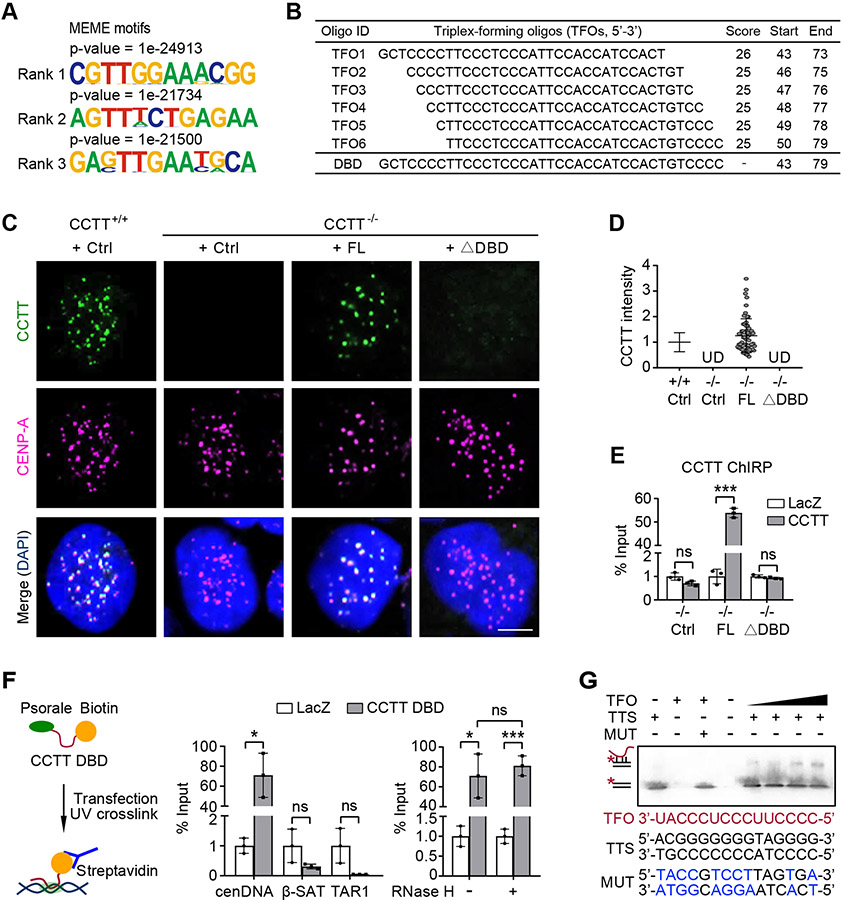
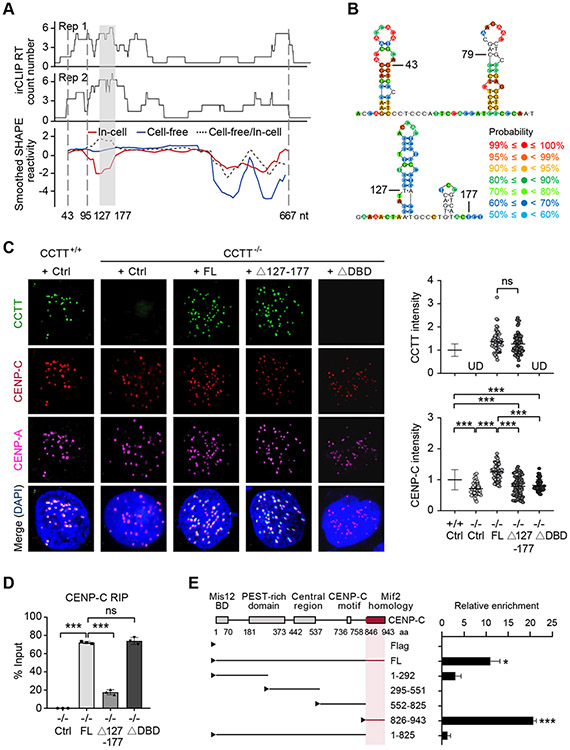
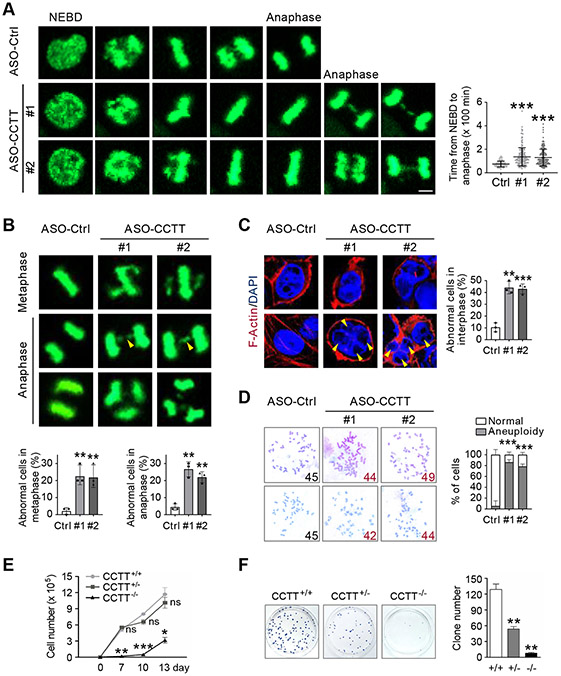
Kinetochore assembly on centromeres is central for chromosome segregation, and defects in this process cause mitotic errors and aneuploidy. Besides the well-established protein network, emerging evidence suggests the involvement of regulatory RNA in kinetochore assembly; however, it has remained elusive about the identity of such RNA, let alone its mechanism of action in this critical process. Here, we report CCTT, a previously uncharacterized long non-coding RNA (lncRNA) transcribed from the arm of human chromosome 17, which plays a vital role in kinetochore assembly. We show that CCTT highly localizes to all centromeres via the formation of RNA-DNA triplex and specifically interacts with CENP-C to help engage this blueprint protein in centromeres, and consequently, CCTT loss triggers extensive mitotic errors and aneuploidy. These findings uncover a non-centromere-derived lncRNA that recruits CENP-C to centromeres and shed critical lights on the function of centromeric DNA sequences as anchor points for kinetochore assembly.

Keywords: CENP-C recruitment; aneuploidy; centromere; lncRNA; mitotic defects.


Conflict of interest statement

Declaration of interests The authors declare no competing interests.

Figures

Figure 1.
Figure 1.. CENP-C Interacts with A New LncRNA CCTT
(A) Volcano plot of CENP-C-binding transcripts in HeLa cells. Transcripts with over 2-fold enrichment relative to IgG (p < 0.01) are highlighted as red (lncRNAs) or black dots (mRNAs). (B) Diagram of the CCTT locus. CCTT consists of 4 exons, with the last one harboring an Alu-Jb element. The coverage of ENCODE polyA RNA-seq and H3K4me3 ChIP-seq signals within the CCTT locus is prevalent in multiple human cell lines. The conservation score in 30 mammals is calculated by PhastCons. (C) RNA pulldown with biotinylated sense or antisense CCTT transcripts from HeLa whole cell lysate followed by western blot analysis of CENP-C. The agarose gel shows the corresponding RNA of sense or antisense CCTT. (D) CCTT interacted with CENP-C. Top: EMSA imaging of the biotinylated CCTT binding to increasing concentrations (2.5, 3.5, 4.5, 6 μM) of purified recombinant full-length CENP-C proteins. Gels were visualized and quantified by ChemiImager analysis. Bottom: quantification of the EMSA results. For each condition, the fraction of shifted RNA in each lane versus the amount of non-shifted RNA was plotted. Results are presented as the mean and SD of triplicate determinations. The dashed line indicates the shifted signal is same with the non-shifted signal. (E) CENP-C RIP followed by qPCR analysis of CCTT in nucleoplasm (NP) and chromatin (Chr) fractions of HeLa cells. MALAT1 was used as a negative control. *p < 0.05; **p < 0.01 (mean ± SD, n = 3 per group). (F) The co-localization of CCTT and CENP-C at centromeres. CCTT FISH (green) and CENP-C IF (red) analysis of HeLa (top) and HCT116 (bottom) cells in interphase and mitotic phases. Scale bars, 5 μm. See also Figures S1-S2.
Figure 2.
Figure 2.. CCTT Recruits CENP-C to Centromeres
(A) Re-expression of CCTT rescued CENP-C abundance at centromeres in CCTT−/− cells. Representative images of CCTT FISH (green), CENP-C (red) and CENP-A (pink) IF analyses of HeLa cells (left) and the quantifications of CCTT (top) or CENP-C (bottom) signals by IMARIS (right) are shown. n = 61 for CCTT+/+ cells, n = 72 for CCTT−/− cells, and n = 61 for CCTT−/− cells transfected with full-length (FL) CCTT. ***p < 0.001; UD, undetected (mean ± SD of three biological replicates). Scale bar, 5 μm. Each point represents an averaged fluorescence of all centromeres within a cell. (B) CCTT knockdown (KD-CCTT) decreased the deposition of new CENP-C at centromeres. Top: The strategy to determine the role of CCTT in CENP-C recruitment. Bottom: TMR-star staining (white) represents the newly deposited CENP-C during 7-hours chasing period. The TMR-star signals were quantified by IMARIS. n = 34 for Ctrl cells, n = 34 for KD-CCTT cells, n = 32 for KD-CENP-A cells. The cells collected from one batch experiment. *p < 0.05; **p < 0.01 (mean ± SD of three biological replicates). Scale bar, 5 μm. Each point represents an averaged TMR-star signals of all centromeres within a cell. See also Figures S2-S3.
Figure 3.
Figure 3.. CCTT Binds to CenDNA
(A) CCTT AMT-ChIRP-seq signals as well as SICER peaks across the centromere of Chr. 4. The middle two tracks separately show all mapped reads and deduced peaks (red) as well as single-mapped reads and deduced peaks (blue). The bottom panel further highlights the peak based on single-mapped reads in reference to annotated CENP-B boxes (yellow). (B) AMT-ChIRP-qPCR validation of representative peaks deduced from genome-wide CCTT binding profile by AMT-ChIRP-seq. Four representative peaks (1-4) were based on total reads which were detectable in multiple centromeres, and the last peak (5) was deduced based on single reads uniquely localized in Chr. 4. The AMT-ChIRP-qPCR results are shown at the bottom. GAPDH served as a negative control. *p < 0.05; **p < 0.01; ***p < 0.001 (mean ± SD, n = 3 per group). (C) Comparison between genome-wide binding profiles of CCTT and CENP-C. Mapped reads of CCTT AMT-ChIRP-seq and CENP-C ChIP-seq across all human chromosomes (left) and at different HORs within 4 representative centromeres (right) of HeLa cells. RPKM: reads per kb per million mapped reads. See also Figure S4.
Figure 4.
Figure 4.. CCTT Possibly Forms RNA-DNA Triplex with CenDNA
(A) Top three GA-rich motifs enriched in CCTT peaks using MEME. (B) Predicted 6 CCTT TFOs (triplex-forming oligos) using Triplexator, all of which correspond to a DBD (DNA binding domain) located between 43-79 nt in CCTT. (C) The exogenous FL CCTT but not the DBD-deleted (ΔDBD) mutant localized at centromeres of CCTT−/− HeLa cells, shown by CCTT FISH (green) and CENP-A IF (pink) analyses. Scale bar, 5 μm. (D) The quantification of the data in C by IMARIS (n = 65 for CCTT+/+ cells, n = 61 for CCTT−/− cells transfected with FL CCTT). UD, undetected (mean ± SD of three biological replicates). Each point represents an averaged CCTT signals of all centromeres within a cell. (E) Confirmation of CCTT localization at centromeres by ChIRP-qPCR in CCTT−/− HeLa cells complemented with Ctrl, FL CCTT, or ΔDBD CCTT. LacZ served as a negative control. ***p < 0.001; ns, no significant difference (mean ± SD, n = 3 per group). (F) The DBD was sufficient to mediate CCTT localization at centromeres. Left: A diagram showing the use of psoralen and biotin-labeled CCTT DBD to capture cenDNA in HeLa cells. Middle: Quantified results of CCTT DBD captured cenDNA in comparison with β-satellite (β-SAT) and telomere-associated repeat sequences (TAR1). Right: CCTT DBD that captures cenDNA is resistant to RNase H. LacZ served as a negative control. *p < 0.05; ***p < 0.001; ns, no significant difference (mean ± SD, n = 3 per group). (G) Triplex formation between CCTT and cenDNA. EMSA imaging of 10 μM biotinylated dsDNA oligos (TTS) or mutant ones (MUT) binding to increasing concentrations (0.25, 0.5, 2, 4 μM) of CCTT TFO. The mutant nucleotides are shown in blue. See also Figure S4.
Figure 5.
Figure 5.. CCTT Uses Distinct Domains to Interact with CENP-C and CenDNA
(A) The CENP-C binding domain of CCTT deduced by irCLIP (top two tracks from two biological replicates) and SHAPE-MaP (bottom track) in cell-free (blue line) or in-cell state (red line). The ratio of cell-free smoothened SHAPE reactivities relative to in-cell reactivities is indicated by the dotted line. The gray-shaded area (127-177 nt) indicates the region with the highest ratio of cell-free versus in-cell SHAPE reactivities, which is co-incident with the highest CENP-C binding detected by irCLIP. The sequence between the two vertical dotted lines (43-95 nt) corresponds to the region with most single-strandness predicted by SHAPE-MaP. (B) The deduced secondary structures of the predicted single-strand region (top) and CENP-C binding domain (bottom) of CCTT. Color-coded probability scores at individual nucleotide positions are based on the SHAPE-MaP data and predicate the confidence probability of secondary structure. The predicated secondary structure contains paired and unpaired base, and the higher scores imply the more reliable structure in this position. (C) Exogenous FL CCTT, but not the mutants depleted of the CENP-C binding domain (Δ127-177) or the DNA binding domain (ΔDBD), restored the abundance of CENP-C at centromeres in CCTT−/− HeLa cells, shown by CCTT FISH (green), CENP-C (red) and CENP-A (pink) IF analyses (left). The quantifications of CCTT (top) or CENP-C (bottom) signals by IMARIS (n = 77 for CCTT+/+ cells, n = 46 for CCTT−/− cells, n = 58 for CCTT−/− cells transfected with FL CCTT, n = 65 for CCTT−/− cells transfected with Δ127-177 CCTT, n = 51 for CCTT−/− cells transfected with ΔDBD) are shown (right). ***p < 0.001; ns, no significant difference; UD, undetected (mean ± SD of three biological replicates). Scale bar, 5 μm. Each point represents an averaged CCTT or CENP-C signals of all centromeres within a cell. (D) Quantified results of captured CCTT by CENP-C RIP in CCTT−/− HeLa cells complemented with Ctrl, FL CCTT, Δ127-177 CCTT, or ΔDBD CCTT. ***p < 0.001; ns, no significant difference (mean ± SD, n = 3 per group). (E) Mapping the specific CCTT binding domain in CENP-C by CENP-C RIP-qRT-PCR. Left: Annotated CENP-C domains in literature and various Flag-tagged CENP-C truncated mutants tested by the CCTT capture assay. The deduced CCTT binding domain in CENP-C is highlighted in red. Right: Quantification of the RIP-qRT-PCR data. *p < 0.05; ***p < 0.001 (mean ± SD, n = 3 per group). See also Figure S5.
Figure 6.
Figure 6.. CCTT Is Required for Accurate Mitosis
(A) CCTT knockdown led to prolonged mitosis of HeLa cells. Left: representative time-lapse microscopic images of ASO-Ctrl and ASO-CCTT HeLa cells expressing histone H2B-GFP during mitosis. Right: Quantification of CCTT expression by qRT-PCR. **p < 0.01 (mean ± SD, n = 3 per group). Left bottom: Quantification of time from nuclear envelope breakdown (NEBD) to anaphase. n = 90 for ASO-Ctrl, n = 180 for ASO-CCTT #1, n = 173 for ASO-CCTT #2. ***p < 0.001 (mean ± SD). Each point represents a cell. Scale bar, 5 μm. (B) CCTT knockdown caused mitotic errors in metaphase and anaphase HeLa cells. Top: Representative images of mitotic errors by time-lapse assay, including alignment defects (white arrowheads), chromosome bridges (yellow arrowheads), and multipolar spindles. Bottom: Quantification of the percentage of abnormal cells in metaphase (top) and anaphase (bottom). n = 90 for ASO-Ctrl, n = 180 for ASO-CCTT #1, n = 173 for ASO-CCTT #2. **p < 0.01 (mean ± SD of three biological replicates). Scale bar, 5 μm. (C) CCTT knockdown induced abnormal nuclei in interphase HeLa cells. Left: Binuclei (white arrowheads) and micronuclei (yellow arrowheads) were detected. Cells were stained with F-Actin (red) and DAPI (blue). Right: Quantification of the percentage of abnormal cells. n = 94 for ASO-Ctrl, n = 69 for ASO-CCTT #1, n = 65 for ASO-CCTT #2. **p < 0.01; ***p < 0.001 (mean ± SD of three biological replicates). Scale bars, 5 μm. (D) CCTT knockdown caused aneuploidy in HCT116 cells. Left: Representative images of chromosomes and abnormal numbers are highlighted in red. Right: Quantification of the percentage of aneuploid cells. n = 28 for ASO-Ctrl, n = 36 for ASO-CCTT #1, n = 35 for ASO-CCTT #2. **p < 0.01; ***p < 0.001 (mean ± SD of three biological replicates). (E) Cell growth curve of CCTT+/+, CCTT+/−, and CCTT−/− HeLa cells. Cell numbers were counted at 0, 7, 10, 13 days after CCTT inducible knockout. *p < 0.05; **p < 0.01; ***p < 0.001; ns, no significant difference (mean ± SD, n = 3 per group). (F) CCTT+/+, CCTT+/−, and CCTT−/− HeLa cells were cultured for colony formation. After 3 weeks, clones were visualized by crystal violet and the numbers were quantified. **p < 0.01 (mean ± SD, n = 3 per group). See also Figure S6.

Similar articles

Cited by

References

    1. Bailey TL, Boden M, Buske FA, Frith M, Grant CE, Clementi L, Ren JY, Li WW, and Noble WS (2009). MEME SUITE: tools for motif discovery and searching. Nucleic Acids Res. 37(Web Server issue), W202–208. 10.1093/nar/gkp335. - DOI - PMC - PubMed
    1. Beal PA, and Dervan PB. (1991). Second structural motif for recognition of DNA by oligonucleotide-directed triple-helix formation. Science 251, 1360–1363. 10.1126/science.2003222. - DOI - PubMed
    1. Black BE, and Cleveland DW (2011). Epigenetic centromere propagation and the nature of CENP-a nucleosomes. Cell 144, 471–479. 10.1016/j.cell.2011.02.002. - DOI - PMC - PubMed
    1. Blower MD (2016). Centromeric Transcription Regulates Aurora-B Localization and Activation. Cell Rep. 15, 1624–1633. 10.1016/j.celrep.2016.04.054. - DOI - PMC - PubMed
    1. Bodor DL, Rodríguez MG, Moreno N, and Jansen LE (2012). Analysis of protein turnover by quantitative SNAP-based pulse-chase imaging. Curr. Protoc. Cell Biol Chapter 8, Unit8.8. 10.1002/0471143030.cb0808s55. - DOI - PubMed

Publication types