. 2022 Nov 14;40(11):1324-1340.e8.
doi: 10.1016/j.ccell.2022.10.012. Epub 2022 Nov 3.

Tumor-intrinsic SIRPA promotes sensitivity to checkpoint inhibition immunotherapy in melanoma

Affiliations

Tumor-intrinsic SIRPA promotes sensitivity to checkpoint inhibition immunotherapy in melanoma

Zhicheng Zhou et al. Cancer Cell. .

Abstract

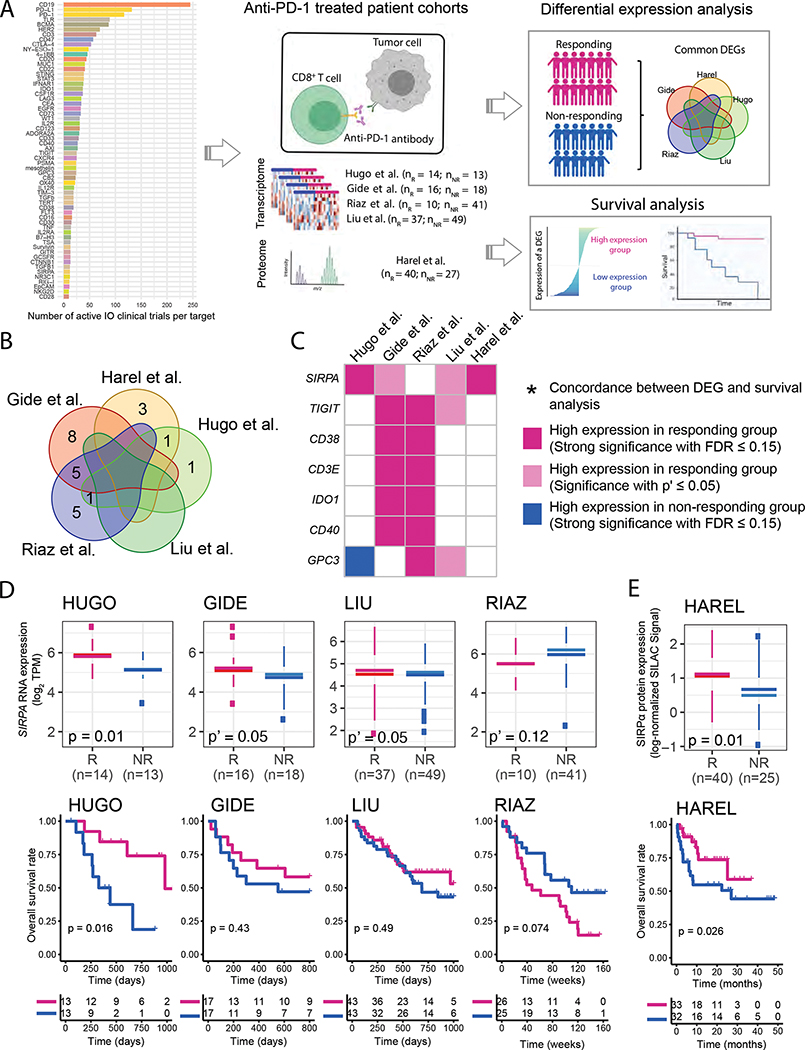
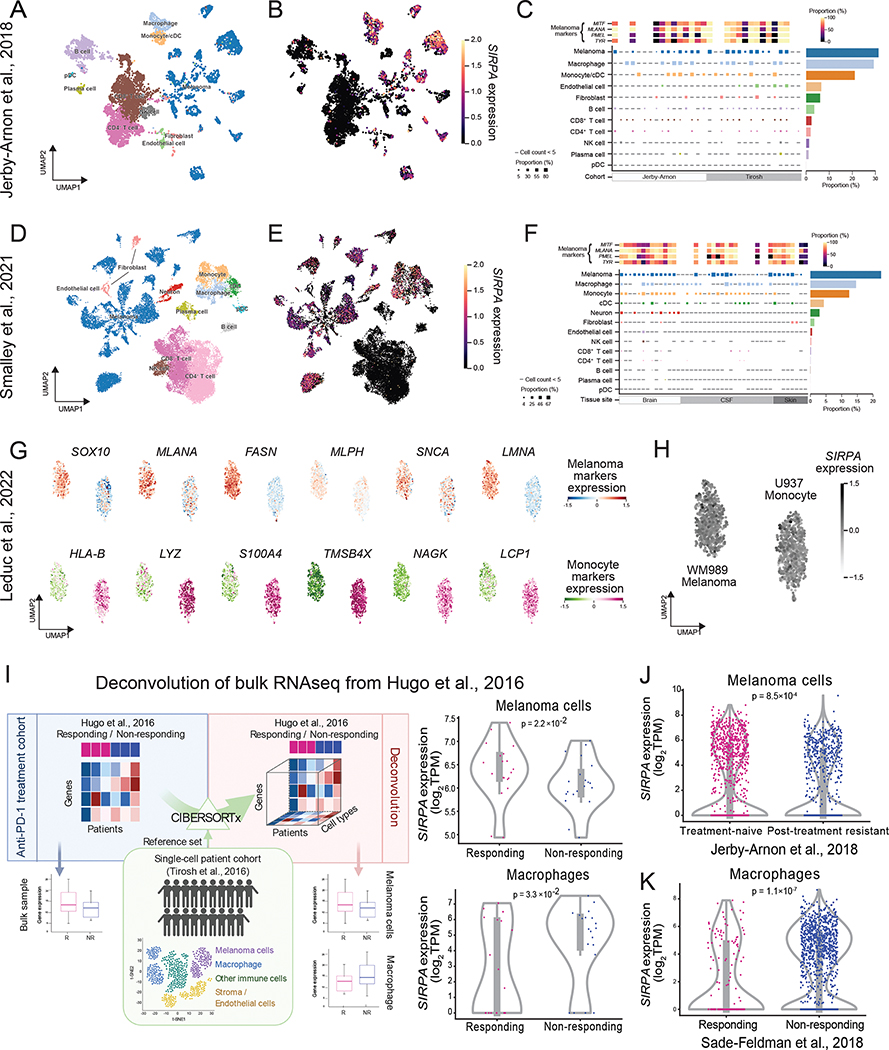
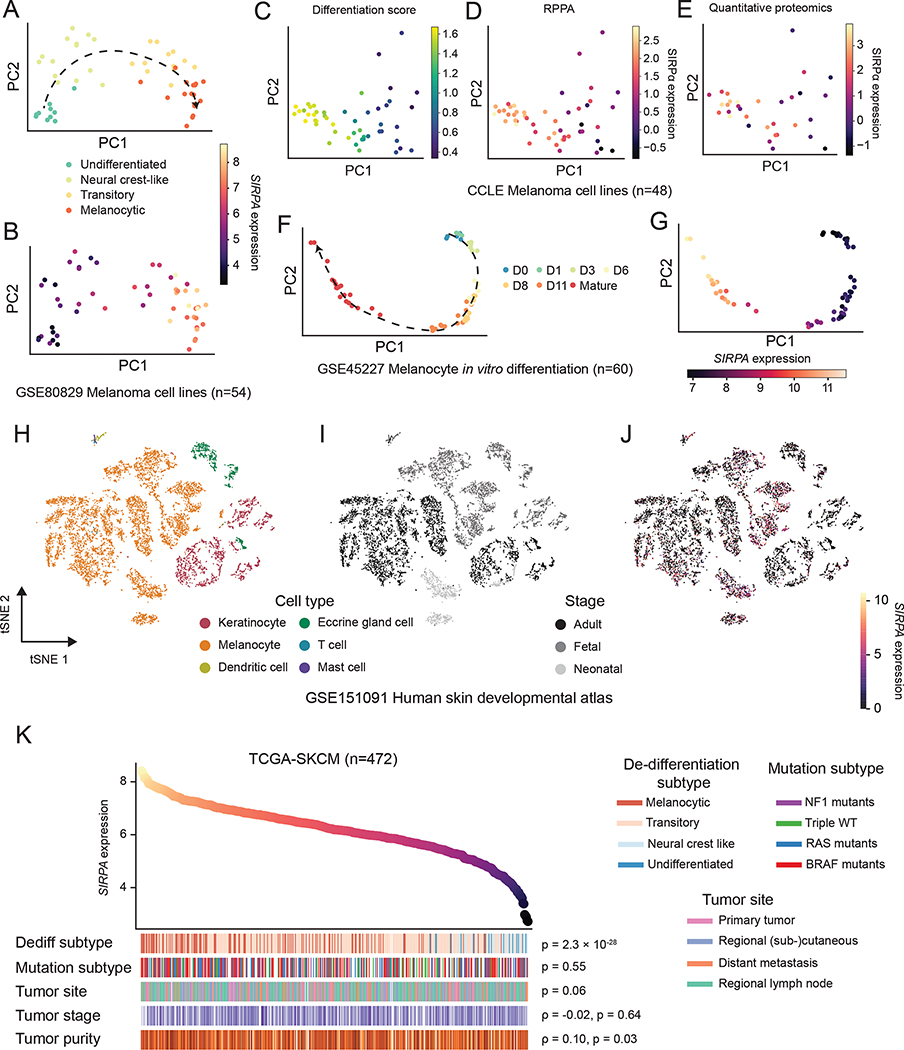
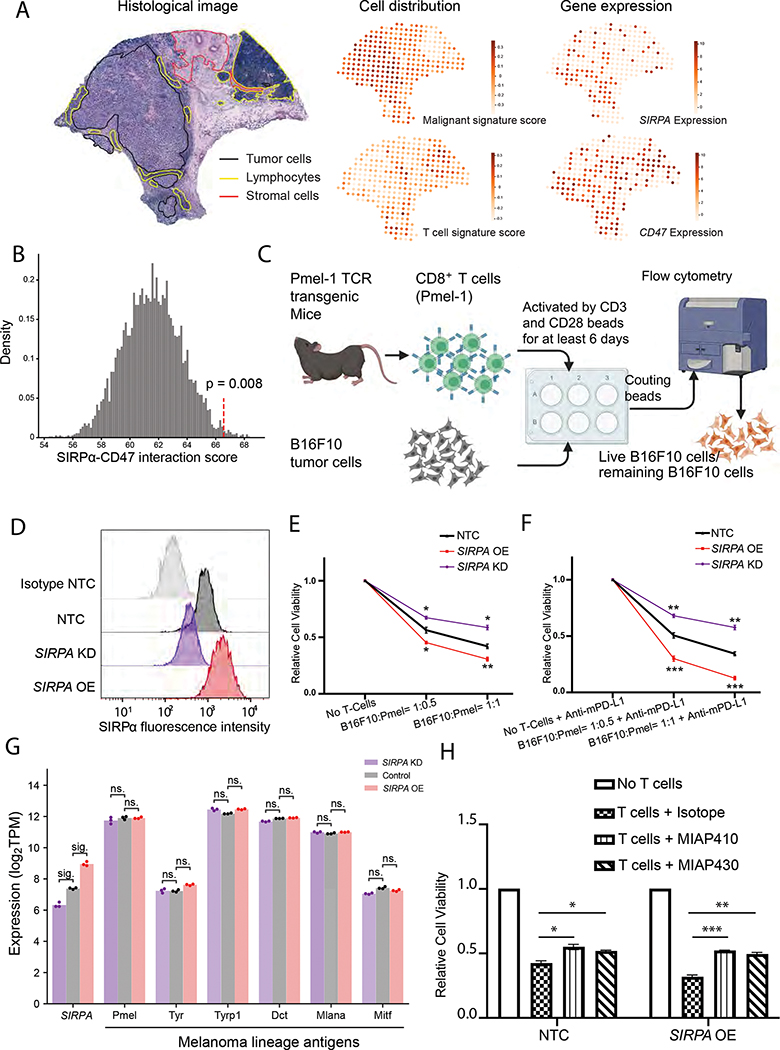
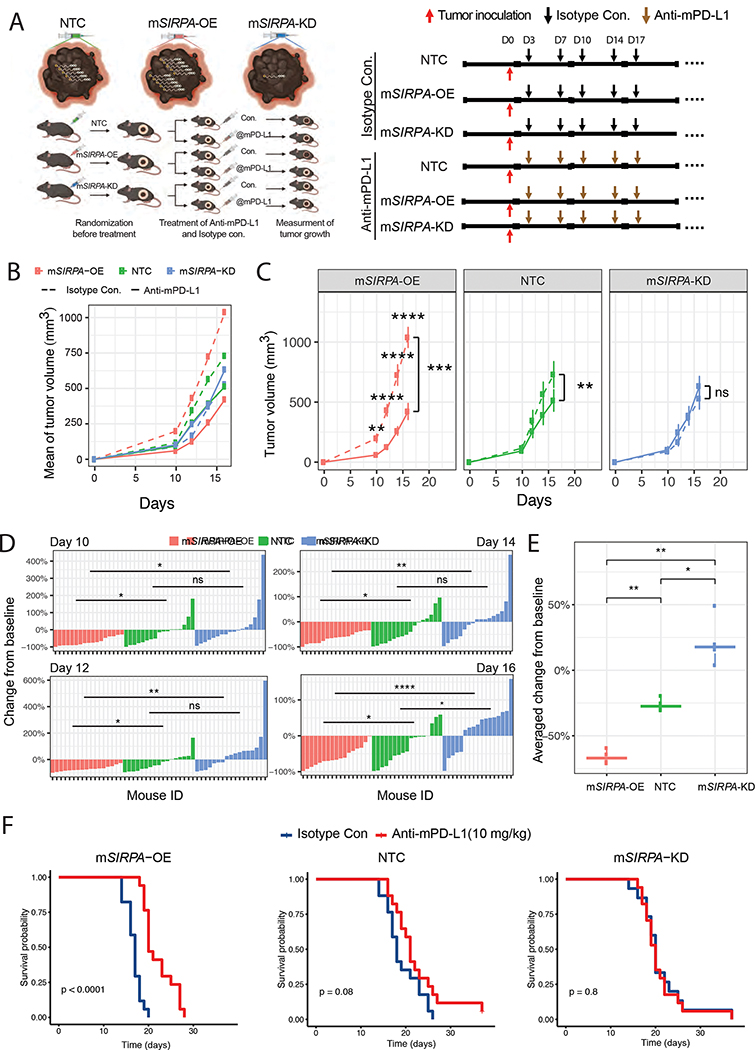
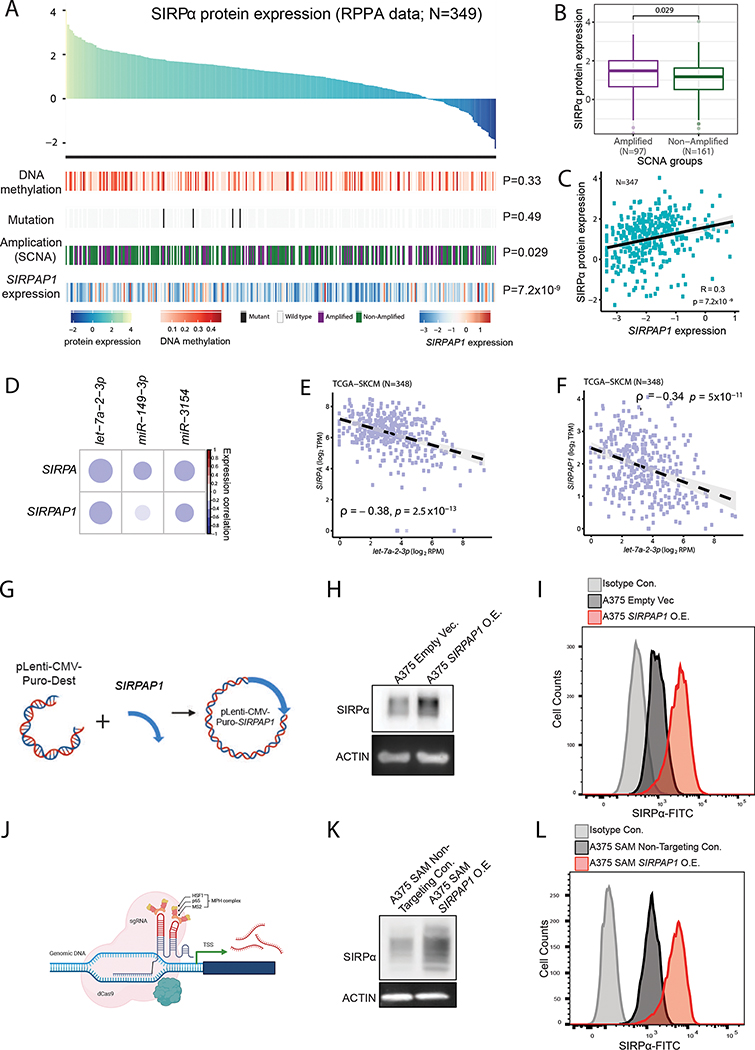
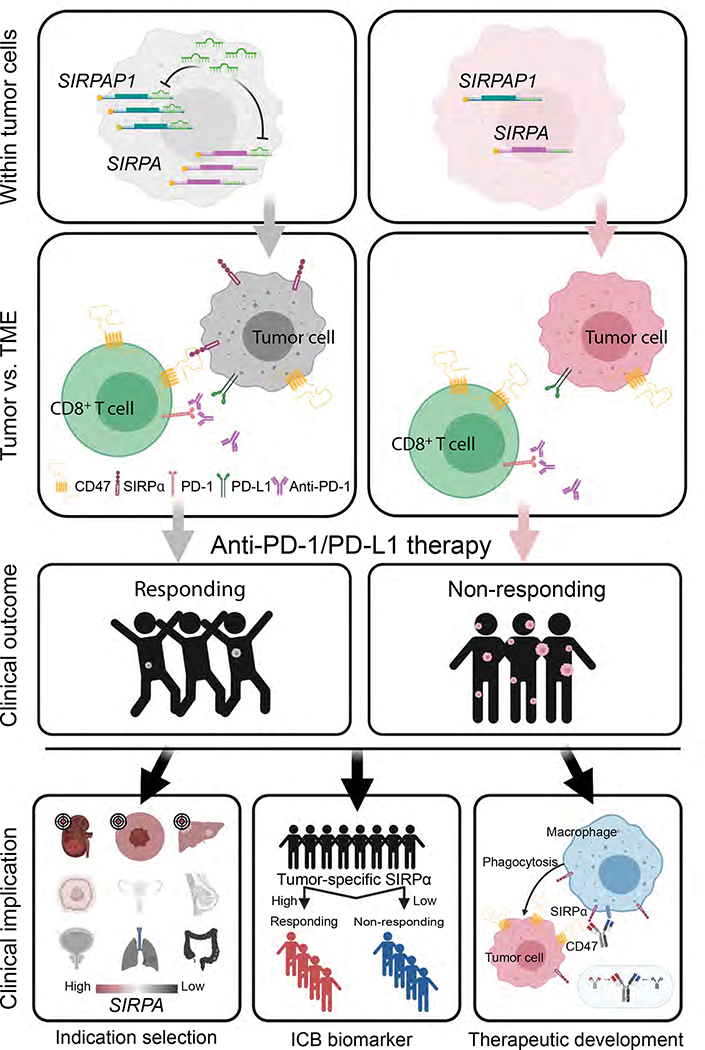
Checkpoint inhibition immunotherapy has revolutionized cancer treatment, but many patients show resistance. Here we perform integrative transcriptomic and proteomic analyses on emerging immuno-oncology targets across multiple clinical cohorts of melanoma under anti-PD-1 treatment, on both bulk and single-cell levels. We reveal a surprising role of tumor-intrinsic SIRPA in enhancing antitumor immunity, in contrast to its well-established role as a major inhibitory immune modulator in macrophages. The loss of SIRPA expression is a marker of melanoma dedifferentiation, a key phenotype linked to immunotherapy efficacy. Inhibition of SIRPA in melanoma cells abrogates tumor killing by activated CD8+ T cells in a co-culture system. Mice bearing SIRPA-deficient melanoma tumors show no response to anti-PD-L1 treatment, whereas melanoma-specific SIRPA overexpression significantly enhances immunotherapy response. Mechanistically, SIRPA is regulated by its pseudogene, SIRPAP1. Our results suggest a complicated role of SIRPA in the tumor ecosystem, highlighting cell-type-dependent antagonistic effects of the same target on immunotherapy.

Keywords: anti-PD-1 treatment; biomarker; immunotherapy; single-cell analysis; therapeutic target.


Conflict of interest statement

Declaration of interests H.L. is a shareholder and scientific adviser of Precision Scientific Ltd.

Figures

Figure 1.
Figure 1.. An integrative IO-target analysis across anti-PD-1 patient cohorts
(A) The overall procedure of our integrative IO-target analysis. The bar plot indicates the number of active clinical trials per target. (B) Venn diagram showing the overlap of differentially expressed (DE) genes identified in five anti-PD-1-treated melanoma patient cohorts. (C) A summarized plot showing seven DE genes identified in at least two cohorts; red and dark-blue, strong significance with FDR ≤ 0.15; pink, regular significance with P’ ≤ 0.05; * indicates their concordance with the results of survival analysis. (D, E) Boxplots and Kaplan-Meier (KM) plots showing the associations between the mRNA- (D) and protein-level (E) expressions of the top candidate gene, SIRPA, and anti-PD-1 responses or patient survival times in the anti-PD-1 response cohorts. For box plots, the middle line in the box is the mean, the bottom and top of the box are the first and third quartiles, and the whiskers extend to the 1.5× interquartile range of the lower and the upper quartiles, respectively. To assess the differences in SIRPA mRNA expression between anti-PD-1 responding and non-responding groups robustly, three differential expression tests, DESeq2, edgeR, and limma, were used. All three tests yielded strong significant results (P ≤ 0.05 with FDR ≤ 0.15), and the most significant two-sided P value from the three is shown on the boxplot. Otherwise, one-sided P’ values are shown to indicate marginal significance. To assess the difference in SIRPα protein expression, the Mann-Whitney U test was used, and the P-value from a permutated random distribution is shown on the boxplot. For Kaplan-Meier plots, patients were split into two equal-size groups with the median as the cutoff. Log-rank tests were used to assess the difference in patient survival times between the two groups. See also Figure S1 and Table S1.
Figure 2.
Figure 2.. SIRPA expression in tumor cells and macrophages in melanoma patient samples
(A, B) UMAP plot visualizing cell type annotations (A) and SIRPA expression (B) in single cells of a melanoma patient cohort from Jerby-Arnon et al. (C) Top panel, a heatmap showing the proportion of cells positive for four melanoma gene markers in all melanoma cells of each patient. Middle panel, a heatmap showing the proportion of SIRPA+ cells in different cell types of each patient. Right panel, a bar plot showing the proportion of SIRPA+ cells in different cell types where cells from all patients are combined. (D-F) Same as (A-C) but for another melanoma patient cohort from Smalley et al. (G) UMAP plot visualizing protein expression levels of six melanoma markers (top panel) and six monocyte markers (bottom panel) in single cells of a melanoma cell line (top panel) and a monocyte cell line (bottom panel), respectively. (H) UMAP plot visualizing SIRPα protein expression level in the two cell lines as mentioned in (G). (B, E, G, H) The color key indicates normalized mRNA expression for a gene of interest. (C, F) The color key indicates the proportion of positive cells. (I) Left panel, the workflow of deconvoluting bulk gene expression profiles into cell type-specific gene expression profiles. Right panel, violin plots showing differential SIRPA expression by deconvolution between responding and non-responding groups in melanoma cells and macrophages, respectively. R, responding to anti-PD-1 therapy; NR, non-responding. (J, K) Violin plots showing differential SIRPA expression by scRNA-seq between anti-PD-1 treatment-naïve and post-treatment resistant groups in melanoma cells (J) or between responding and non-responding groups in macrophages (K). (I, J, K) Each violin plot shows the data distribution using a kernel density estimation. The width of the violin plot represents a probability that the data points will take on the given value, and the top and bottom lines indicate the maximal and minimal data values. The bottom and top of the inner box are the first and third quartiles, and the whiskers extend to the 1.5× interquartile range of the lower and the upper quartiles, respectively. See also Figure S2.
Figure 3.
Figure 3.. SIRPA expression dynamics in melanocyte maturation and melanoma de-differentiation
(A, B) PCA projection of human melanoma cell lines from Tsoi et al., based on gene expression profiles and colored by de-differentiation stages (A) or normalized SIRPA expression level (B). (C-E) PCA projection of human melanoma cell lines from CCLE, based on gene expression profiles and colored by differentiation score (C), SIRPα protein by RPPA (D), or SIRPα protein expression by quantitative proteomics (E). (F, G) PCA projection of in vitro differentiating human melanocytes from Mica et al., based on gene expression profiles and colored by differentiation time (F) or normalized SIRPA expression level (G). (H-J) Two-dimensional t-SNE projection of human skin single cells from Belote et al., colored by cell type (H), developmental stage (I), and normalized SIRPA expression level (J). The color key indicates the normalized SIRPA expression (A, B, F, G, J), differentiation score (C), SIRPα protein expression by RPPA (D), or SIRPα protein expression by quantitative proteomics (E). (K) Top panel, a scatterplot of TCGA melanoma (TCGA-SKCM) samples ranked by SIRPA expression level. Bottom panel, heatmap showing biological and clinical features of ordered TCGA-SKCM samples. The Kruskal-Wallis test was used to compute P values for the association of SIRPA expression with de-differentiation stages, mutational subtypes, and tumor sites. The Spearman’s rank correlation was used to evaluate the association of SIRPA expression with tumor stage and tumor purity. See also Figure S3.
Figure 4.
Figure 4.. Effect of SIRPα inhibition on T-cell-mediated antitumor response in melanoma cells
(A) Hematoxylin and eosin (H&E) stained tissue image of a melanoma biopsy (left panel, adopted from Fig. 3A in Thrane et al.) with the slide-wide distribution of cell type signature scores (middle panel), and the expression patterns of SIRPA and CD47 (right panel). The color key indicates signature score or normalized gene expression. (B) Histogram showing the distribution of receptor-ligand interaction scores for SIRPA in melanoma cells and CD47 in CD8+ T cells computed from the random shuffling of cell type labels. The red dotted line denotes the real score corresponding to the co-expression pattern of SIRPA in melanoma cells and CD47 in CD8+ T cells of the Tirosh cohort. (C) A co-culture system quantifying tumor cell viability upon perturbations. (D) Smoothed histograms showing cell surface SIRPα expression detected by flow cytometry after SIRPA perturbation, knockdown (KD), or overexpression (OE). The knockdown cell lines were constructed by multiple shRNAs. SIRPA KD-E, showing the most robust knockdown efficiency, was selected for downstream experiments. Isotype and B16F10 NTC are the negative and positive controls, respectively. (E, F) Line charts showing relative survival rates of tumor cells at 24 h in co-cultures of different ratios of B16F10 and CD8+ T cells (Pmel-1) without (E) and with (F) the addition of mouse anti-PD-L1 antibody (mPD-L1). (G) Bar plot showing gene expression levels of SIRPA along with six melanoma differentiation antigens in B16F10 cells with SIRPA KD, OE, or control. sig., log2 fold change > 1 and adjusted P < 0.05 by DESeq2; ns., log2 fold change < 1 or adjusted P > 0.05 by DESeq2. (H) Bar plots showing relative survival rates of tumor cells at 24h in co-cultures with CD8+ T cells (Pmel-1) pre-treated with MIAP410 or MIAP430 antibodies to block CD47-SIRPα interaction. (E, F, H) The results are based on three independent mouse experiments, each with three replicates, and the error bars indicate mean ± SEM. P values are based on Student’s t-test; *, P < 0.05; **, P < 0.01; ***, P < 0.001. See also Figure S4.
Figure 5.
Figure 5.. Effects of SIRPα expression levels on anti-PD-L1 treatment response in mice
(A) A graphic description of the mouse experiment design. Left panel, the workflow; right panel, the schedule of tumor inoculation and treatments. Three tumor cell lines, NTC, mSIRPA-OE, and mSIRPA-KD were inoculated, followed by two treatments, Isotype control, and mPD-L1. In total, six mouse groups were tested and compared. (B, C) Curves showing the tumor growth in 16 days for each mouse group. Averaged tumor volumes of the six mouse groups are shown in one plot for a universal comparison (B). The effects of the mPD-L1 antibody on tumor volumes are shown in the three tumor cell lines (C). Student’s t-tests (two-sided) were used to compare the mouse groups of different treatments at each time point. Paired Student’s t-tests (two-sided) were used to compare the two curves within each tumor cell line based on the averaged tumor volumes. The error bars indicate mean ± SEM. (D) Waterfall plots visualizing the tumor volume changes from the baseline (Isotype control) after mPD-L1 antibody treatment for every single mouse of the three tumor cell lines on days 10, 12, 14, and 16. Student’s t-tests (two-sided) were used to compare the mouse groups of different cell lines. (E) Boxplots showing averaged changes from baseline of the four time points for each tumor cell line. The middle line in the box is the median, the bottom and top of the box are the first and third quartiles, and the whiskers extend to the 1.5× interquartile range of the lower and the upper quartiles, respectively. The three groups were compared by using paired Student’s t-tests (two-sided). (F) Kaplan-Meier plots showing the mice survival rate upon anti-PD-L1 treatment for each tumor cell line. The difference between curves was tested by log-rank tests. (C-E) *, P < 0.05; **, P < 0.01; ***, P < 0.001; ****, P < 0.0001. See also Figure S5.
Figure 6.
Figure 6.. Regulation of SIRPα protein expression in melanoma patients
(A-C) Summarized plot showing possible regulations of SIRPα protein expression across TCGA-SKCM patients assayed by RPPA in this study, including SIRPA DNA methylation, somatic mutation, somatic copy-number alteration (SCNA), and SIRPAP1 expression. (A) Top panel, barplot of TCGA-SKCM samples ranked by SIRPα protein expression. Color keys indicate normalized levels for SIRPα protein expression, SIRPA DNA methylation, and SIPRAP1 expression, respectively. Bottom panel, heatmap showing different regulatory features. (B) Boxplots showing the association between gene amplification and SIRPα protein expression. Patient samples with somatic copy number with log2 transformation > 1 are denoted as amplified, and the others as non-amplified. The middle line in the box is the median, the bottom and top of the box are the first and third quartiles, and the whiskers extend to the 1.5× interquartile range of the lower and the upper quartiles, respectively. (C) Scatterplot showing the correlation between SIRPα and SIRPAP1 RNA expression. The correlation coefficient and P-value are based on Spearman’s rank correlation. (D) Correlation plot showing the miRNAs which are negatively correlated with SIRPA expression in TCGA-SKCM samples. The color bar represents Spearman’s rank correlation coefficient. (E, F) Scatterplots showing the correlations between let-7a-2–3p and SIRPA (E) or SIRPAP1 (F) expression. (G) Cartoon summary of SIRPAP1 overexpression by lentivirus transduction. (H, I) Western blot (H) and Flow cytometry (I) of SIRPα protein expression upon vector-based SIRPAP1 overexpression. (J) Cartoon summary of SIRPAP1 overexpression by CRISPR/Cas9 SAM system. (K, L) Western blot (K) and flow cytometry (L) of SIRPα protein expression upon CRISPR/Cas9-based SIRPAP1 overexpression. See also Figure S6.
Figure 7.
Figure 7.. The proposed model of SIRPα-mediated T-cell-centric immunotherapy response
The proposed model consists of three consecutive layers, from the molecular mechanism to impacts on clinical outcomes. The left and right sides show the contrasting situations of SIRPA high expression vs. SIRPA low expression in tumor cells. On the left side, within tumor cells, SIRPAP1 upregulates SIRPA by functioning as a competing endogenous RNA; within the tumor microenvironment (TME), SIRPα on the surface of tumor cells interacts with CD47 on CD8+ T cells to enhance cell-cell adhesion between these two cell types; and consequently, the enhanced cell-cell interaction increases the T cell killing effect, leading to a better response to anti-PD-1/PD-L1 therapy. In contrast, on the right side, tumor cells with low SIRPA expression have moderate cell-cell adhesion with CD8+ T cells, thereby rendering resistance to anti-PD-1/PD-L1 therapy. The bottom panels show clinical implications of the proposed model in terms of indication for treatment, immunotherapy biomarker, and therapeutic development.

Comment in

References

    1. Adams S, van der Laan LJ, Vernon-Wilson E, Renardel de Lavalette C, Dopp EA, Dijkstra CD, Simmons DL, and van den Berg TK (1998). Signal-regulatory protein is selectively expressed by myeloid and neuronal cells. J Immunol 161, 1853–1859. - PubMed
    1. Agaimy A, Specht K, Stoehr R, Lorey T, Markl B, Niedobitek G, Straub M, Hager T, Reis AC, Schilling B, et al. (2016). Metastatic Malignant Melanoma With Complete Loss of Differentiation Markers (Undifferentiated/Dedifferentiated Melanoma): Analysis of 14 Patients Emphasizing Phenotypic Plasticity and the Value of Molecular Testing as Surrogate Diagnostic Marker. Am J Surg Pathol 40, 181–191. - PubMed
    1. Akbani R, Ng PK, Werner HM, Shahmoradgoli M, Zhang F, Ju Z, Liu W, Yang JY, Yoshihara K, Li J, et al. (2014). A pan-cancer proteomic perspective on The Cancer Genome Atlas. Nat Commun 5, 3887. - PMC - PubMed
    1. Ansell SM, Lesokhin AM, Borrello I, Halwani A, Scott EC, Gutierrez M, Schuster SJ, Millenson MM, Cattry D, Freeman GJ, et al. (2015). PD-1 blockade with nivolumab in relapsed or refractory Hodgkin’s lymphoma. N Engl J Med 372, 311–319. - PMC - PubMed
    1. Aran D, Sirota M, and Butte AJ (2015). Systematic pan-cancer analysis of tumour purity. Nat Commun 6, 8971. - PMC - PubMed

Publication types