. 2023 Feb 14;100(7):e703-e718.
doi: 10.1212/WNL.0000000000201538. Epub 2022 Nov 4.

Impact of White Adipose Tissue on Brain Structure, Perfusion, and Cognitive Function in Patients With Severe Obesity: The BARICO Study

Affiliations

Impact of White Adipose Tissue on Brain Structure, Perfusion, and Cognitive Function in Patients With Severe Obesity: The BARICO Study

Debby Vreeken et al. Neurology. .

Abstract

Background and objective: While underlying pathophysiology linking obesity to brain health is not completely understood, white adipose tissue (WAT) is considered a key player. In obesity, WAT becomes dysregulated, showing hyperplasia, hypertrophy, and eventually inflammation. This disbalance leads to dysregulated secretion of adipokines influencing both (cardio)vascular and brain health. Within this study, we investigated the association between omental WAT (oWAT) and subcutaneous WAT (scWAT) with brain structure and perfusion and cognition in adults with severe obesity.

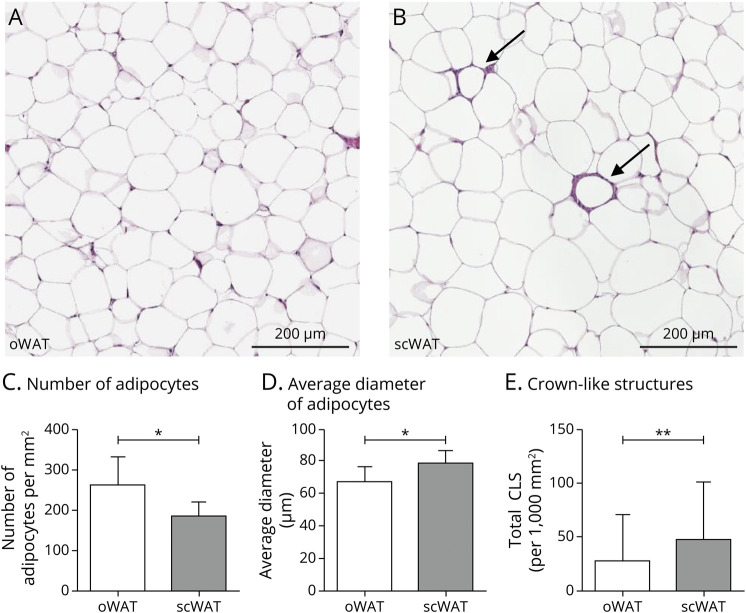
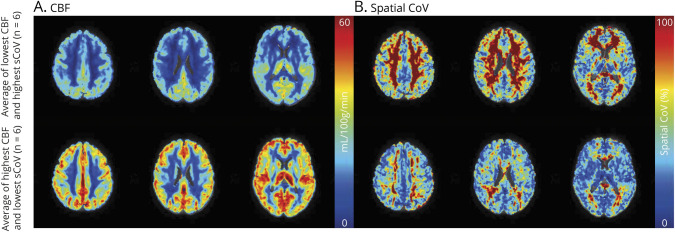
Methods: Within the cross-sectional BARICO study, brain structure and perfusion and cognitive function were measured before bariatric surgery (BS) using MRI and cognitive assessments. During BS, oWAT and scWAT depots were collected and analyzed by histopathology. The number and diameter of adipocytes were quantified together with the amount of crown-like structures (CLS) as an indication of inflammation. Blood samples were collected to analyze adipokines and inflammatory markers. Neuroimaging outcomes included brain volumes, cortical thickness, white matter (WM) integrity, WM hyperintensities, cerebral blood flow using arterial spin labeling (ASL), and the ASL spatial coefficient of variation (sCoV), reflecting cerebrovascular health.

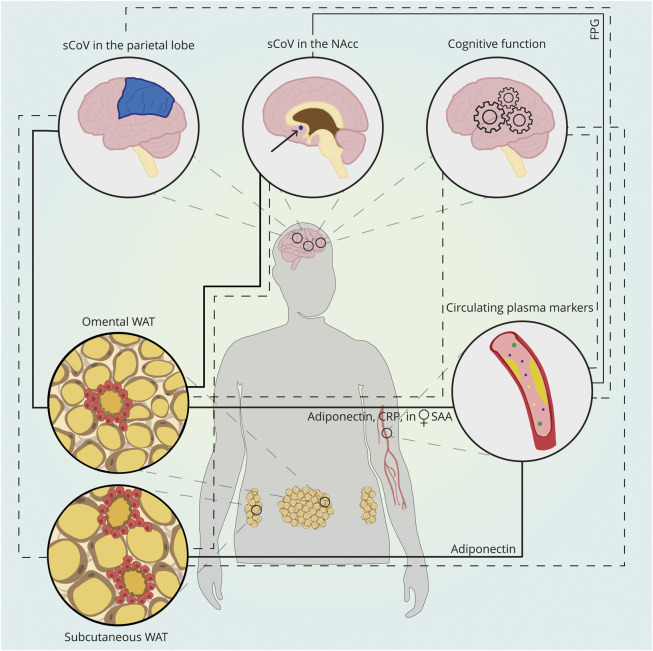
Results: Seventy-one patients were included (mean age 45.1 ± 5.8 years; 83.1% women; mean body mass index 40.8 ± 3.8 kg/m2). scWAT showed more CLS (z = -2.72, p < 0.01, r = -0.24) and hypertrophy compared with oWAT (F(1,64) = 3.99, p < 0.05, η2 = 0.06). Adiponectin levels were inversely associated with the average diameter of scWAT (β = -0.31, 95% CI -0.54 to -0.08) and oWAT (β = -0.33, 95% CI -0.55 to -0.09). Furthermore, the adipocyte diameter in oWAT was positively associated with the sCoV in the parietal cortex (β = 0.33, 95% CI 0.10-0.60), and the number of adipocytes (per mm2) was positively associated with sCoV in the nucleus accumbens (NAcc) (β = 0.34, 95% CI 0.09-0.61). Cognitive function did not correlate with any WAT parameter or plasma marker. These associations were highly influenced by age and sex. sCoV in the NAcc was positively associated with fasting plasma glucose (β = 0.35, 95% CI 0.10-0.56).

Discussion: scWAT and oWAT are different in morphology and in their relationship with plasma markers and cerebrovascular health. Although scWAT showed more CLS and hypertrophy, scWAT was not associated with brain readouts. This study showed, however, important relationships between oWAT morphology and cerebrovascular health in obesity.

Trial registration information: Trial Registration Number NTR7288 (trialregister.nl/trial/7090).


Figures

Figure 1
Figure 1. Photomicrographs of Hematoxylin-Eosin–Stained Adipocyte Morphology and Morphology Differences Between Subcutaneous and Omental WAT
(A–B) Representative pictures of adipocytes in oWAT (A) and subcutaneous WAT (B) including crown-like structures (CLS) (indicated with arrows). (C) Number of adipocytes per mm2 in omental and subcutaneous WAT. (D) Average diameter of adipocytes (µm) in omental and subcutaneous WAT. (E) Total number of CLS per 1,000 mm2 in omental and subcutaneous WAT. Data are presented in mean ± SD. *p < 0.05, **p < 0.01. Analyses between oWAT and scWAT based on the number of adipocytes, diameter of adipocytes was controlled for age and sex. More information on the exact number of participants for each WAT parameter is summarized in eTable 2, links.lww.com/WNL/C471. Abbreviations: oWAT = omental white adipose tissue; scWAT = subcutaneous white adipose tissue.
Figure 2
Figure 2. Illustrative Figure Depicting CBF (A) and Spatial Cov (B) Maps in Axial Orientation for 3 Slices
Top row, average CBF, and spatial CoV maps of 6 participants with, on average, the lowest CBF in GM and the highest sCoV in GM from the total participants studied. Bottom row, average CBF and spatial sCoV maps for 6 participants with, on average, the highest CBF in GM and the lowest sCoV in GM. Abbreviations: CBF = cerebral blood flow, sCoV = spatial coefficient of variation.
Figure 3
Figure 3. Schematic Summary of the Explored Relationships Between WAT, Circulating Plasma Markers, and Brain Structure and Perfusion
Subcutaneous WAT showed more hypertrophy and crown-like structures compared with oWAT. Subcutaneous WAT and oWAT morphology were associated with circulating adiponectin levels (inverse association between average adipocyte diameter and adiponectin). CRP was inversely associated with adipocyte number and positively with average adipocyte diameter in oWAT. In women, the average diameter of oWAT was positively associated with circulating SAA. oWAT morphology was significantly associated with sCoV in the parietal cortex and in the NAcc: the average diameter of adipocytes in oWAT was positively associated with the sCoV in the parietal cortex, and the number of adipocytes in oWAT was positively associated with sCoV in the NAcc. Subcutaneous WAT and most of the circulating plasma markers were not associated with these brain parameters (dashed lines). Only FPG was positively correlated with sCoV in the NAcc. Furthermore, both WAT depots and plasma markers were associated with cognitive function (dashed lines). For illustrative purposes, other neuroimaging outcomes, such as cerebral blood flow, brain volume, cortical thickness, and white matter hyperintensities are not included in the figure. Abbreviations: sCoV = spatial coefficients of variation; NAcc = nucleus accumbens; WAT = white adipose tissue; CRP = C-reactive protein; SAA = serum amyloid A; FPG = fasting plasma glucose; oWAT = oWAT = omental WAT.

References

    1. WHO. Obesity and overweight; Fact Sheet [online]. Available at: who.int/news-room/fact-sheets/detail/obesity-and-overweight. Accessed December 2021.
    1. Kiliaan AJ, Arnoldussen IAC, Gustafson DR. Adipokines: a link between obesity and dementia? Lancet Neurol. 2014;13(9):913-923. doi: 10.1016/s1474-4422(14)70085-7 - DOI - PMC - PubMed
    1. Morgan CA, Melzer TR, Roberts RP, et al. . Spatial variation of perfusion MRI reflects cognitive decline in mild cognitive impairment and early dementia. Sci Rep. 2021;11(1):23325. doi: 10.1038/s41598-021-02313-z - DOI - PMC - PubMed
    1. Dorrance AM, Matin N, Pires PW. The effects of obesity on the cerebral vasculature. Curr Vasc Pharmacol. 2014;12(3):462-472. doi: 10.2174/1570161112666140423222411 - DOI - PMC - PubMed
    1. Hamer M, Batty GD. Association of body mass index and waist-to-hip ratio with brain structure: UK Biobank study. Neurology. 2019;92(6):e594‐e600. doi: 10.1212/wnl.0000000000006879 - DOI - PMC - PubMed

Publication types

MeSH terms