. 2022 Nov 4;13(1):6665.
doi: 10.1038/s41467-022-34208-6.

Spatial analysis of the glioblastoma proteome reveals specific molecular signatures and markers of survival

Affiliations

Spatial analysis of the glioblastoma proteome reveals specific molecular signatures and markers of survival

Marie Duhamel et al. Nat Commun. .

Abstract

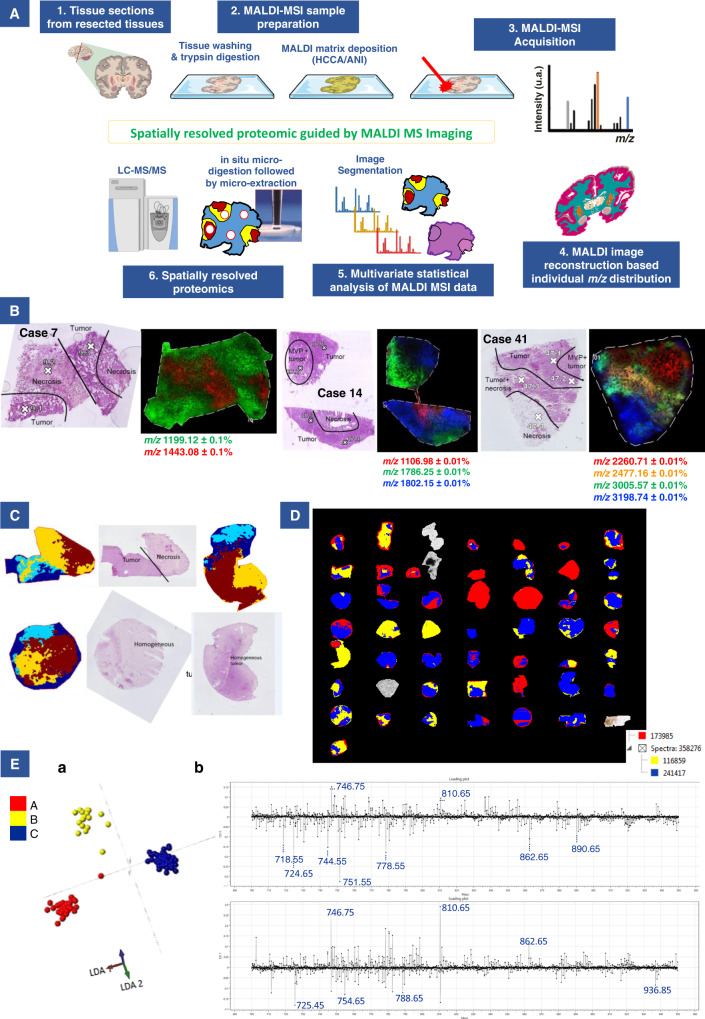
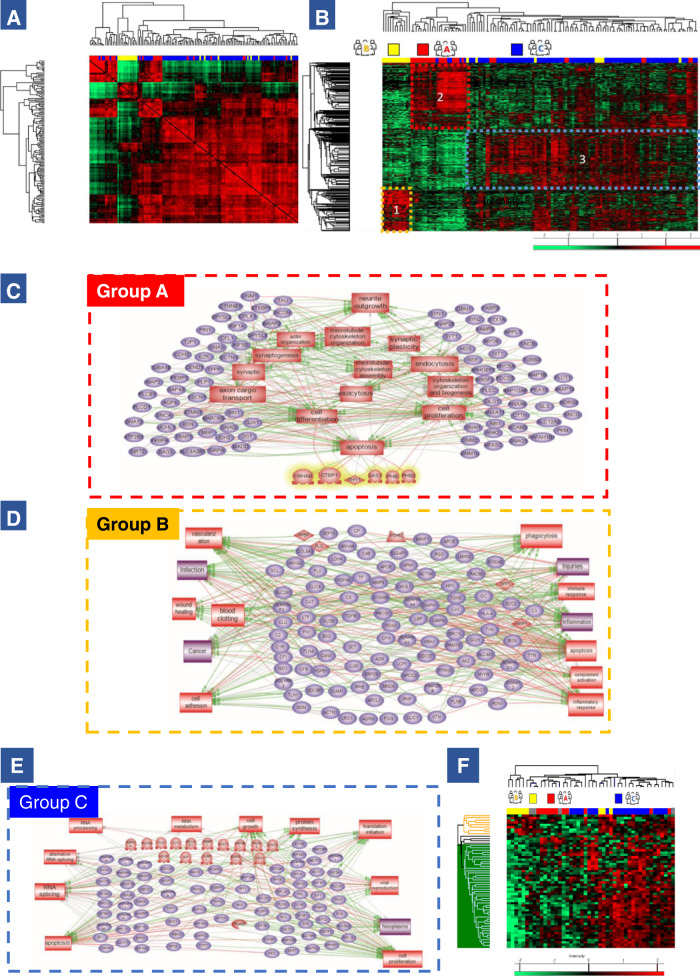
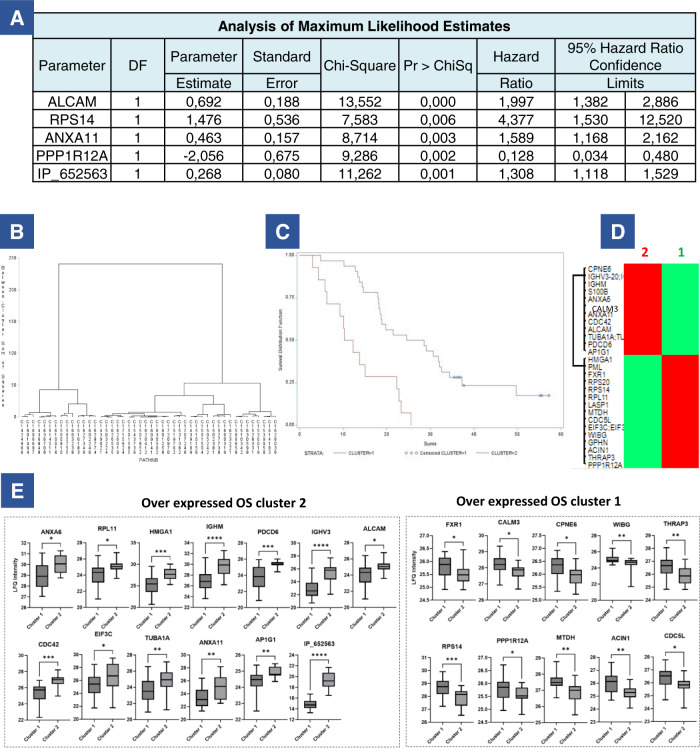
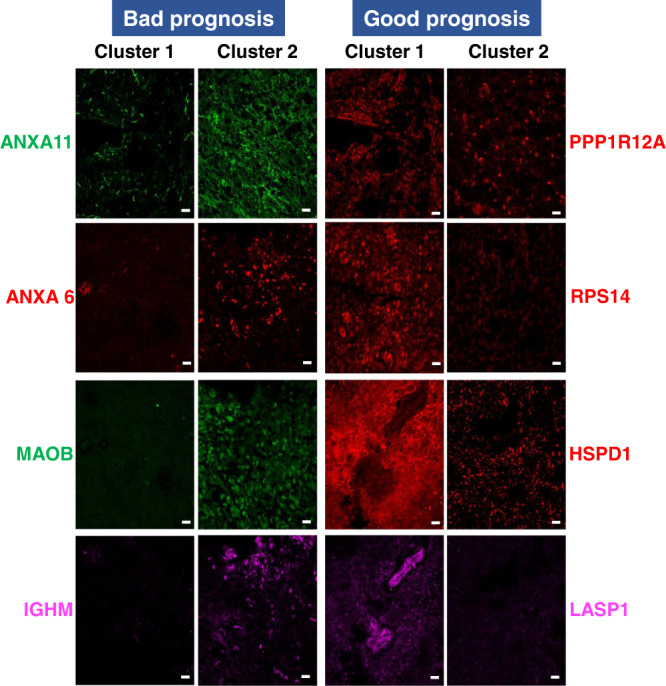
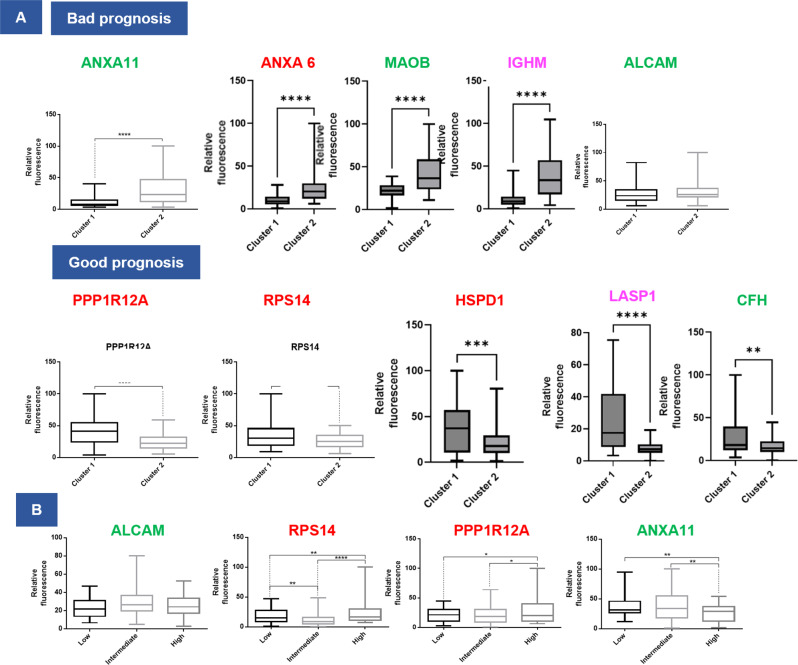
Molecular heterogeneity is a key feature of glioblastoma that impedes patient stratification and leads to large discrepancies in mean patient survival. Here, we analyze a cohort of 96 glioblastoma patients with survival ranging from a few months to over 4 years. 46 tumors are analyzed by mass spectrometry-based spatially-resolved proteomics guided by mass spectrometry imaging. Integration of protein expression and clinical information highlights three molecular groups associated with immune, neurogenesis, and tumorigenesis signatures with high intra-tumoral heterogeneity. Furthermore, a set of proteins originating from reference and alternative ORFs is found to be statistically significant based on patient survival times. Among these proteins, a 5-protein signature is associated with survival. The expression of these 5 proteins is validated by immunofluorescence on an additional cohort of 50 patients. Overall, our work characterizes distinct molecular regions within glioblastoma tissues based on protein expression, which may help guide glioblastoma prognosis and improve current glioblastoma classification.


Conflict of interest statement

Dr. E.L.R. has received honoraria for lectures or advisory board from Adastra, Bayer, Janssen, Leo Pharma, Pierre Fabre, and Seattle Genetics. Dr. M.W. has received research grants from Apogenix, Merck, Sharp & Dohme, Merck (EMD), Philogen and Quercis, and honoraria for lectures or advisory board participation or consulting from Adastra, Bayer, Bristol Meyer Squibb, Medac, Merck, Sharp & Dohme, Merck (EMD), Nerviano Medical Sciences, Novartis, Orbus, Philogen and y-Mabs. The remaining authors declare no competing interests.

Figures

Fig. 1
Fig. 1. Histological, MALDI-MSI, and SpiderMass data.
A General workflow of the MALDI-MS imaging combined with microproteomics used for glioblastoma inter- and intratumor heterogeneities characterization (Created with BioRender.com). B Selection of specific m/z ions identified by MALDI-MSI showing a correlation with histological regions annotated by the pathologist. One ion is represented by one color. C Representative annotated histopathology images of three glioblastoma samples and their corresponding segmentation map obtained from MALDI-MSI data. Colors represent molecularly different regions. Note that for two different tissues, similar colors are not equivalent to similar molecular groups. The segmentation map shows different clusters for each case and non-observable with HES coloration. Complete annotations for all samples are provided in Supplementary Fig. 2. D Global segmentation maps of all tissues together after MALDI-MSI analysis. Colors represent molecularly different regions as shown in the corresponding dendrogram. The segmentation map gives 3 main clusters. The four tumors which are not segmented correspond to the IDH-mutant tumors, which were excluded from the analysis. E The built PCA-LDA classification model based on three glioma groups: Group A (red), Group B (yellow), and Group C (blue). a LDA representation of the 3-class PCA-LDA (right). The table (right) represents the “20% out” and “leave-one-patient-out” cross-validation results of the built classification model. b LD2 loading spectra (top) indicate the discrimination between Group A (red) and Group B (yellow). The ten most discriminatory lipid peaks are indicated by the blue dash line. LD1 loading spectra (bottom) indicate the discrimination between Group A (red) and Group C (blue). The ten most discriminatory lipid peaks are indicated by the blue dash line.
Fig. 2
Fig. 2. Spatially resolved shotgun proteomics analysis.
A Matrix correlation map between all microextraction points from the 46 tumors. Correlation coefficients are calculated between each sample and are represented on a heatmap. B Heatmap of proteins with different regulation profiles as determined after label-free quantification in the three groups highlighting the presence of three clusters. Shotgun proteomics was performed after on-tissue trypsin digestion followed by microextraction at the spots determined from MALDI-MSI data. C Pathway analysis of proteins overexpressed in group A reveals that a large majority of protein is involved in (a) neurogenesis, brain development, synaptogenesis and cytoskeleton organization. D Pathway analysis of proteins overexpressed in group B reveals that majority of proteins are involved in injuries, inflammation, and more generally immune system response and vascularization. E Pathway analysis of proteins overexpressed in group C shows implication in cell proliferation, neoplastic processes, RNA metabolism and processing and viral reproduction. F Heatmap of alternative proteins with different regulation profiles as determined after label-free quantification in the three regions highlighting the presence of three clusters. Source data are provided as a Supplementary Data file.
Fig. 3
Fig. 3. Proteomic and survival analysis.
A, B Analysis of maximum likelihood estimates of the five proteins significantly correlated with survival (ANXA11, RPS14, ALCAM, PPP1R12A, and AltProt IP_652563) identified after a step-by-step analysis and bootstrap procedure and B. patient clustering based on these proteins. C Overall survival of the 46 patients according to the expression of the five prognostic markers. Two clusters of patients were identified with a clear difference in their survival. Cluster 1 has longer survival than cluster 2. D Heatmap of the 28 proteins significant in the Cox model (P < 0.01) between the two groups of patients defined by their OS (left). E Boxplots of the 28 prognosis proteins significant after applying the Cox model. Their LFQ values were compared between patients of cluster 1 (long survival, n = 14 patients) and cluster 2 (short survival, n = 32 patients). Significant differences were identified using two-sided unpaired t test with ****P < 0.0001; ***P < 0.001; **P < 0.01, and *P < 0.05. Box plot indicates median, and whiskers indicate the extrema (minima and maxima values). The box extends from the 25th to the 75th percentiles. Exact P value ANXA6 0.04; RPL11 0.0232; HMGA1 0.0007; IGHM < 0.0001; PDCD6 0.0001; IGHV3 < 0.0001; ALCAM 0.0232; CDC42 0.0002; EIF3C 0.0224; TUBA1A 0.0092; ANXA11 0.0016; AP1G1 0.0071; IP_ < 0.0001; FXR1 0.0234; CALM3 0.0149; CPNE6 0.0156; WIBG 0.0035; THRAP3 0.0062; RPS14 0.0009; PPP1R12A 0.0497; MTDH 0.0016; ACIN1 0.0034; CDC5L 0.0164. Source data are provided as a Supplementary Data file.
Fig. 4
Fig. 4. Validation immunohistochemistry of the panel of survival markers identified.
Representative fluorescence images of eight proteins in the two OS clusters of patients. Images were acquired with a confocal microscope at ×40 magnification. The experiment was repeated on representative tissues of 23 patients for the prospective cohort and on representative tissues of 50 patients for the validation cohort. For each tissue, 3–4 images were taken for quantification. Scale bar = 20 µm.
Fig. 5
Fig. 5. Quantification of the panel of survival markers identified.
Quantification of fluorescence intensities of (A) the ten proteins in the two OS clusters. Images taken from 14 tumors of cluster 1 and 9 tumors of cluster 2 and (B) 4 proteins in an external cohort of glioblastoma patients (50 patients). Patients were classified according to their survival times (low, intermediate, and high). The fluorescence intensities of images taken from 50 tumors were quantified. For each tumor, 3–4 images were acquired and quantified. Significant differences were identified using multiple ANOVA comparison with ****P < 0.0001; ***P < 0.001; **P < 0.01, and *P < 0.05. Box plot indicates median, and whiskers indicate extrema (minima and maxima values). The box extends from the 25th to 75th percentiles.

References

    1. Ostrom QT, Cioffi G, Waite K, Kruchko C, Barnholtz-Sloan JS. CBTRUS statistical report: primary brain and other central nervous system tumors diagnosed in the United States in 2014-2018. Neuro. Oncol. 2021;23:III1–III105. - PMC - PubMed
    1. Chinot OL, et al. Bevacizumab plus radiotherapy–temozolomide for newly diagnosed glioblastoma. N. Engl. J. Med. 2014;370:709–722. - PubMed
    1. Gilbert MR, et al. A randomized trial of bevacizumab for newly diagnosed glioblastoma. N. Engl. J. Med. 2014;370:699–708. - PMC - PubMed
    1. Stupp R, et al. Effects of radiotherapy with concomitant and adjuvant temozolomide versus radiotherapy alone on survival in glioblastoma in a randomised phase III study: 5-year analysis of the EORTC-NCIC trial. Lancet Oncol. 2009;10:459–466. - PubMed
    1. Stupp R, et al. Effect of tumor-treating fields plus maintenance temozolomide vs maintenance temozolomide alone on survival in patients with glioblastoma: a randomized clinical trial. J. Am. Med. Assoc. 2017;318:2306–2316. - PMC - PubMed

Publication types