. 2022 Nov 4;13(1):6635.
doi: 10.1038/s41467-022-34129-4.

Amyloid-associated increases in soluble tau relate to tau aggregation rates and cognitive decline in early Alzheimer's disease

Collaborators, Affiliations

Amyloid-associated increases in soluble tau relate to tau aggregation rates and cognitive decline in early Alzheimer's disease

Alexa Pichet Binette et al. Nat Commun. .

Abstract

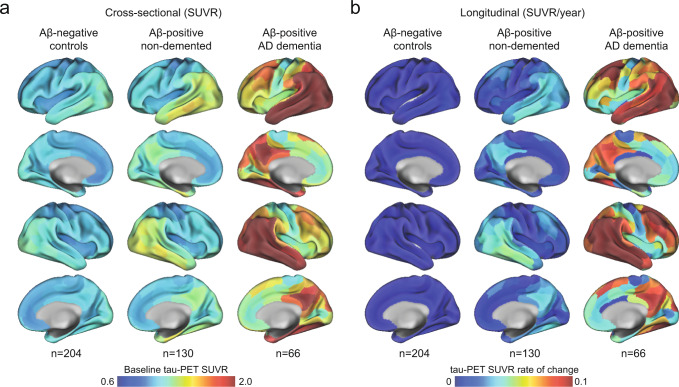
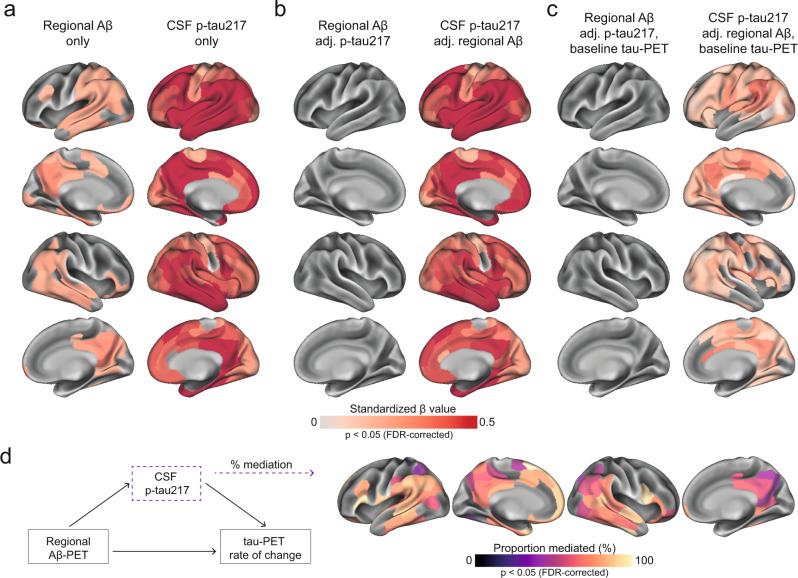
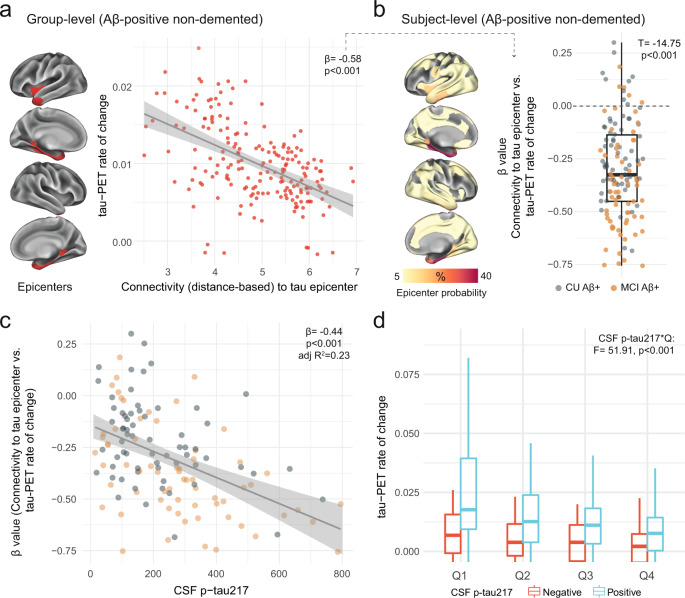
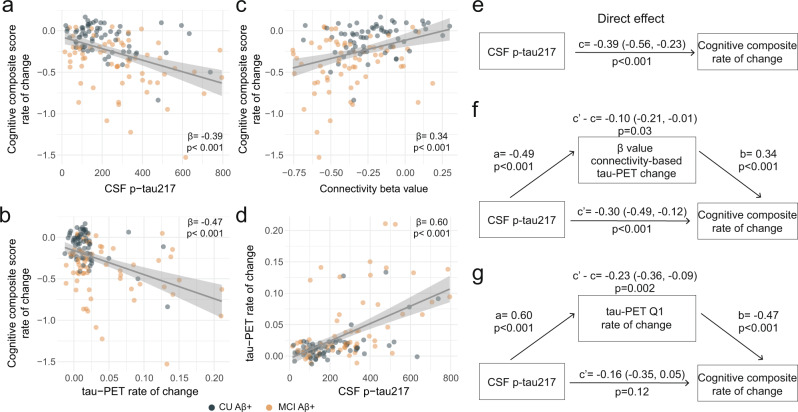
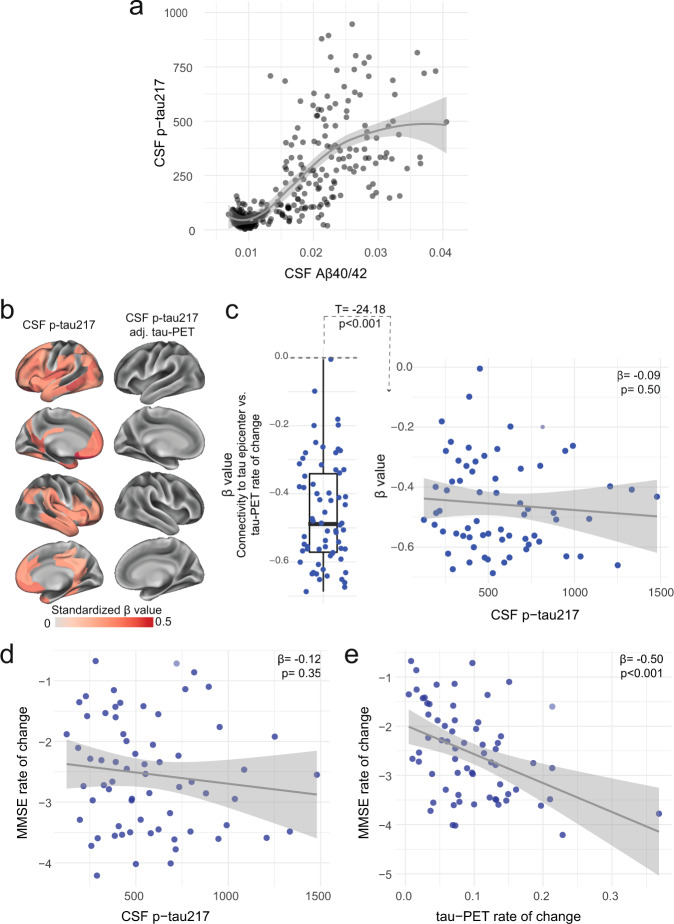
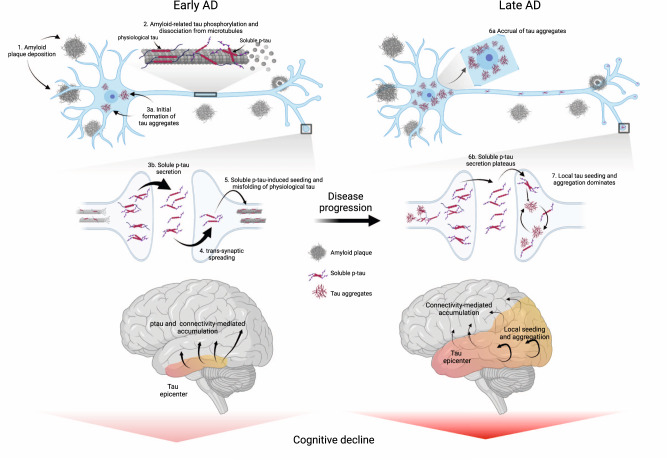
For optimal design of anti-amyloid-β (Aβ) and anti-tau clinical trials, we need to better understand the pathophysiological cascade of Aβ- and tau-related processes. Therefore, we set out to investigate how Aβ and soluble phosphorylated tau (p-tau) relate to the accumulation of tau aggregates assessed with PET and subsequent cognitive decline across the Alzheimer's disease (AD) continuum. Using human cross-sectional and longitudinal neuroimaging and cognitive assessment data, we show that in early stages of AD, increased concentration of soluble CSF p-tau is strongly associated with accumulation of insoluble tau aggregates across the brain, and CSF p-tau levels mediate the effect of Aβ on tau aggregation. Further, higher soluble p-tau concentrations are mainly related to faster accumulation of tau aggregates in the regions with strong functional connectivity to individual tau epicenters. In this early stage, higher soluble p-tau concentrations is associated with cognitive decline, which is mediated by faster increase of tau aggregates. In contrast, in AD dementia, when Aβ fibrils and soluble p-tau levels have plateaued, cognitive decline is related to the accumulation rate of insoluble tau aggregates. Our data suggest that therapeutic approaches reducing soluble p-tau levels might be most favorable in early AD, before widespread insoluble tau aggregates.


Conflict of interest statement

O.H. has acquired research support (for the institution) from AVID Radiopharmaceuticals, Biogen, Eli Lilly, Eisai, Fujirebio, GE Healthcare, Pfizer, and Roche. In the past 2 years, he has received consultancy/speaker fees from Amylyx, Alzpath, Biogen, Cerveau, Fujirebio, Genentech, Roche, and Siemens. S.P. has served on scientific advisory boards and/or given lectures in symposia sponsored by F. Hoffmann-La Roche, Biogen, and Geras Solutions. The remaining others declare no competing interests.

Figures

Fig. 1
Fig. 1. Mean spatial distribution of cross-sectional tau-PET [18F]RO948 SUVR and longitudinal rate of change.
a Surface renderings of average baseline tau-PET SUVR in Aβ-negative controls, Aβ-positive non-demented participants and Aβ-positive patients with AD dementia in the 200 parcels from the Schaefer 200-ROI atlas. b Surface renderings of yearly tau-PET SUVR rate of change derived as the slope from linear mixed-effect models in the same participants group as in a. The group of Aβ-negative controls spans both middle-aged and older individuals. In Supplementary Fig 1, we show individuals above 50 years old, as well as dividing the non-demented group into CU and MCI. Source data are provided as a Source Data file. Aβ beta-amyloid, AD Alzheimer’s disease, CU cognitively unimpaired, MCI mild cognitive impairment, PET positron emission tomography, SUVR standardized uptake value ratio.
Fig. 2
Fig. 2. Regional Aβ-PET and CSF p-tau217 associations with regional tau-PET [18F]RO948 rate of change in Aβ-positive non-demented participants.
a Standardized beta coefficient of local Aβ-PET in regions where regional Aβ-PET flutemetamol SUVR (left column) relates to regional tau-PET rate of change, adjusting for age and sex. Right columns were derived from a similar model, but using CSF p-tau217 as predictor instead of Aβ-PET. b Standardized beta coefficient where local Aβ-PET (left column) and CSF p-tau217 (right column) is associated to regional tau-PET rate of change when including both biomarkers in the same model, adjusting for age and sex (tau PET rate of change ∼ regional Aβ-PET + CSF p-tau217 + age + sex). c Same depiction as in b, when additionally controlling for regional baseline tau-PET SUVR. d Mediating effect of CSF p-tau217 on local Aβ-related accumulation of local tau aggregates. The mediation models were performed region-wise, and the percentage of the mediating effect are projected on the brains. Statistical details of the mediation models are shown in Supplementary Fig. 8. Significance of the mediation effect was tested using 1000 bootstrapping iterations. All regions shown on the brain are significant at p < 0.05 after FDR-correction from two-sided statistical tests. Source data are provided as a Source Data file. Aβ beta-amyloid, CSF cerebrospinal fluid, FDR false discovery rate, PET positron emission tomography, p-tau phosphorylated tau, SUVR standardized uptake value ratio.
Fig. 3
Fig. 3. Individualized connectivity-based associations of tau-PET rate of change over time and CSF p-tau217 in Aβ-positive non-demented participants.
a Group-level analysis showing how connectivity to the tau epicenters (projected on the glass brains) relates to tau-PET rate of change across the whole brain. Each dot represents a brain region. Regions more strongly functionally connected to the epicenters have greater rate of tau-PET accumulation. b Repeating the same approach depicted in a at the individual level, the values on the glass brains represent the percentage that each region is classified as an epicenter. The box plot shows the individual β-value (n = 130) from the correlation between tau-PET rate of change and connectivity-based distance to epicenters across all brain regions. c Scatter plot of the associations between CSF p-tau217 and the β-values of epicenter connectivity to tau-PET rate of change. Each dot represents an individual (n = 130). The expected negative association suggests that higher CSF p-tau217 is associated with the overall pattern of tau-PET change in more functionally connected regions to epicenters. d Average tau-PET rate of change across all participants (n = 130) in regions split into quartiles based each region’s connectivity to the tau epicenters (Q1 represents top 25% regions with strongest functional connectivity to the epicenters, etc.). All linear regressions performed were two-sided, without adjustment for multiple comparisons and error bands correspond to the 95% confidence interval. In all box plots, the box limits represent the interquartile range and the line depicts the median value. Aβ beta-amyloid, CSF cerebrospinal fluid, PET positron emission tomography, p-tau phosphorylated tau, Q quartile.
Fig. 4
Fig. 4. Tau aggregates accumulation mediates associations between CSF p-tau217 and cognitive decline in Aβ-positive non-demented participants.
a–d Scatter plots of associations relevant to subsequent mediation analyses, beta coefficients from linear regressions adjusting for age, sex and education are reported. a Association between CSF p-tau217 and rate of change on the cognitive composite score. b Association between tau-PET rate of change in Q1 and rate of change on the cognitive composite score. c Association between β-value from the correlation between tau-PET rate of change and connectivity-based distance to epicenters across all brain regions and rate of change on the cognitive composite score. d Association between CSF p-tau217 and tau-PET rate of change in Q1. e–g Mediation analysis of the relationship between CSF p-tau217, measures of tau-PET and cognitive decline measured as the rate of change on the cognitive composite score. The direct effect (c) of CSF p-tau217 on cognitive decline is shown in e. Analyses are shown with β-value based on connectivity and tau-PET change (f), and tau-PET rate of change in Q1 (g) as mediators. The mediated effect is designated c-c’. The remaining effect of CSF p-tau217 on cognitive decline after adjusting for the mediator is designated c′. 95% confidence intervals derived from 1000 simulations are reported in parentheses. The direct effect of CSF p-tau217 on the mediator is a, and the direct effect of the mediator on cognitive decline is b. The β-value based on connectivity and tau-PET change (f) and tau-PET rate of change (g) mediated the relationship between CSF p-tau217 and cognitive decline. To facilitate model comparisons, all models use continuous standardized (z-score) data for variables of interest. All linear regressions performed were two-sided, without adjustment for multiple comparisons and error bands correspond to the 95% confidence interval. Aβ beta-amyloid, CSF cerebrospinal fluid, PET positron emission tomography, p-tau phosphorylated tau, Q quartile.
Fig. 5
Fig. 5. Distinct associations between CSF p-tau217 and tau-PET rate of change in the AD dementia stage.
a Associations between the ratio of CSF Aβ40/42 from Elecsys and CSF p-tau217 across the AD continuum. CSF Aβ40/42 is shown here instead of PET to include the entire BioFINDER-2 cohort, since AD dementia patients do not undergo Aβ-PET. A similar association with Aβ-PET SUVR is shown in a restricted sample without AD dementia patients in Supplementary Fig. 13. The association is nonlinear and flatten at high Aβ load. b CSF p-tau217 alone was mildly associated with tau-PET rate of change (left column), which was not the case when additionally adjusting for regional baseline tau-PET SUVR (right column). c Box plot showing the expected negative β-value from the correlation between tau-PET rate of change and connectivity-based distance to epicenters across all AD patients, but this β-value was not related to CSF p-tau217 levels. Scatter plots of associations between CSF p-tau217 (d) and tau-PET rate of change in Q1 (e) and cognitive decline, as measured by MMSE rate of change. Beta coefficients from linear regressions adjusting for age, sex and education are reported. The rate of tau aggregates accumulation was related to cognitive decline, which was not the case for CSF p-tau217. All linear regressions performed were two-sided, without adjustment for multiple comparisons and error bands correspond to the 95% confidence interval. Aβ beta-amyloid, AD Alzheimer’s disease, CSF cerebrospinal fluid, MMSE Mini-mental state examination, PET positron emission tomography, p-tau phosphorylated tau.
Fig. 6
Fig. 6. Proposed model of tau pathology accumulation in Alzheimer’s disease.
In early AD, soluble or insoluble Aβ triggers increased concentrations and secretion of soluble p-tau, followed by post-synaptic uptake of p-tau seeds that lead to tau misfolding and aggregation. In late stages of the disease, when soluble p-tau concentrations have reached a plateau, local tau aggregates rather dominate in driving further local tau aggregation. Figure created with BioRender.com. Aβ beta-amyloid, AD Alzheimer’s disease, p-tau phosphorylated tau.

References

    1. Hansson, O. Biomarkers for neurodegenerative diseases. Nat. Med.27, 954–963 (2021). - PubMed
    1. Hyman BT, et al. National Institute on Aging-Alzheimer’s Association guidelines for the neuropathologic assessment of Alzheimer’s disease. Alzheimers Dement. 2012;8:1–13. - PMC - PubMed
    1. Dore, V. et al. Relationship between amyloid and tau levels and its impact on tau spreading. Eur. J. Nucl. Med. Mol. Imaging48, 2225–2232 (2021). - PMC - PubMed
    1. He Z, et al. Amyloid-beta plaques enhance Alzheimer’s brain tau-seeded pathologies by facilitating neuritic plaque tau aggregation. Nat. Med. 2018;24:29–38. - PMC - PubMed
    1. Long JM, Holtzman DM. Alzheimer disease: an update on pathobiology and treatment strategies. Cell. 2019;179:312–339. - PMC - PubMed

Publication types