. 2022 Nov 4;13(1):6623.
doi: 10.1038/s41467-022-34428-w.

Tumor factors stimulate lysosomal degradation of tumor antigens and undermine their cross-presentation in lung cancer

Affiliations

Tumor factors stimulate lysosomal degradation of tumor antigens and undermine their cross-presentation in lung cancer

Zhen Lu et al. Nat Commun. .

Abstract

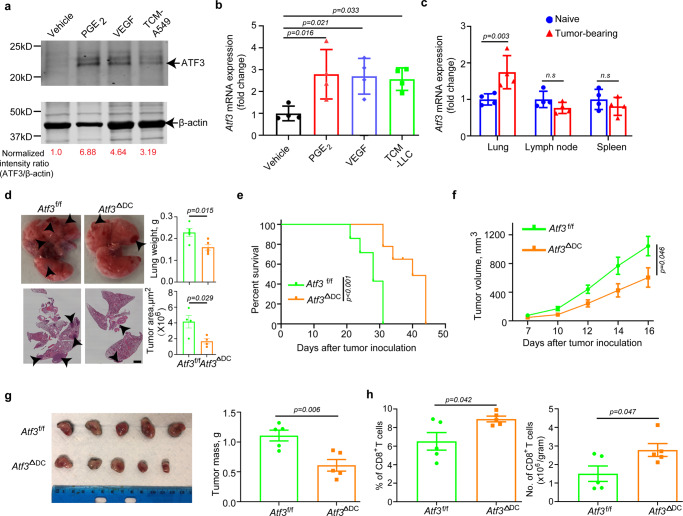
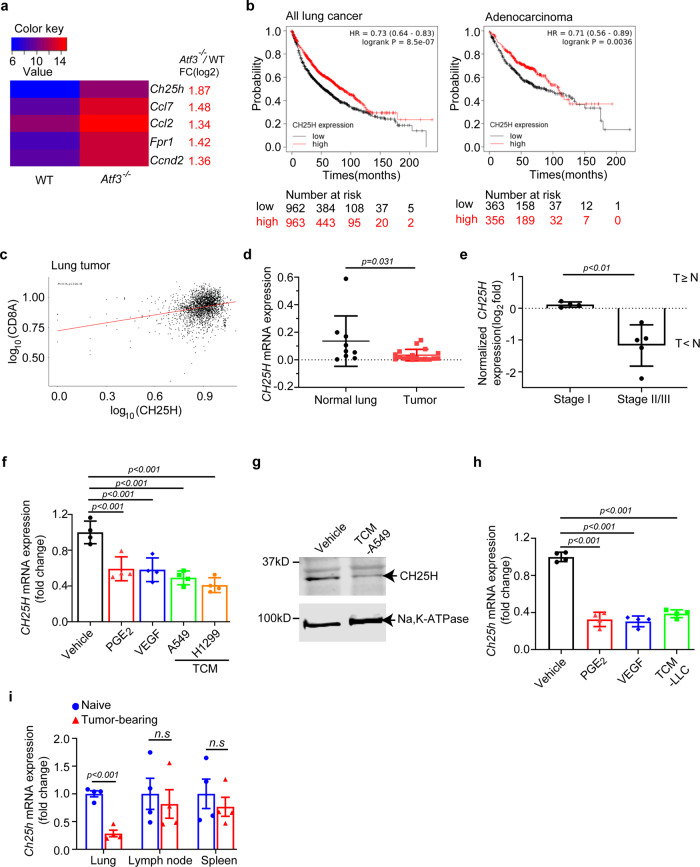
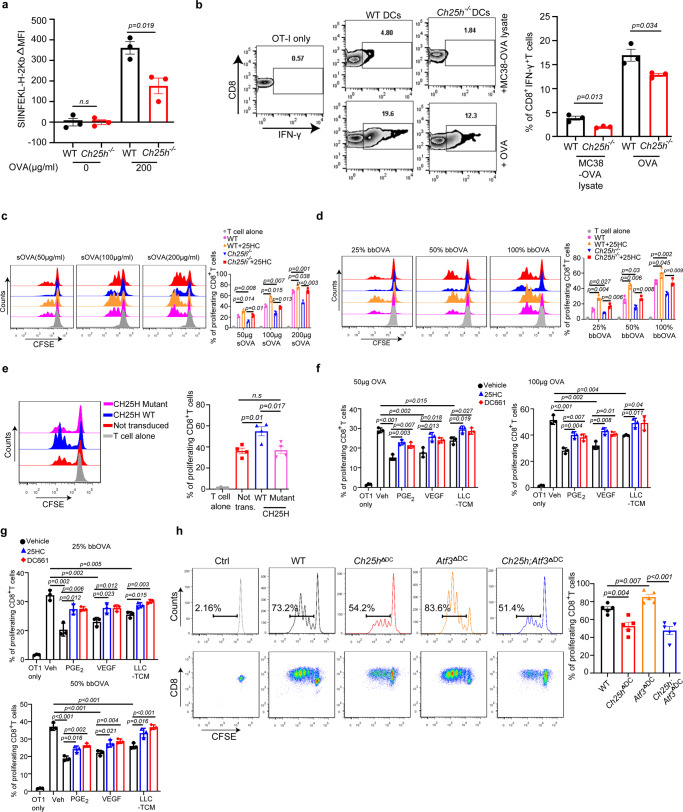
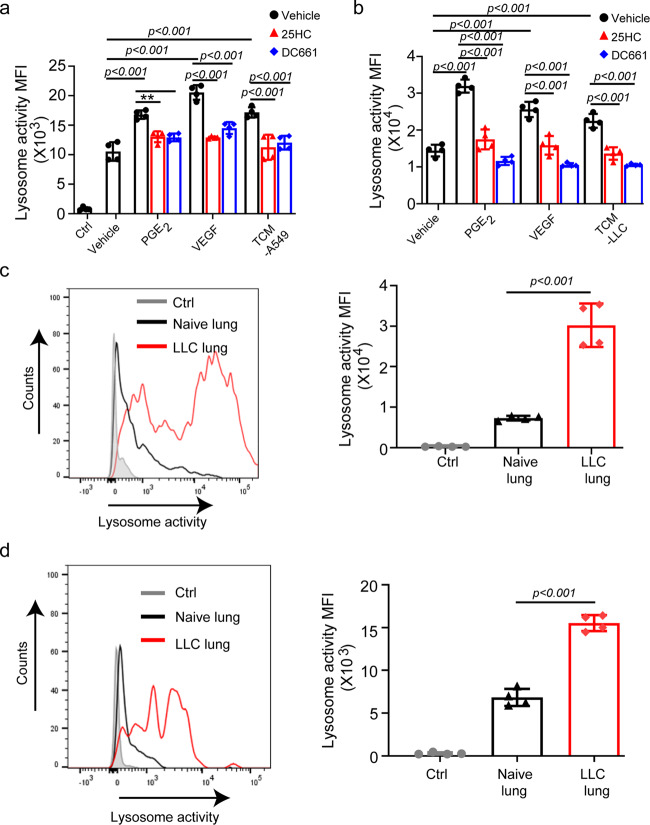
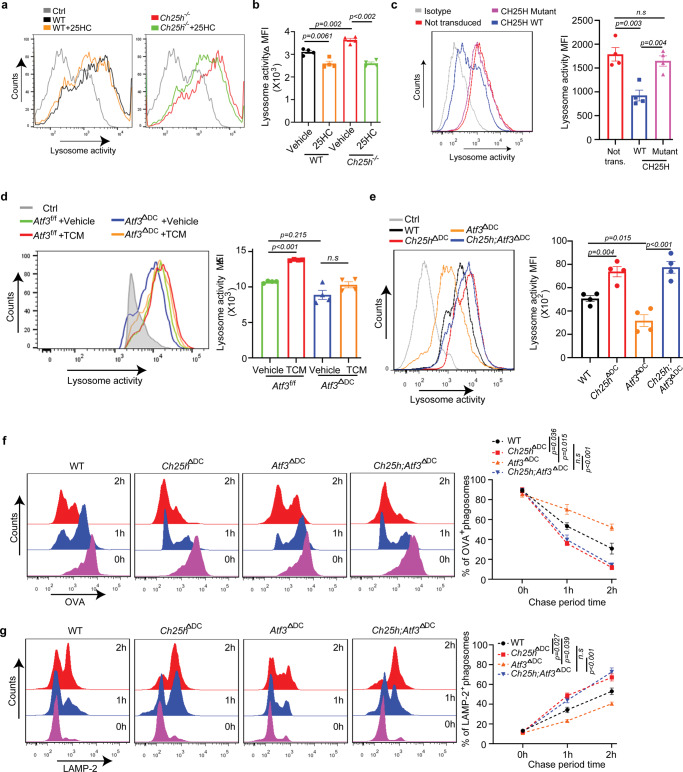
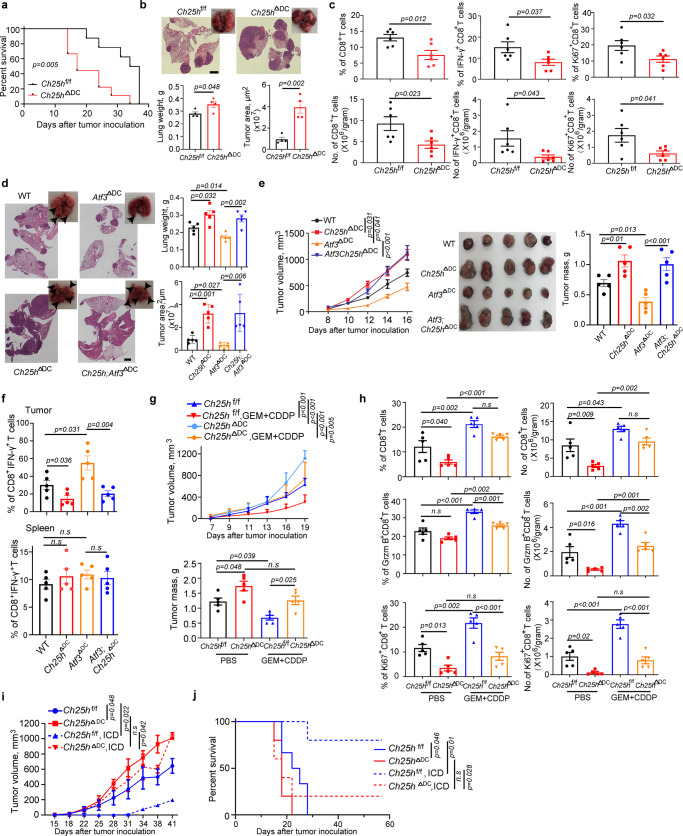
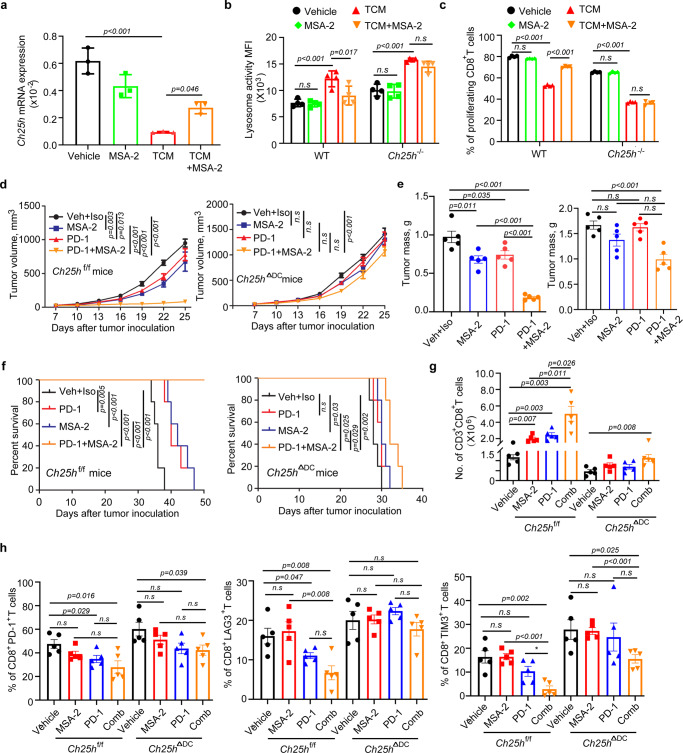
Activities of dendritic cells (DCs) that present tumor antigens are often suppressed in tumors. Here we report that this suppression is induced by tumor microenvironment-derived factors, which activate the activating transcription factor-3 (ATF3) transcription factor and downregulate cholesterol 25-hydroxylase (CH25H). Loss of CH25H in antigen presenting cells isolated from human lung tumors is associated with tumor growth and lung cancer progression. Accordingly, mice lacking CH25H in DCs exhibit an accelerated tumor growth, decreased infiltration and impaired activation of intratumoral CD8+ T cells. These mice do not establish measurable long-term immunity against malignant cells that undergo chemotherapy-induced immunogenic cell death. Mechanistically, downregulation of CH25H stimulates membrane fusion between endo-phagosomes and lysosomes, accelerates lysosomal degradation and restricts cross-presentation of tumor antigens in the intratumoral DCs. Administration of STING agonist MSA-2 reduces the lysosomal activity in DCs, restores antigen cross presentation, and increases therapeutic efficacy of PD-1 blockade against tumour challenge in a CH25H-dependent manner. These studies highlight the importance of downregulation of CH25H in DCs for tumor immune evasion and resistance to therapy.


Conflict of interest statement

All the authors declare no competing interests.

Figures

Fig. 1
Fig. 1. Tumor microenvironment factors-induced ATF3 in DCs promotes tumor growth.
a Immunoblot analysis of ATF3 levels in human monocytes treated with vehicle, Prostaglandin E2 (PGE2, 10 ng/mL), vascular endothelial growth factor (VEGF, 20 ng/mL), or tumor cell-conditioned media (TCM—from A549 cells, 75%, v/v) for 1.5 h. Levels of β-actin (as a loading control) are also shown. b qPCR analysis of Atf3 mRNA in mouse splenic CD11c+ myeloid cells treated with vehicle, PGE2 (10 ng/mL), VEGF (20 ng/mL) or TCM from Lewis lung carcinoma cells (LLC, 75%, v/v) for 2 h. n = 4 biologically independent samples. c qPCR analysis of Atf3 mRNA levels in DCs isolated from lungs, lung-draining lymph nodes (LNs) and spleens from either naïve or lung LLC-bearing mice (inoculated i.v., 1 × 106 cells/mouse, 2 weeks before isolation and analysis). n = 4 biologically independent samples. d Tumor weight, representative lung images and the corresponding H&E-stained lung sections from Atf3f/f and Atf3ΔDC groups (n = 4 mice per group) 14 days after intravenous injection of 6 × 105 LLC tumor cells. Scale bar:2 mm. Similar results were obtained from three independent experiments. e Kaplan–Meier analysis of survival of LLC tumor-bearing mice (after intravenous injection of 4.5 × 105 LLC cells) by log-rank test. n = 7 mice in both Atf3f/f and Atf3ΔDC groups. f Growth of LLC tumors after subcutaneous injection of 6.25 × 105 LLC tumor cells into Atf3f/f or Atf3ΔDC mice. n = 5 mice in each group. g Representative images and quantification of LLC tumor mass at day 18 from the experiment described in panel f. h Flow-cytometric determination of the percentage and quantitative estimates of intratumoral CD8+ T cells from the experiment described in panel 1 f. n = 5 tumors in each group. Data are presented as mean ± SEM. Statistical analysis was performed using 2-tailed Students’ t-test (B, C, D, G and H) or 2-way ANOVA with multiple-comparison test (F) or Kaplan-Meier survival analysis (E) test. n.s., not significant. Source data are provided as a Source Data file.
Fig. 2
Fig. 2. Downregulation of CH25H in human and mouse lung tumors.
a A heat map for the top five differentially expressed genes in an Agilent Whole Mouse Genome Microarray using RNA isolated from WT or Atf3 −/− bone marrow-derived macrophages. Values are the average log2 (intensity) of the signal from probes against the indicated genes (n = 4 mice per genotype). Ch25h: cholesterol 25-hydroxylase; Ccl7: C-C motif chemokine ligand 7; Ccl2: C-C motif chemokine ligand 7; Fpr1: formyl peptide receptor 1; Ccnd2: cyclin D2. b Overall survival curves for CH25H expression (Affy ID: 206932_at) in tumors from patients with non-small cell lung cancers (NSCLC) or lung adenocarcinomas were generated in KM plotter using default parameters and no restrictions. Patients split by median survival. c Correlation analysis between expression of CH25H and of marker for CD8+ T cell presence CD8A in the human lung cancer tumor samples from the GENT2 public database. The plot was generated using the graphical and statistical software R. d qPCR analysis of CH25H expression in CD14+ cells from primary lung tumors and distant (“Normal”) lung tissues from NSCLC patients. n = 18 tumors and n = 9 distant lungs. e Clinical stages and CH25H expression of NSCLC patients. The Fisher’s exact test was used to analyze the correlation between CH25H expression and clinical stages. T ≥ N, comparable CH25H levels within CD14+ monocytes from tumor and distant normal lungs; T < N, lower level of CH25H in intratumoral CD14+ monocytes compared to cells isolated from distant normal lungs. n = 4 for stage I and n = 5 for stage II/III lung cancer. f qPCR analysis of CH25H mRNA levels in human monocytes treated with vehicle, PGE2 (10 ng/mL), VEGF (20 ng/mL), or TCM media from A549 or H1299 cells (75%, v/v). n = 4 biologically independent samples for each group. g Immunoblotting analysis of CH25H protein in human monocytes treated with control medium and medium conditioned from A549 cells (75%, v/v) for 3 h. Levels of Na,K-ATPase that serves as a loading control are also shown. h qPCR analysis of Ch25h mRNA in mouse CD11c+ splenic myeloid cells treated with vehicle, PGE2 (10 ng/mL), VEGF (20 ng/mL) or medium conditioned from LLC cells (75%, v/v). n = 4 biologically independent samples for each group. i qPCR analysis of Ch25h mRNA in DCs isolated and purified from tumor lung, lung-draining LNs and spleen from naïve mice and LLC inoculated mice (i.v., 1 × 106 cells/mouse, 2 weeks after inoculation). n = 4 mice per group. Data are presented as mean ± SEM. Statistical analysis was performed using 2-tailed Students’ t-test (D, E, F, H and I) or KM plotter (B) test. n.s., not significant. Source data are provided as a Source Data file.
Fig. 3
Fig. 3. CH25H expression in DCs enables efficient antigen cross-presentation otherwise inhibited by factors of tumor microenvironment.
a Merged MFI expression of SIINFEKL-bound H-2kb in DCs from indicated mice after treatment of OVA protein (200 μg/mL, 18 h). n = 3 biologically independent samples. b Percentage of IFNγ+ in OT-I CD8+ T cells after 72 h co-culture of naïve OT-I CD8+ T cells with splenic CD11c+ myeloid cells from indicated mouse pulsed with OVA (10:1) or MC38-OVA lysate (10:4). n = 3 biologically independent samples. c Antigen cross presentation analysis for WT or Ch25h−/− DCs pre-treated or not with 25HC (50 nM, 4 h before adding soluble sOVA at indicated concentrations). OVA-pulsed DCs were then co-cultured (10:1 for 72 h) with OT-I CD8+ T cells labeled with carboxy fluorescein succinimidyl ester (CFSE). Proliferation of these T cells was assessed by CFSE dilution. n = 3 biologically independent samples. d Antigen cross presentation analysis for WT or Ch25h−/− DCs pre-treated or not with 25HC (50 nM, 4 h before adding beads loaded with OVA at indicated percentage) was carried out as in panel C. n = 3 biologically independent samples. e Antigen cross presentation analysis for Ch25h−/− DCs transduced with retroviruses for expression of CH25HWT or catalytically inactive CH25HH242,243Q mutant. n = 4 biologically independent samples. f Antigen cross presentation analysis for WT DCs pre-treated with or without PGE2 (10 ng/mL), VEGF (20 ng/mL) or TCM from LLC cells (75%, v/v) for 24 h with or without the treatment of 25HC (50 nM) or DC661 (5 μM) for 4 h as indicated. Then DCs were pulsed with soluble OVA protein (50 or 100 μg/mL, 6 h) and co-cultured with CFSE-labeled OT-I T cells (10:1 for 72 h). n = 3 biologically independent samples. g Antigen cross presentation analysis for WT DCs pre-treated with or without PGE2 (10 ng/mL), VEGF (20 ng/mL) or TCM from LLC cells (75%, v/v) for 24 h with or without the treatment of 25HC (50 nM) or DC661 (5 μM) for 4 h as indicated. Then DCs were then treated with beads-bound OVA protein (25% or 50%, 1 h) and co-cultured with CFSE-labeled OT-I T cells (10:1 for 72 h). n = 3 biologically independent samples. h Antigen cross presentation analysis for DCs of indicated genotypes. T cell proliferation was assessed by flow cytometry in CFSE-labeled OT-I T cells co-cultured (10:1 for 72 h) with DCs from indicated mice, pretreated with conditioned media from LLC cells (70%, v/v) for 24 h and pulsed with soluble OVA protein (200 μg/mL, 6 h). n = 5 biologically independent samples. h Data are presented as mean ± SEM. Statistical analysis was performed using 2-tailed Students’ t-test (A, B, C, D, E and H) or 1-way ANOVA with Tukey’s multiple-comparison test (F and G) test. n.s., not significant. Source data are provided as a Source Data file.
Fig. 4
Fig. 4. CH25H expression in DCs acts to limit the lysosomal degradation otherwise induced by factors of tumor microenvironment.
a Quantitative analysis of DQ-OVA fluorescence in human CD14+ monocytes pretreated with PGE2 (10 ng/mL), VEGF (20 ng/mL) or TCM from A549 cells (75%, v/v) for 24 h with or without the treatment of 25HC (4 µM) or DC661 (100 nM). n = 4 biologically independent samples. b Quantitative analysis of DQ-OVA fluorescence in bone marrow derived DCs pretreated with PGE2 (10 ng/mL), VEGF (20 ng/mL) or TCM from LLC cells (75%, v/v) for 24 h with or without the treatment of 25HC (4 µM) or DC661 (100 nM). n = 4 biologically independent samples. c Representative histogram and quantitative analysis of DQ-OVA fluorescence in total DCs (CD45+CD11c+MHC II+) from naïve lungs or LLC tumor bearing lungs (i.v., 1 × 106 cells/mouse, isolated 2 weeks after inoculation). Ctrl—DCs from LLC lung incubated without DQ-OVA substrate. n = 4 mice per group. d Representative histogram and quantitative analysis of DQ-OVA fluorescence in migratory DCs (CD45+ CD103+CD11b-) from naïve lungs or LLC tumor bearing lungs (i.v., 1 × 106 cells/mouse, isolated 2 weeks after inoculation). Ctrl—DCs from LLC lung incubated without DQ-OVA substrate. n = 4 mice per group. Data presented as mean ± SEM. Statistical analysis was performed using 1-way ANOVA with Tukey’s multiple-comparison test (A and B) test or 2-tailed Students’ t-test (C and D). n.s., not significant. Source data are provided as a Source Data file.
Fig. 5
Fig. 5. CH25H regulates lysosomal proteolysis.
a Representative histogram of DQ-OVA fluorescence in DCs of indicated genotype pretreated with 25HC (4 μM, 4 h) as indicated. n = 4 biologically independent samples. b Quantification of data from panel A. c Representative histogram of DQ-OVA fluorescence in CH25H-null DCs transduced with retroviruses for expression of CH25HWT or catalytically inactive CH25HH242,243Q mutant. n = 4 biologically independent samples. d Representative histogram and quantitative analysis of DQ-OVA fluorescence in DCs isolated from Atf3f/f or Atf3ΔDC mice and pretreated with control media or TCM from LLC cells (67%, v/v) for 24 h. n = 3 biologically independent substrate-free group (Ctrl), n = 4 biologically independent experimental samples in experimental group. e Representative histogram and quantitative analysis of DQ-OVA fluorescence in indicated DCs pretreated with TCM from LLC cells (75%, v/v) for 24 h. n = 4 biologically independent samples. f Histograms show phagosomal degradation of OVA (left) and its quantification(right) after indicated chase periods (n = 3 biologically independent samples). g Histograms show phagosomal acquisition of LAMP2 (left) and its quantification (right) after indicated chase periods (n = 3 biologically independent samples). Data presented as mean ± SEM. Statistical analysis was performed using 1-way ANOVA with Tukey’s multiple-comparison test (B and D) test or 2-way ANOVA with multiple comparison (F and G) or 2-tailed Students’ t-test (C and E). n.s., not significant. Source data are provided as a Source Data file.
Fig. 6
Fig. 6. Downregulation of CH25H in DCs undermines the anti-tumor immunity and accelerates tumor growth.
a Kaplan–Meier analysis of survival of LLC tumor-bearing mice after intravenous injection of 4 × 105 LLC by log-rank test. n = 8 mice in Ch25hf/f and n = 9 mice in Ch25hΔDC groups. b Tumor weight, representative lung images and the corresponding H&E-stained lung sections from Ch25hf/f and Ch25hΔDC mice (n = 4 mice per group) 18 days after intravenous injection of 6 × 105 LLC tumor cells. Scale bar:2 mm. Similar results were obtained from three independent experiments. c Flow-cytometric determination of the percentage and quantitative estimates of intratumoral CD8+ T cells in tumor lungs from Ch25hf/f and Ch25hΔDC mice. n = 6 tumors per genotype. d Tumor weight, representative lung images and the corresponding H&E-stained lung sections from mice of indicated genotypes (n = 5 mice per group) 17 days after intravenous injection of 1 × 106 LLC tumor cells. Scale bar: 1 mm. Similar results were obtained from three independent experiments. e Volume, appearance and mass of LLC tumors on Day 17 after s.c. inoculation (5 × 105 cells/mouse) into mice of indicated genotypes. n = 5 mice per group. f Flow cytometry analysis of IFN-γ expression by CD8+ T cells isolated from LLC tumors or spleens of LLC-bearing mice from experiments described in Panel 6e. g Growth of LLC tumors in mice after s.c. injection of 6 × 105 LLC cells into Ch25hf/f and Ch25hΔDC mice. After 8 days of LLC inoculation, animals were treated with PBS or gemcitabine (GEM, 30 mg/kg, every 3 days, four times) plus cisplatin (CDDP, 3 mg/kg, every 6 days, twice). Tumor weight was measured at day 20 from tumor inoculation. n = 5 mice per group, data was shown in Mean ± SEM. h Flow-cytometric analysis of the percentage and quantitative estimates of intratumoral CD8+ T, Ki67+ and GzmB+ CD8+ T cells. n = 5 tumors in each group. i Volumes of LLC tumors in syngeneic mice that were either vaccinated with LLC cells undergoing immunogenetic cell death (ICD) or not vaccinated. Data were processed using the mixed-effect analysis of 2-way ANOVA with Tukey’s multiple comparisons test. n = 5 mice per group. j Kaplan–Meier analysis of survival of mice from experiment described in panel i. Data were processed using the Log-rank test. n = 5 mice per group. Data presented as mean ± SEM. Statistical analysis was performed using 1-way ANOVA with Tukey’s.l multiple-comparison test (D, E, F, G and H) test or 2-way ANOVA with multiple comparison (E, G and I) or 2-tailed Students’ t-test (B and C) or Kaplan-Meier survival analysis (A and J). n.s., not significant. Source data are provided as a Source Data file.
Fig. 7
Fig. 7. STING agonist acts to maintain CH25H expression in DCs to increase intratumoral immune infiltration and elicit anti-tumor therapeutic effects.
a qPCR analysis of Ch25h mRNA in BMDCs pre-treated with MSA-2 (10 µM) for 30 min and LLC-conditioned media (TCM, 67%, v/v) for 2 h. n = 3 biologically independent samples. b Quantitative estimates of lysosome activity in WT or Ch25h−/− BMDCs pretreated with LLC-conditioned media (TCM, 70% v/v) with or without pre-treatment of MSA-2 (10 µM, 2 h pretreatment) for 16 h. n = 4 biologically independent samples. c Antigen cross-presentation was assessed by proliferation of CFSE-labeled OT-I T cells co-cultured (10:1) with OVA-pulsed (200 μg/mL, 6 h) WT or Ch25h−/− DCs for 72 h. DCs were pre-treated with medium conditioned by LLC cells (70%, v/v) for 20 h with or without the treatment of MSA-2 (10 µM) for 16 h before OVA pulse. n = 4 mice per group. d Volumes of LLC tumors grown in Ch25hf/f (top panel) or Ch25h∆DC (bottom panel) mice treated with Vehicle+Isotype control (anti-mouse IgG1 monoclonal antibody), anti-PD1 antibody (i.p, 5 mg/kg every 4 days), MSA-2 (orally, 60 mg/kg every 4 days) and combination. n = 5 mice per group. e Tumor mass of LLC tumors from experiment described in panel d. n = 5 mice per group. f Kaplan–Meier analysis of survival of LLC tumor-bearing mice described in panel d. n = 5 mice per group. g Flow cytometry analysis of number of CD3+CD8+ T cells in LLC tumors grown in Ch25hf/f or Ch25h∆DC mice with indicated treatment described in panel d. n = 5 mice per group. h Flow cytometry analysis of the percentage of CD8+ PD-1+, CD8+ LAG3+ and CD8+TIM3+ T cells in tumors from experiment described in panel d. n = 5 mice per group. Data presented as mean ± SEM. Statistical analysis was performed using 2-tailed Students’ t-test (A, B, C, E, G and H) or 2-way ANOVA with multiple comparison (D) or Kaplan-Meier survival analysis (F). n.s., not significant. Source data are provided as a Source Data file.

References

    1. Siegel RL, Miller KD, Jemal A. Cancer statistics, 2020. CA Cancer J. Clin. 2020;70:7–30. - PubMed
    1. Garon EB, et al. Pembrolizumab for the treatment of non-small-cell lung cancer. N. Engl. J. Med. 2015;372:2018–2028. - PubMed
    1. Roberts EW, et al. Critical role for CD103(+)/CD141(+) dendritic cells bearing CCR7 for tumor antigen trafficking and priming of T cell immunity in melanoma. Cancer Cell. 2016;30:324–336. - PMC - PubMed
    1. Asano K, et al. CD169-positive macrophages dominate antitumor immunity by crosspresenting dead cell-associated antigens. Immunity. 2011;34:85–95. - PubMed
    1. Singhal, S. et al. Human tumor-associated monocytes/macrophages and their regulation of T cell responses in early-stage lung cancer. Sci. Transl. Med.11, eaat1500 (2019). - PMC - PubMed

Publication types

Substances