. 2022 Nov 4;13(1):6634.
doi: 10.1038/s41467-022-34316-3.

Mitochondrial Fission Process 1 controls inner membrane integrity and protects against heart failure

Affiliations

Mitochondrial Fission Process 1 controls inner membrane integrity and protects against heart failure

Erminia Donnarumma et al. Nat Commun. .

Abstract

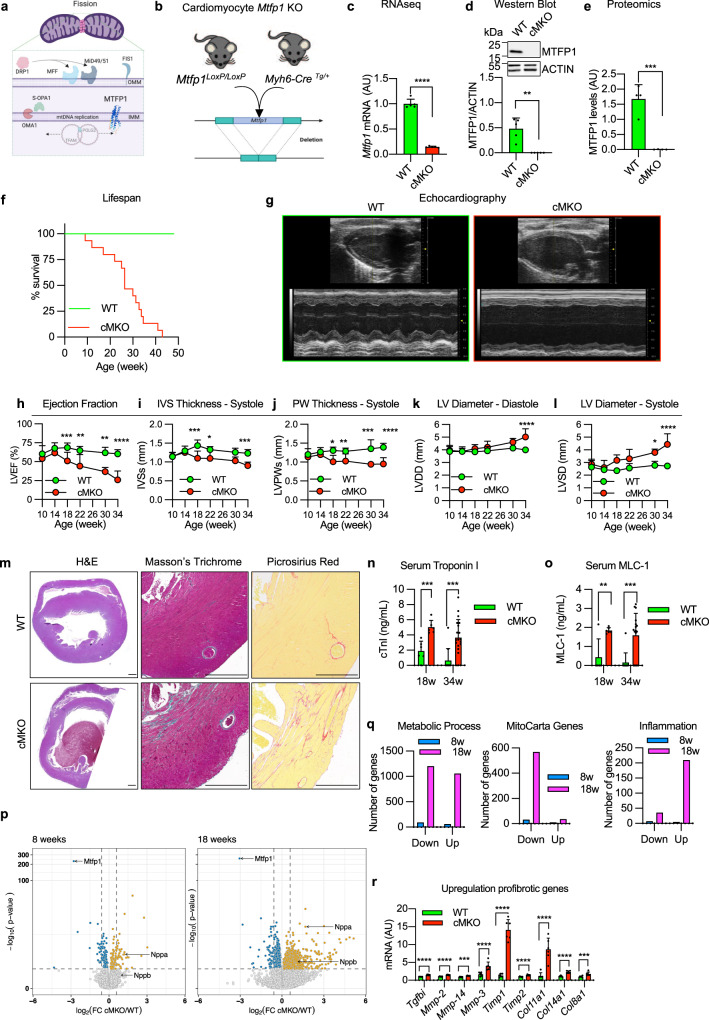
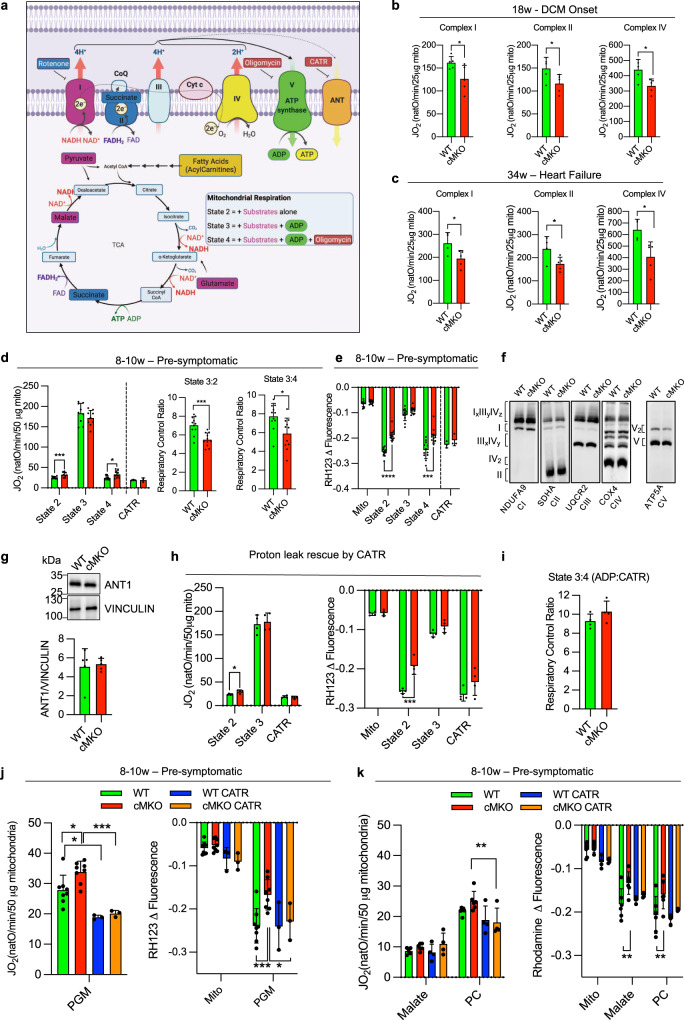
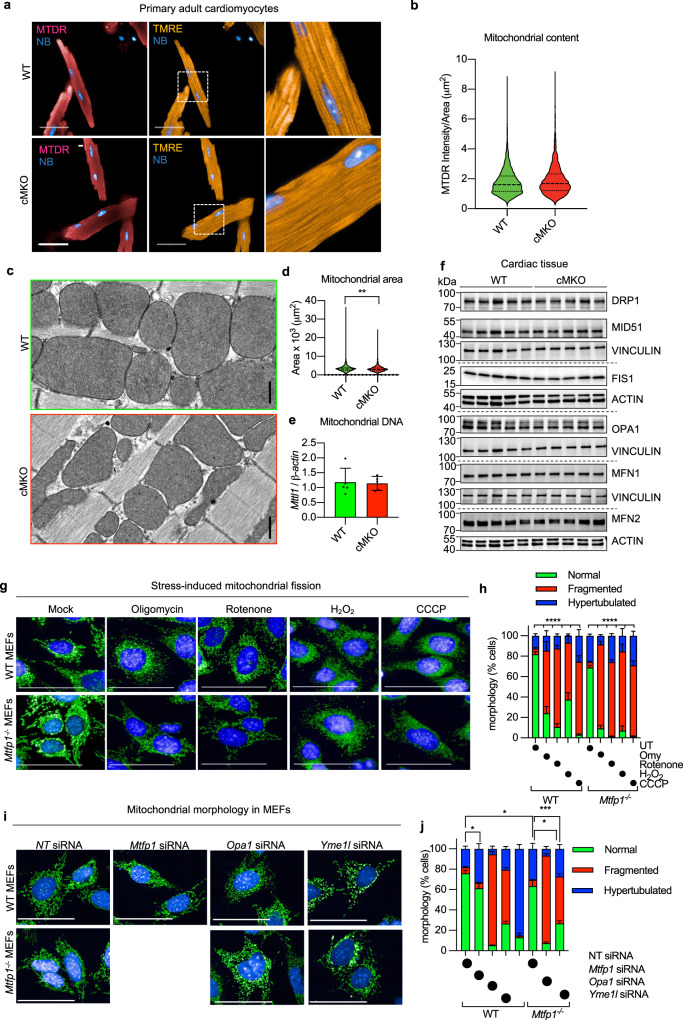
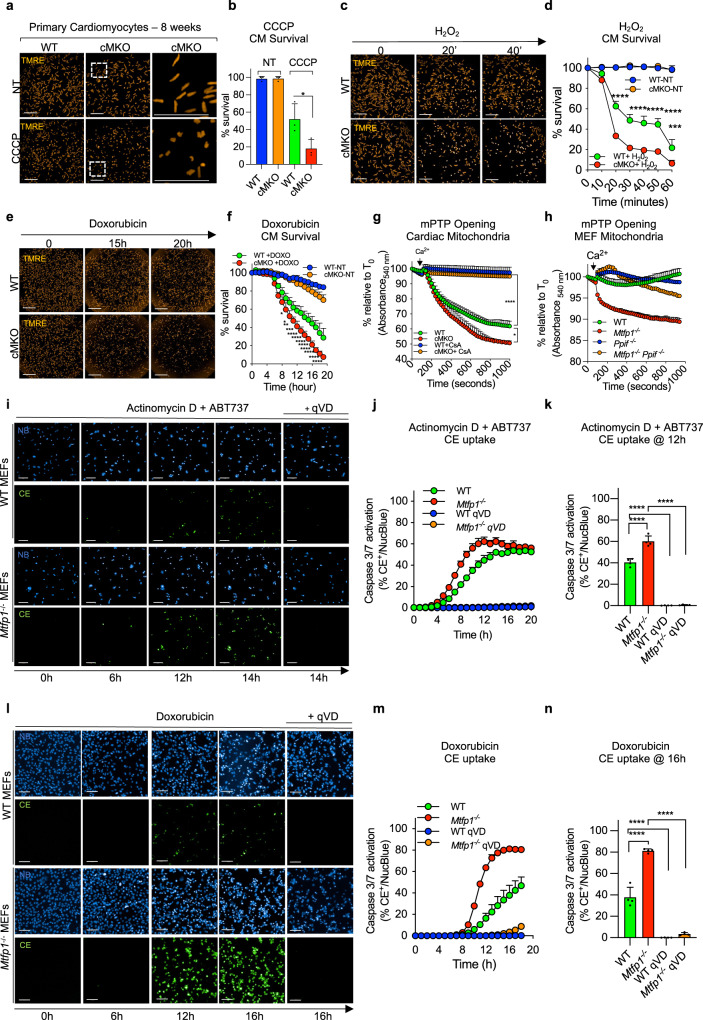
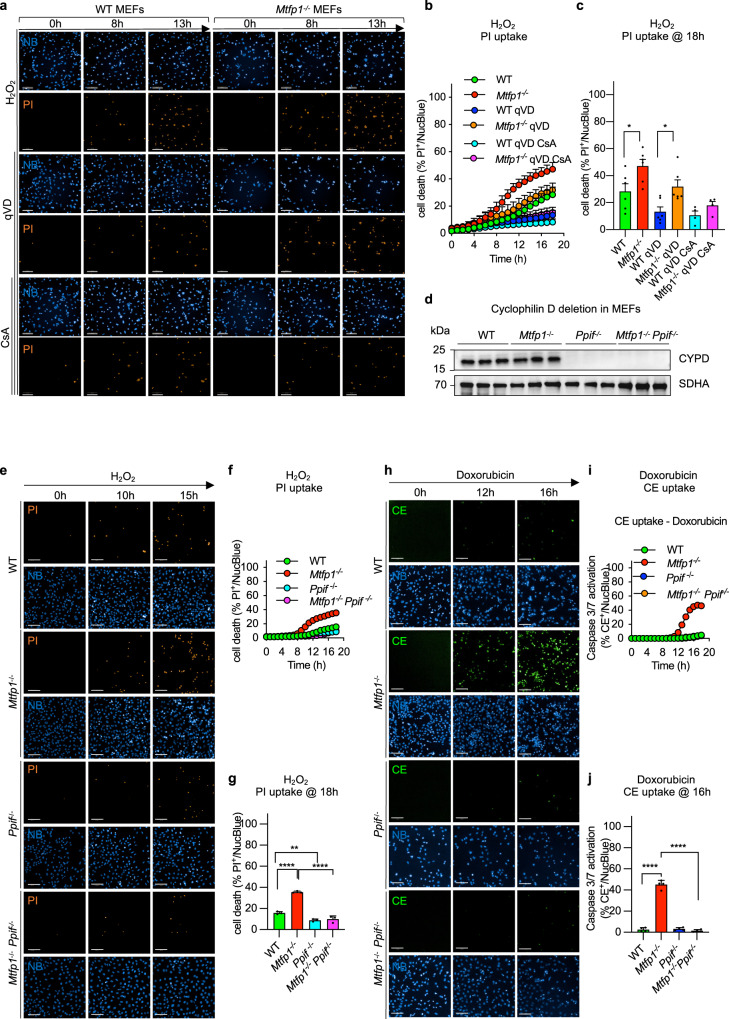
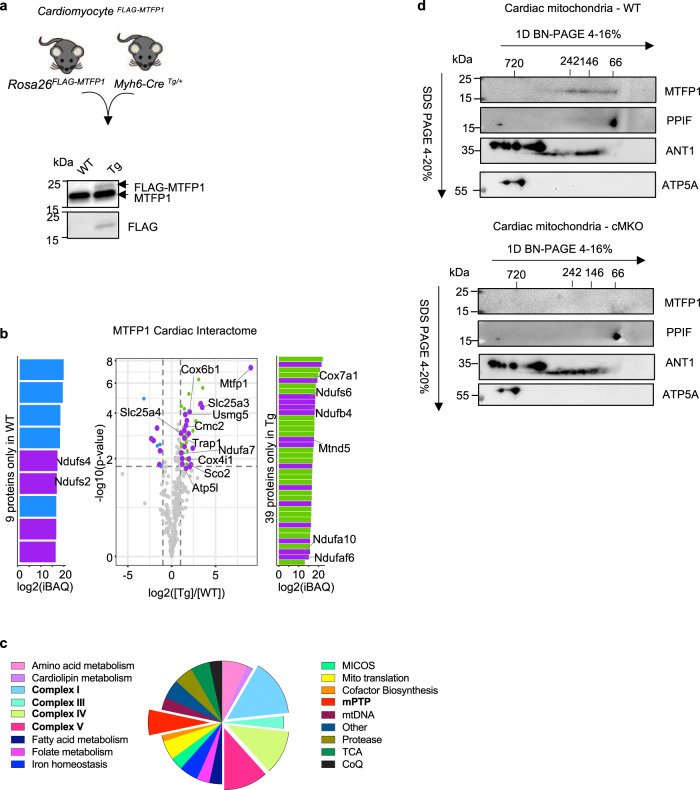
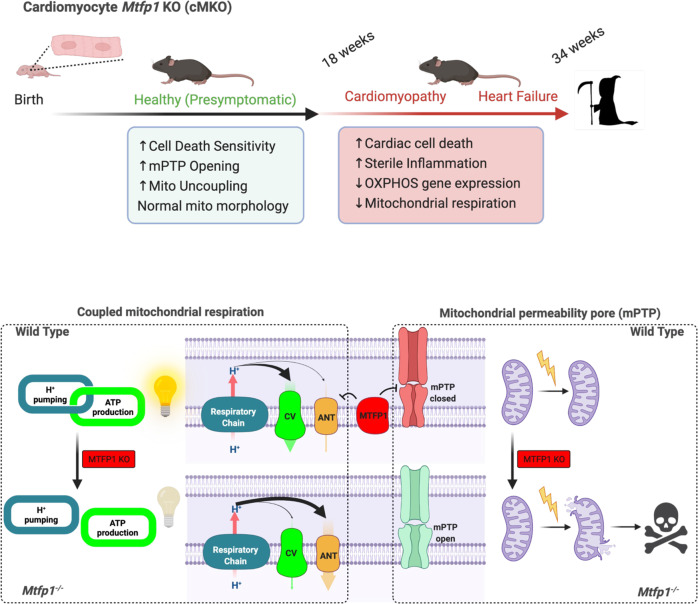
Mitochondria are paramount to the metabolism and survival of cardiomyocytes. Here we show that Mitochondrial Fission Process 1 (MTFP1) is an inner mitochondrial membrane (IMM) protein that is dispensable for mitochondrial division yet essential for cardiac structure and function. Constitutive knockout of cardiomyocyte MTFP1 in mice resulted in a fatal, adult-onset dilated cardiomyopathy accompanied by extensive mitochondrial and cardiac remodeling during the transition to heart failure. Prior to the onset of disease, knockout cardiac mitochondria displayed specific IMM defects: futile proton leak dependent upon the adenine nucleotide translocase and an increased sensitivity to the opening of the mitochondrial permeability transition pore, with which MTFP1 physically and genetically interacts. Collectively, our data reveal new functions of MTFP1 in the control of bioenergetic efficiency and cell death sensitivity and define its importance in preventing pathogenic cardiac remodeling.


Conflict of interest statement

The authors declare no competing interests.

Figures

Fig. 1
Fig. 1. Mtfp1 deletion in cardiomyocytes causes dilated cardiomyopathy and middle-aged death in mice.
a AlphaFold prediction of MTFP1 at the inner mitochondrial membrane (IMM). DRP1 binds to its receptors MFF or MiD49/51 to initiate mitochondrial constriction. IMM fission occurs with mtDNA replication mediated by TFAM and POLG2. S-OPA1 accumulation by OMA1 accelerates fission. Figure created with BioRender. b Generation of a cardiomyocyte-specific Mtfp1 KO (cMKO) mouse model. c Mtfp1 mRNA expression (RNAseq arbitrary units; AU) in heart tissue of WT (n = 5) and cMKO (n = 5) mice at 8 weeks (Supplementary Data 2). Data represent mean ± SD; 2-tailed unpaired Student’s t-test, ****p < 0.0001. d Quantification of immunoblot analysis of cardiac lysates from WT (n = 5) and cMKO (n = 5) male mice at 8 weeks using the indicated antibodies. Data represent mean ± SD; Unpaired t-test, **p < 0.01. e MTFP1 protein expression in cardiac tissue of WT (n = 4) and cMKO (n = 4) at 18 weeks measured by mass spectrometry (MS) (Supplementary Data 1). Data represent mean ± SD; 2-tailed unpaired Student’s t-test, ***p < 0.001. f Kaplan-Meier survival curve of WT (n = 9) and cMKO (n = 15) male mice. Median lifespan of cMKO mice is 26.4 weeks. gl Longitudinal echocardiography of WT and cMKO male mice from 10 to 34 weeks of age. g Representative M-Mode echocardiographic images of left ventricles from WT (left) and cMKO (right) of male mice at 34 weeks. h Left ventricular ejection fraction (% LVEF) i Systolic interventricular septum thickness (IVSs, mm), j Left ventricle posterior wall thickness at systole (LVPWs, mm), k Left ventricle end diastolic diameter (LVDD, mm), l Left ventricle end systolic diameter (LVSD, mm) of WT and cMKO male mice at indicated ages. Data represent mean ± SD; 2way Anova–Sidak’s multiple comparison test: 10 week WT (n = 13) vs cMKO (n = 18); 14 week WT (n = 4) vs. cMKO (n = 6); 18 week WT (n = 4) vs cMKO (n = 7) except for LVEF: WT (n = 10) vs cMKO (n = 13); 22 week WT (n = 4) vs cMKO (n = 6); 30 week WT (n = 3) vs cMKO (n = 7); 34 week WT (n = 4) vs. cMKO (n = 10): *p < 0.05; **p < 0.01; ***p < 0.001; ****p < 0.0001. m Representative histological images of cardiac short axis view of WT (n = 4) and cMKO (n = 4) at 34 weeks. H&E (left), Massons’s Trichrome (middle) and Picrosirius red (right) staining show cardiac remodeling and collagen deposition within the myocardium of cMKO mice. Scale bar 500 µM. n Cardiac troponin-I (cTNI) measured in serum of WT and cMKO male mice at 18 [WT (n = 6) vs cMKO (n = 6)] and 34 weeks [WT (n = 11) vs cMKO (n = 20)]. Data represent mean ± SD; 2-tailed unpaired Student’s t-test at 18 weeks and 34 weeks (w); ***p < 0.001. o Myosin light chain 1 (MLC-1) levels measured in serum of WT and cMKO mice at 18 [WT (n = 5) vs cMKO (n = 6)] and 34 weeks (w) [WT (n = 11) vs cMKO (n = 17)]. Data represent mean ± SD; 2-tailed unpaired Student’s t-test at 18 w and 34 w; **p < 0.01 and ***p < 0.001. p Volcano plots generated from the RNAseq analysis (Supplementary Data 2) of the differentially expressed genes in cardiac tissue of WT and cMKO male mice at 8 (left) and 18 weeks (right). q Numbers of genes up-regulated and down-regulated in cMKO male mice at 8 (blue) and 18 (pink) weeks (w) within the gene ontology (GO) term: metabolic process (left), mitochondrial genes (MitoCarta, middle) and inflammation (right) obtained from RNAseq analysis (Supplementary Data 2). r Expression of indicated profibrotic genes in heart tissue of WT (n = 6) and cMKO (n = 6) male mice at 18 weeks by RNAseq (arbitrary units; AU). Data represent mean ± SD; 2-tailed unpaired Student’s t-test; ***p < 0.001, ****p < 0.0001.
Fig. 2
Fig. 2. Mtfp1 is required for bioenergetic efficiency in cardiac mitochondria.
a Substrates from fatty acid oxidation (mustard) and glycolysis (purple, blue) are metabolized in the TCA cycle which fuels the electron transport chain (ETC) complexes located in the inner mitochondrial membrane by providing NADH and FADH to complexes I (purple) and II (blue), respectively. Complexes I, III and IV extrude protons from matrix into the intermembrane space creating an electrochemical gradient driving the phosphorylation of ADP at the ATP synthase (complex V). The electron flow is limited by the availability of oxygen, a terminal acceptor of electrons at the complex IV (cytochrome oxidase). Uncoupling proteins such as ANT promote a proton leak, playing an important role in regulation of membrane potential and oxidative phosphorylation efficiency. Specific inhibitors of complex I (rotenone), complex V (oligomycin), and ANT (carboxyatractyloside, CATR). Figure created with BioRender. b Oxygen consumption rates (JO2) of cardiac mitochondria from WT (n = 5) and cMKO (n = 5) male mice at 18 weeks measuring complex I driven respiration (left) in presence of pyruvate, malate, glutamate (PGM) and ADP followed by the addition of rotenone and succinate to assess complex II driven respiration (middle) and antimycin A, carbonyl cyanide m-chlorophenyl hydrazine (CCCP), and N,N,N′,N′-Tetramethyl-p-phenylenediamine (TMPD) and ascorbate to measure complex IV driven respiration (right). Data represent mean ± SD; unpaired Student’s t-test, *p < 0.05. c Oxygen consumption rates (JO2) of cardiac mitochondria from WT (n = 4) and cMKO (n = 5) female mice at 34 weeks measuring complex I driven respiration (left) in presence of pyruvate, malate, glutamate (PGM) and ADP followed by the addition of rotenone and succinate to assess complex II driven respiration (middle) and antimycin A, carbonyl cyanide m-chlorophenyl hydrazine (CCCP), and N,N,N′,N′-Tetramethyl-p-phenylenediamine (TMPD) and ascorbate to measure complex IV driven respiration (right). Data represent mean ± SD; unpaired Student’s t-test, *p < 0.05. d Oxygen consumption rates (JO2) of cardiac mitochondria isolated from WT and cMKO female mice between 8–10 weeks (left). Respiration was measured in presence of pyruvate, malate, and glutamate (PGM) (state 2) followed by the addition of ADP (state 3), Oligomycin (Omy- state 4) (WT n = 9, cMKO n = 9) and Carboxyatractyloside (CATR) (WT n = 3, cMKO n = 3). Data represent mean ± SD. Multiple t-test, state 2 ***p < 0.001, state 4 *p < 0.05. Respiratory control ratios (RCR) of state 3:2 (middle: JO2 ADP/PGM) and RCR of state 3:4 (right: JO2 ADP/Omy). Data represent mean ± SD; 2-tailed unpaired Student’s t-test, *p < 0.05, ***p < 0.001. e Mitochondrial membrane potential (ΔΨ) measured by quenching of Rhodamine 123 (RH123) fluorescence in cardiac mitochondria isolated from WT and cMKO female mice between 8-10 weeks. ΔΨ was measured in presence of pyruvate, malate, and glutamate (PGM) (state 2) followed by the addition of ADP (state 3) and Oligomycin (state 4) (WT n = 12, cMKO n = 12) and Carboxyatractyloside (CATR) (WT n = 3, cMKO n = 3). Data represent mean ± SD; Multiple t-test, ***p < 0.001,****p < 0.0001. f Representative BN-PAGE immunoblot analysis of cardiac OXPHOS complexes isolated from WT and cMKO male mice at 8–10 weeks using the indicated antibodies, repeated on biological replicates WT (n = 4) and cMKO (n = 3) samples (see Fig. S2c, left) with similar results. g Equal amounts of protein extracted from WT (n = 5) and cMKO (n = 5) hearts of male mice between 8–10 weeks were separated by SDS–PAGE and immunoblotted with the indicated antibodies and quantified by densitometry using VINCULIN as a loading control. Data represent mean ± SD. h Oxygen consumption rates measured by high-resolution respirometry (left; JO2) and mitochondrial membrane potential (right; ΔΨ) measured by quenching of Rhodamine 123 (RH123) fluorescence in cardiac mitochondria of WT (n = 4) and cMKO (n = 4) female mice between 8-10 week of age. JO2 and ΔΨ were measured in presence of pyruvate, malate, and glutamate (PGM, state 2) followed by the addition of ADP (state 3) and Carboxyatractyloside (CATR) (state 4). Data represent mean ± SD; Multiple t-test, *p < 0.05, ***p < 0.001. i Respiratory control ratio (RCR) of state 3:4 (ADP/CATR) between WT (n = 4) and cMKO (n = 4) calculated from h. Data represent mean ± SD. j Oxygen consumption rates measured by high-resolution respirometry (left; JO2) and mitochondrial membrane potential (right; ΔΨ) measured by quenching of Rhodamine 123 (RH123) fluorescence in cardiac mitochondria of WT and cMKO female mice between 8–10 week of age. JO2 and ΔΨ were measured by adding pyruvate, malate, and glutamate (PGM, state 2) after the pre-treatment (WT n = 3, cMKO n = 3) or not of mitochondria (WT n = 8, cMKO n = 8) with Carboxyatractyloside (CATR). Data represent mean ± SD; Multiple t-test, *p < 0.05, ***p < 0.001. k Oxygen consumption rates measured by high-resolution respirometry (left; JO2) and mitochondrial membrane potential (right; ΔΨ) measured by quenching of Rhodamine 123 (RH123) fluorescence in cardiac mitochondria of WT and cMKO female mice between 8-10 week of age. JO2 and ΔΨ were measured by addition of malate and palmitoyl-carnitine (PC, state 2) after the pre-treatment (WT n = 4, cMKO n = 4) or not (WT n = 6, cMKO n = 6) of mitochondria with Carboxyatractyloside (CATR). Data represent mean ± SD; Multiple t-test, **p < 0.01.
Fig. 3
Fig. 3. MTFP1 is dispensable for mitochondrial fission.
a Representative images of primary adult cardiomyocytes isolated from WT and cMKO female mice at 8 weeks and were labeled with MitoTracker Deep Red (MTDR) and tetramethylrhodamine, ethyl ester (TMRE), and NucBlue (NB). Scale bar = 50 μm. b Violin plot of mitochondrial content (MTDR Intensity/Area) of WT (n = 6085) and cMKO CMs (n = 3647) measured in a. c Representative transmission electron micrographs of cardiac posterior walls of WT (top, n = 3) and cMKO (bottom, n = 3) mice at 8–10 weeks. Scale bar: 500 nm. d Violin plot of mitochondrial surface area (μm2) within cardiac posterior wall measured in c (WT mitochondria n = 659; cMKO mitochondria n = 966). Dotted line represents quartiles and dashed line represents median; **p < 0.01 Mann-Whitney test. e Mitochondrial DNA (mtDNA) content in WT (n = 5) and cMKO (n = 5) heart tissue of male mice quantified by amplification of the mitochondrial Mttl1 gene relative to nuclear gene b-Actin. Data represent mean ± SD. f Immunoblot of mitochondrial fission and fusion proteins measured in cardiac WT and cMKO (8–10 week) extracts immunoblotted with the indicated antibodies (horizontal line denotes different membranes) performed thrice with similar results. VINCULIN or ACTIN are used as loading controls. g Representative images of WT and Mtfp1/ MEFs treated with the fission-inducing drugs: oligomycin (Omy), Rotenone, H2O2 and carbonyl cyanide m-chlorophenyl hydrazine (CCCP). Mitochondria stained with MitoTracker Deep Red (MTDR, green) and nuclei with NucBlue (NB, blue). Scale bar = 100 μm. h Quantification of mitochondrial morphology in g by supervised ML using WT cells with normal (UT), fragmented (CCCP-treated) or hypertubular (cycloheximide-treated) mitochondria as ground truths. Data are means ± SEM of 7–16 independent replicates. 2way-ANOVA, Dunnet’s multiple comparison test: % fragmentation ****p < 0.0001 treatment versus WT UT or Mtfp1/ UT. i Representative confocal images of WT and Mtfp1/ MEFs treated with indicated siRNAs (20 nM) for 72 h and labeled with MitoTracker Deep Red (MTDR, green) and NucBlue (NB, blue). Scale bar = 100 μm. j Quantification of mitochondrial morphology in i by supervised machine learning (ML) using WT cells with normal (non-targeting NT siRNA), fragmented (Opa1 siRNA) or hypertubular (Dnm1l siRNA) mitochondria as ground truths. Data are means ± SEM of 2–8 individually plated wells measured in parallel. 2way-ANOVA, Dunnet’s multiple comparison test: % hypertubular *p < 0.05; ***p < 0.001 versus WT NT siRNA; % fragmented ****p < 0.0001 versus Mtfp1/ NT siRNA.
Fig. 4
Fig. 4. MTFP1 protects against mitochondrial PTP opening and cell death.
a Representative confocal images of adult cardiomyocytes (CMs) isolated from WT and cMKO female mice at 8 weeks stained with tetramethylrhodamine ethyl ester (TMRE) treated with or without cyanide m-chlorophenyl hydrazine treatment (CCCP) for 15 min. Rod-shaped CMs: live cells, round-shaped CMs: dead cells. Scale bar: 500 μm. b Quantification of number of live cells (% survival) in a by supervised machine learning. Data are means ± SD of n = 3 independent experiments. Unpaired Student’s t-test; *p < 0.05. c Representative confocal images of adult cardiomyocytes (CMs) isolated from WT and cMKO female mice at 8 weeks stained with tetramethylrhodamine ethyl ester (TMRE) and subjected to H2O2 treatment for 1 h. Rod-shaped CMs: live cells, round-shaped CMs: dead cells. Scale bar: 500 μm. d Quantification of number of live cells (% survival) over time measured in c by supervised machine learning. Data are means ± SD of 2–3 culture replicates and representative of n = 3 experiments. 2wayANOVA, Tukey’s multiple comparison test, ***p < 0.001, ****p < 0.0001 vs WT H2O2. e Representative confocal images of adult cardiomyocytes (CMs) isolated from WT and cMKO female mice at 8 weeks stained with tetramethylrhodamine ethyl ester (TMRE) and subjected to Doxorubicin (DOXO) treatment. Scale bar: 500 μm. f Quantification of number of live cells (% survival) in e by supervised machine learning. Data are means ± SD of 2–3 culture replicates and representative of n = 3 experiments. 2wayANOVA, Tukey’s multiple comparison test, *p < 0.05, **p < 0.01, ***p < 0.001, ****p < 0.0001 vs WT DOXO. Scale bar: 1 mm. g Mitochondrial swelling assay performed on cardiac mitochondria extracted from hearts of WT (n = 3) and cMKO (n = 3) female mice at 8–10 weeks. Relative absorbance at 540 nm was measured every 20 s before and after addition of a single pulse of CaCl2 (arrowhead) in presence or absence of Cyclosporin A (CsA). Data are means ± SD of n = 3 biological replicates. One-way ANOVA of maximal absorbance 540 nm (% relative to T0) change, *p < 0.05, ****p < 0.0001. h Mitochondrial swelling assay performed on mitochondria isolated from WT and Mtfp1−/−, Ppif−/−, and Mtfp1−/−Ppif−/− MEFs. Mitochondrial absorbance changes (absorbance 540 nm, % relative to T0) are measured every 30 s prior and after addition of a single pulse of CaCl2 (arrowhead) in presence or absence of Cyclosporin A (CsA). Data are means ± SD of n = 3 (WT, Mtfp1−/−) and n = 2 (WT, Mtfp1−/−+ CsA) technical replicates. i Representative confocal images of WT and Mtfp1−/− MEFs subjected to actinomycin D (ActD) plus ABT-737 treatment in the presence or absence of the pan-caspase inhibitor q-VD-OPh hydrate (qVD). Live induction of the caspase 3/7 activation was monitored by using the CellEvent (CE, green) reagent and imaging cells every hour (h) for 20 h. Scale bar = 100 μm. j Kinetics of caspase 3/7 activation was determined by counting the number of CE+ positive cells (green) over total number cells nuclear stained with NucBlue (NB, blue) and expressed as % CE+/NucBlue. Data are means ± SD of n = 4 independent experiments. k one-way ANOVA of j at 12 h, ****p < 0.0001. l Representative confocal images of WT and Mtfp1−/− MEFs subjected to doxorubicin treatment in the presence or absence of the pan-caspase inhibitor q-VD-OPh hydrate (qVD). Live induction of the caspase 3/7 activation was monitored by using the CellEvent (CE, green) reagent and imaging cells every hour (h) for 18 h. Scale bar = 100 μm. m Kinetics of caspase 3/7 activation was determined by counting the number of CE+ positive cells (green) over total number cells nuclear stained with NucBlue (NB, blue) and expressed as % CE+/NucBlue. Data are means ± SD and representative of at least n = 3 independent experiments. n one-way ANOVA of m at 16 h, ****p < 0.0001.
Fig. 5
Fig. 5. mPTP accounts for cell death sensitivity in MTFP1 deficient cells.
a Representative confocal images of WT and Mtfp1−/− MEFs subjected to H2O2 treatment. The pan-caspase and cyclophilin D inhibitors, q-VD-OPh hydrate (qVD) and cyclosporin A (CsA) respectively, were used to block both caspase and mPTP dependent cell death. Cell death was monitored by Propidium Iodide uptake (PI, orange) and imaging cells every hour (h) for 18 h. Scale bar = 100 μm. b Kinetics of PI uptake was determined by counting the number of PI+ positive cells (orange) over total number cells nuclear stained with NucBlue (NB, blue) and expressed as % PI+/NucBlue. Data are means ± SD of n = 6 independent experiments. c one-way ANOVA of b at 18 h, *p < 0.05. d Validation of Cyclophilin D (CYPD) ablation by Crispr/Cas9 genome editing of Ppif in WT and Mtfp1−/− MEFs. Equal amounts of protein extracted from WT, Mtfp1−/−, Ppif−/−, Mtfp1−/− Ppif−/− MEFs (n = 3) were separated by SDS–PAGE and immunoblotted with the indicated antibodies. SDHA was used as mitochondrial marker and loading control. e Representative confocal images of WT, Mtfp1−/−, Ppif−/−, Mtfp1−/− Ppif−/− MEFs subjected to H2O2 treatment. Cell death was monitored by Propidium Iodide uptake (PI, orange) and imaging cells every hour (h) for 18 h. Scale bar = 100 μm. f Kinetics of PI uptake was determined by counting the number of PI+ positive cells (orange) over total number cells nuclear stained with NucBlue (NB, blue) and expressed as % PI+/NucBlue. Data are means ± SD of n = 3 independent experiments. g one-way ANOVA of f at 18 h; **p < 0.01, ****p < 0.0001. h Representative confocal images of WT, Mtfp1−/−, Ppif−/−, Mtfp1−/− Ppif−/− MEFs subjected to doxorubicin (DOXO) treatment. Live induction of the caspase 3/7 activation was monitored by using the CellEvent (CE, green). CellEvent positive cells (CE+, green) over total number cells NucBlue labeled (blue) were imaged every hour (h) for 18 h. Scale bar = 100 μm. i Kinetics of caspase 3/7 activation was determined by counting the number of CE+ positive cells (green) over total number cells nuclear stained with NucBlue (NB, blue) and expressed as % CE+/NucBlue. Data are means ± SD and representative of n = 3 independent experiments. j one-way ANOVA of i at 16 h, ****p < 0.0001.
Fig. 6
Fig. 6. MTFP1 interacts with components of the mPTP complex.
a Representative immunoblot of the expression of FLAG-MTFP1 compared to endogenous MTFP1 levels in transgenic (Tg) CardiomyocyeFLAG-MTFP1 mice constitutively expressing FLAG-MTFP1 in cardiomyocytes. Similar results were obtained with n = 4 biological replicates. b Volcano plot of the FLAG-MTFP1 interactome analyzed by mass spectrometry. (Purple) Mitochondrial proteins exclusively present in FLAG-MTFP1 eluates or significantly enriched greater than two-fold, listed in Supplementary Data 3. (Green) Non-mitochondrial proteins significantly more abundant in Tg heart. (Blue) Non-mitochondrial proteins significantly more abundant in WT heart. c Functional classification of 60 mitochondrial proteins identified in Co-IP eluates in b (Supplementary Data 3). d Second-dimension electrophoresis (2D BN-PAGE) of the cardiac OXPHOS complexes isolated from WT (top) and cMKO (bottom) mice at 8–10 weeks and previously separated in a BN-PAGE. Detection of components of the mPTP complex was performed using the indicated antibodies.
Fig. 7
Fig. 7. Model for the regulation of mitochondrial and cardiac function by MTFP1.
(Top) Mtfp1 deletion in cardiomyocytes occurs at birth (cMKO) and sensitizes cardiac myocytes to mitochondrial permeability transition pore (mPTP) opening, cell death and increases mitochondria uncoupling of the inner membrane. At the adult age of 8–10 weeks heart of cMKO mice have normal structure and function but undergoes to the development of a progressive dilated cardiomyopathy (DCM) at 18 weeks which progresses to severe heart failure and middle-aged death by 34 weeks. At onset of DCM, cMKO mice exhibit increased cardiac cell death, reduced mitochondrial respiration, and induction of a sterile inflammatory response. (Bottom) Coupled respiration and mPTP closure is maintained by MTFP1. Genetic deletion of Mtfp1 promotes the ANT-dependent uncoupling of mitochondrial respiration and opening of the mPTP, sensitizing cells to programmed cell death. Figure created with BioRender.

References

    1. Kolwicz SC, Jr, Purohit S, Tian R. Cardiac metabolism and its interactions with contraction, growth, and survival of cardiomyocytes. Circ. Res. 2013;113:603–616. - PMC - PubMed
    1. Chance, B. & Williams, G. R. The respiratory chain and oxidative phosphorylation. in Advances in Enzymology and Related Areas of Molecular Biology 65–134 (John Wiley & Sons, Ltd, 1956). - PubMed
    1. Mitchell P. Coupling of phosphorylation to electron and hydrogen transfer by a chemi-osmotic type of mechanism. Nature. 1961;191:144–148. - PubMed
    1. Kohlhaas M, Nickel AG, Maack C. Mitochondrial energetics and calcium coupling in the heart. J. Physiol. 2017;595:3753–3763. - PMC - PubMed
    1. Antonicka H, et al. Mutations in COX10 result in a defect in mitochondrial heme A biosynthesis and account for multiple, early-onset clinical phenotypes associated with isolated COX deficiency. Hum. Mol. Genet. 2003;12:2693–2702. - PubMed

Publication types

MeSH terms

Substances

LinkOut - more resources