. 2022 Nov 4;13(1):6664.
doi: 10.1038/s41467-022-34349-8.

Pathogenic variants in SLF2 and SMC5 cause segmented chromosomes and mosaic variegated hyperploidy

Affiliations

Pathogenic variants in SLF2 and SMC5 cause segmented chromosomes and mosaic variegated hyperploidy

Laura J Grange et al. Nat Commun. .

Abstract

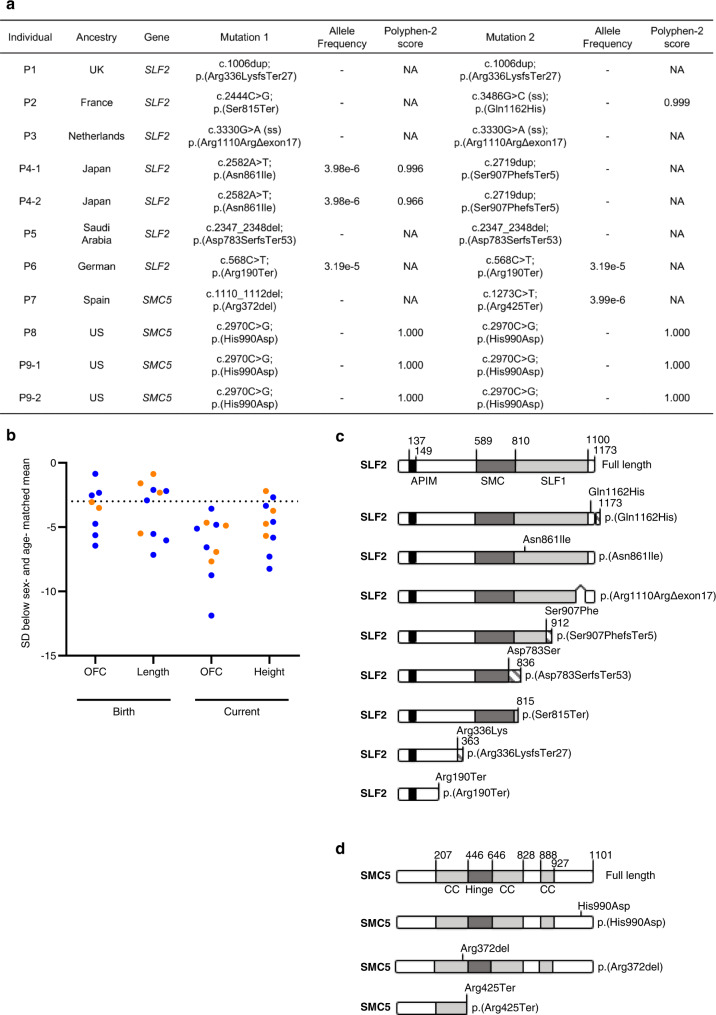
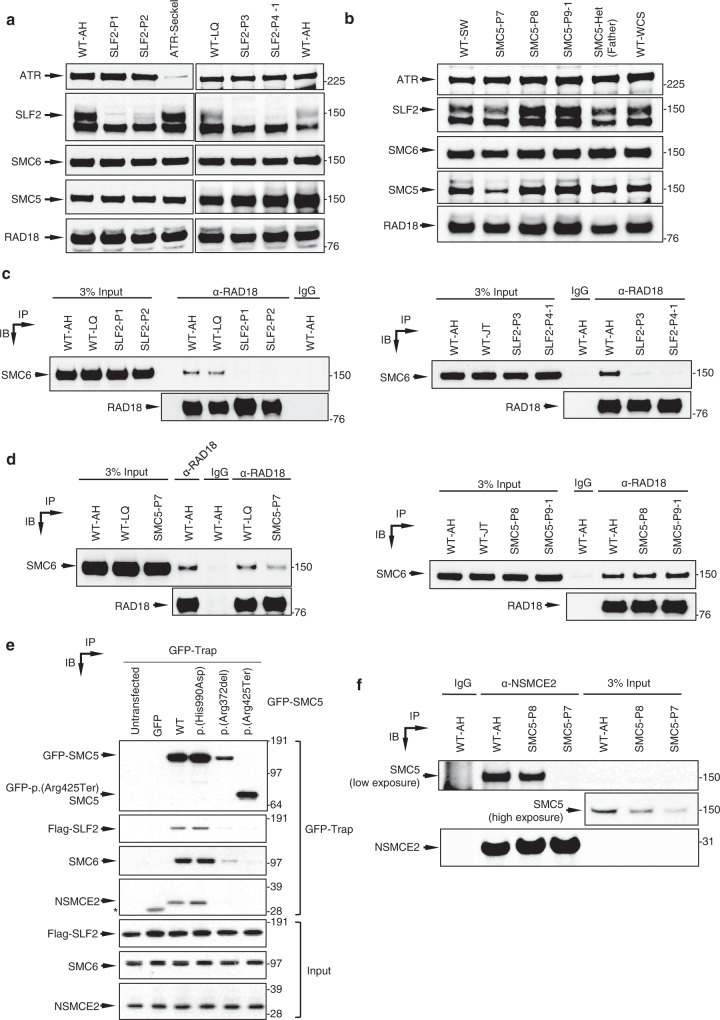
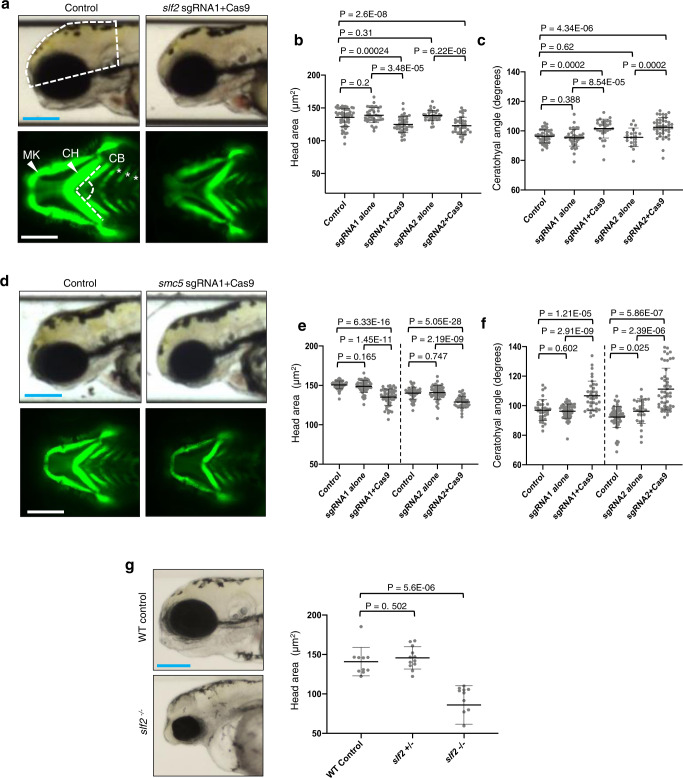
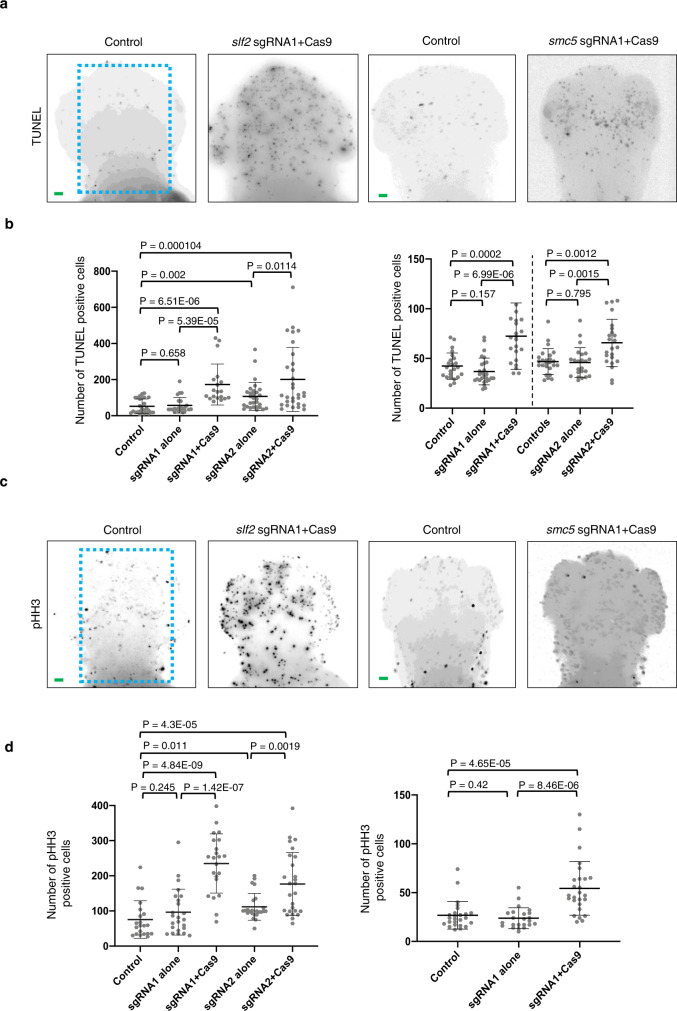
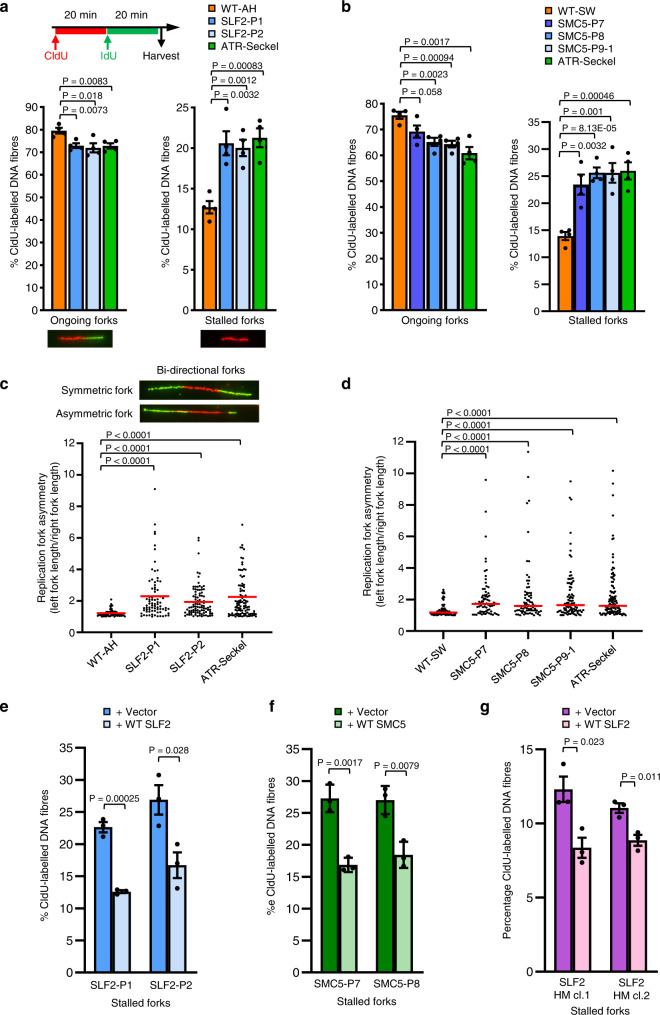
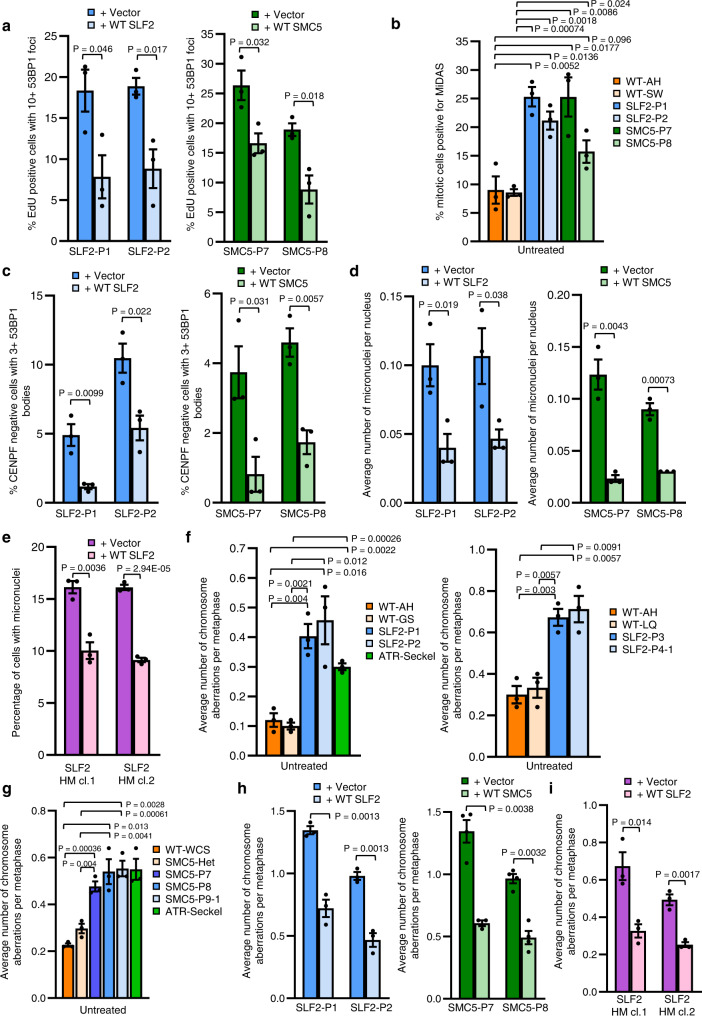
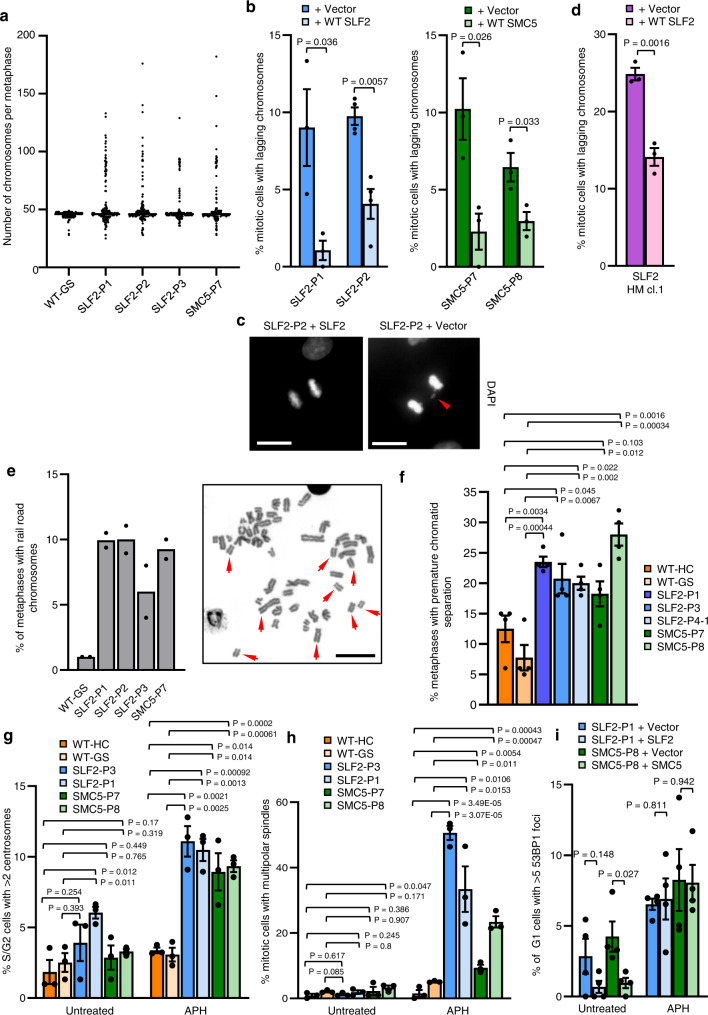
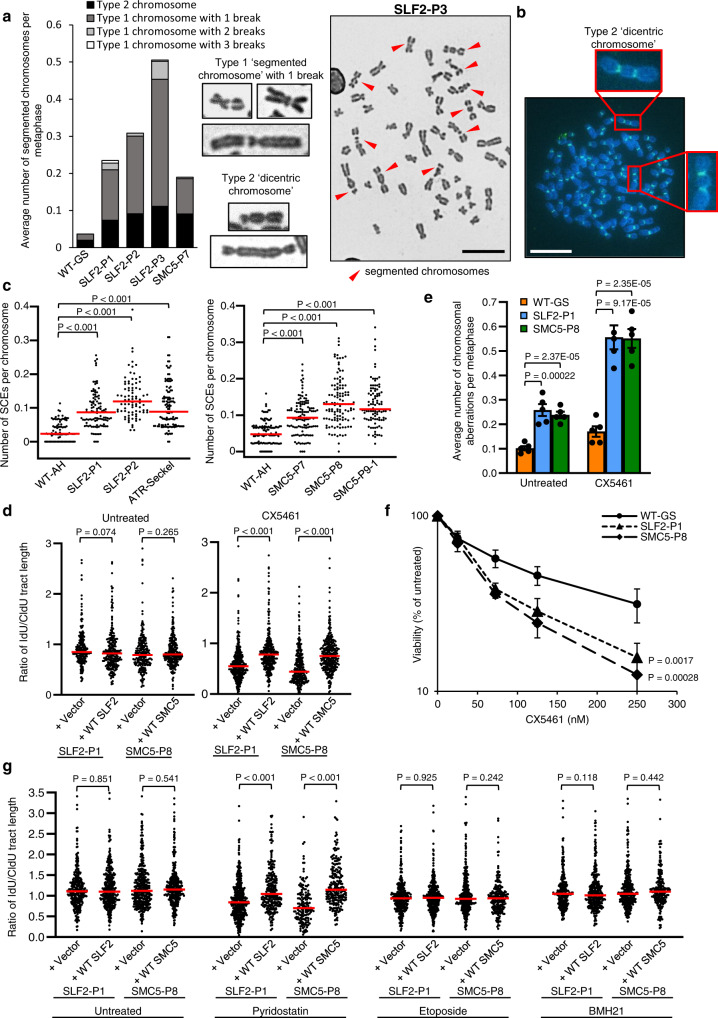
Embryonic development is dictated by tight regulation of DNA replication, cell division and differentiation. Mutations in DNA repair and replication genes disrupt this equilibrium, giving rise to neurodevelopmental disease characterized by microcephaly, short stature and chromosomal breakage. Here, we identify biallelic variants in two components of the RAD18-SLF1/2-SMC5/6 genome stability pathway, SLF2 and SMC5, in 11 patients with microcephaly, short stature, cardiac abnormalities and anemia. Patient-derived cells exhibit a unique chromosomal instability phenotype consisting of segmented and dicentric chromosomes with mosaic variegated hyperploidy. To signify the importance of these segmented chromosomes, we have named this disorder Atelís (meaning - incomplete) Syndrome. Analysis of Atelís Syndrome cells reveals elevated levels of replication stress, partly due to a reduced ability to replicate through G-quadruplex DNA structures, and also loss of sister chromatid cohesion. Together, these data strengthen the functional link between SLF2 and the SMC5/6 complex, highlighting a distinct role for this pathway in maintaining genome stability.


Conflict of interest statement

The authors declare no competing interests.

Figures

Fig. 1
Fig. 1. SLF2 and SMC5 variants cause severe microcephaly and short stature.
a Table listing biallelic SLF2 and SMC5 variants in 11 individuals. ss, splice site created or destroyed by variant. ‘−’ denotes that the allele variant was not present in the gnomAD database. Scores predicting the pathogenicity of the identified missense variants in SLF2 and SMC5 were generated using Polyphen-2 (http://genetics.bwh.harvard.edu/pph2/). NA Not applicable. b Length and head circumference (occipital frontal circumference; OFC) at birth and at the age of last exam as z-scores (s.d. from population mean for age and sex; SD). Dashed line at −3 SD indicates cut-off for normal population distribution. Orange values indicate SMC5 patients and blue values indicate SLF2 patients. c Schematic of full length WT SLF2 protein and SLF2 patient variants. APIM, atypical PCNA binding motif. SMC, SMC5/6 binding region. SLF1, SLF1 binding region. d Schematic of full length WT SMC5 protein and SMC5 patient variants. CC coiled-coil region.
Fig. 2
Fig. 2. Impact of patient-associated variants on the stability of SLF2 and SMC5 protein and the integrity of the SMC5/6 complex.
a Representative immunoblot analysis of cell extracts from lymphoblastoid (LCL) cell lines derived from patients with variants in SLF2. WT-AH and WT-LQ (WT wild type) indicate unrelated heathy individuals. b Representative immunoblot analysis of cell extracts from LCLs derived from patients with variants in SMC5. WT-SW and WT-WCS indicate unrelated heathy individuals. c, d Whole-cell extracts prepared from WT cell lines, SLF2 patient LCLs (c) or SMC5 patient LCLs (d) were subjected to immunoprecipitation with the indicated antibodies, and inputs and immunoprecipitates (IP) were analysed by immunoblotting (IB). e U-2 OS cells expressing Flag-SLF2 were transfected with WT or mutant GFP-SMC5. GFP-SMC5 was precipitated from cell extracts using GFP-Trap beads and co-precipitated proteins were detected using immunoblotting with the indicated antibodies. *represents a cross-reaction of the NSMCE2 antibody to GFP. f Whole-cell extracts prepared from WT cell lines or SMC5 patient LCLs were subjected to immunoprecipitation with the indicated antibody, and inputs and immunoprecipitates were analysed by immunoblotting. Immunoblotting and immunoprecipitation experiments in (a, b, c, d, f) are representative of two independent experiments with similar results. Panel e is representative of three independent experiments with similar results.
Fig. 3
Fig. 3. Loss of slf2 and smc5 in zebrafish give rise to microcephaly and aberrant craniofacial patterning.
a Top: Representative lateral bright field images acquired at 3 days post-fertilization (dpf); white dashed shape depicts head size measured. Bottom: Representative ventral images of GFP signal from the anterior region of −1.4col1a1:egfp transgenic reporter larvae at 3 dpf. The white dashed lines show the ceratohyal angle. b Quantification of lateral head size measurements. Larvae were injected with two independent sgRNAs targeting slf2 with or without Cas9; n = 3 independent experiments (left to right; 56, 37, 37, 36, 36 larvae/batch). c Quantification of the ceratohyal angle. Larvae were injected with two independent slf2 sgRNAs: n = 3 independent experiments (left to right; 39, 42, 30, 20, 44 larvae/batch). d Top: Representative lateral bright field images at 3 dpf. Bottom: Representative ventral images of GFP signal in the anterior region of −1.4col1a1:egfp smc5 sgRNA1 transgenic larvae at 3 dpf. e Quantification of lateral head size measurements in 3 dpf larvae (as shown in panel  a); n = 3 independent experiments (left to right; 50, 50, 52, 46, 53, 38 larvae/batch). The chart shows two independent experiments for sgRNA1 and sgRNA2 with a vertical line grouping independent controls with test conditions. f Quantification of the ceratohyal angle. Larvae were injected with two independent smc5 sgRNAs: n = 3 independent experiments (left to right; 34, 53, 37, 62, 28, 48 larvae/batch). The chart shows two independent experiments for sgRNA1 and sgRNA2 with a vertical line grouping independent controls with test conditions. g Left: Representative lateral bright field images of WT control and slf2/ mutants at 3 dpf. Right: Quantification of lateral head size measurements in 3 dpf WT control and slf2/ mutant larvae (as shown in a); n = 3 independent experiments (left to right; 10, 12, 12 larvae/batch). In (a, b): (top left) white dashed shape depicts head size measured; (bottom left) white dashed lines show the ceratohyal angle measured. MK Meckel’s cartilage, CH ceratohyal cartilage (indicated with arrowheads, respectively), and CB ceratobranchial arches (asterisks). Scale bars represent 300 μm, with equivalent sizing across panels. Error bars represent standard deviation of the mean. Statistical differences were determined with an unpaired Student’s t test (two sided).
Fig. 4
Fig. 4. Loss of slf2 and smc5 induces apoptosis and altered cell cycle progression in zebrafish larvae.
a Representative dorsal inverted fluorescent images showing TUNEL positive cells in control and slf2 F0 mutants at 2 dpf (left two panels), and control and smc5 F0 mutants at 3 dpf (right two panels). The blue dashed line indicates the region of interest (ROI) quantified. Embryos of the same developmental stage and similar magnification were evaluated for all slf2 and smc5 conditions. b Left: Quantification of TUNEL positive cells in the ROI of control and slf2 F0 mutants at 2 dpf shown in panel a (left to right; 27, 23, 19, 29, 30 embryos/condition were analysed from 3 independent experiments). Right: Quantification of TUNEL positive cells in control and smc5 F0 mutants at 3 dpf in the ROI as shown in panel a (left to right; 37, 27, 22, 25, 23, 23 embryos/condition were analysed from 3 independent experiments). The chart shows two independent experiments for sgRNA1 and sgRNA2 with a vertical line grouping independent controls with test conditions. c Representative dorsal inverted fluorescent images showing phospho-histone H3 (pHH3) positive cells in control and slf2 F0 mutants at 2 dpf (left two panels), and control and slf2 F0 mutants at 3 dpf (right two panels). Embryos of the same developmental stage and similar magnification were evaluated for all slf2 and smc5 conditions. d Left: Quantification of pHH3 positive cells of control and slf2 F0 mutants at 2 dpf in the ROI as shown in panel a (left to right; 21, 24, 22, 24, 26 embryos/condition were analysed from 3 independent experiments). Right: Quantification of pHH3 positive cells in the ROI in control and smc5 F0 mutants at 3 dpf as shown in panel a (left to right; 25, 23, 26 embryos/condition were analysed from 3 independent experiments). For all panels: Statistical differences were determined with an unpaired Student’s t test (two sided). Error bars represent standard deviation of the mean. Scale bars, 30 µm with equivalent sizing across panels.
Fig. 5
Fig. 5. Patient-derived cell lines from individuals with biallelic SLF2 or SMC5 variants exhibit increased levels of spontaneous replication fork instability.
a Top: Schematic representation for DNA fiber analysis in untreated cells. The indicated cell lines were pulse-labeled with CldU for 20 min, then pulse-labeled with IdU for 20 min. Bottom: DNA fiber analysis of SLF2 patient-derived LCLs or LCLs from a WT individual. The percentage of ongoing forks (left) or stalled forks (right) was quantified. n = 4 independent experiments. A minimum of 1500 fork structures were counted. b DNA fiber analysis of SMC5 patient-derived LCLs or WT LCLs. Quantification of the levels of ongoing forks (left) or stalled forks (right). n = 4 independent experiments. A minimum of 750 fork structures were counted. c, d Quantification of replication fork asymmetry of WT, SLF2 patient (c) or SMC5 patient LCLs (d). n = 4 independent experiments. A minimum of 75 fork structures were counted. Red lines denote median values. A Mann-Whitney rank sum test was performed for statistical analysis. Replication fork asymmetry represents the ratio of the left to right fork-track lengths of bidirectional replication forks. e, f DNA fiber analysis of SLF2 (e) and SMC5 (f) mutant fibroblast cell lines infected with lentiviruses encoding WT SLF2, WT SMC5, or an empty vector. The percentage of ongoing forks (left) or stalled forks (right) in untreated cells was quantified. A minimum of 350 fork structures in total were counted over 3 independent experiments. g DNA fiber analysis of U-2-OS SLF2 CRISPR hypomorphic (HM) cells infected with lentiviruses encoding WT SLF2 or an empty vector. The percentage of stalled forks in untreated cells was quantified. A minimum of 1000 fork structures in total were counted over 3 independent experiments. For (a, b, e, f, g); a Student’s t test (two-sided, equal variance) was performed for statistical analysis and error bars denote SEM.
Fig. 6
Fig. 6. SLF2 and SMC5 patient cells exhibit S-phase associated DNA damage.
a Percentage of cells positive for EdU staining with >10 53BP1 foci in SLF2 and SMC5 mutant fibroblast cell lines infected with lentiviruses encoding WT SLF2, WT SMC5, or an empty vector. A minimum of 900 EdU positive cells across 3 independent experiments were counted. b SLF2 and SMC5 patient fibroblast cell lines were pulsed with 10 μM EdU for 45 min, fixed, and mitotic DNA synthesis was visualized by mitotic EdU incorporation following labeling with click chemistry. The percentage of mitotic cells with EdU foci was quantified. A minimum of 300 mitotic cells were counted. n = 3 independent experiments. c Immunofluorescent microscopy analysis to quantify the percentage of G1-phase cells (CENPF negative cells) with >3 53BP1 bodies in WT SLF2, WT SMC5, or an empty vector expressing SLF2 and SMC5 patient fibroblasts. n = 3 independent experiments. A minimum of 750 G1-phase cells were counted. d Levels of micronuclei in cells from (c). n = 3 independent experiments. A minimum of 2500 cells were counted. e Levels of micronuclei in U-2 OS SLF2 CRISPR HM cells infected with lentiviruses encoding WT SLF2 or an empty vector. n = 3 independent experiments. A minimum of 1700 cells were counted. f, g Quantification of the average number of chromosomal aberrations per metaphase (which includes chromatid/chromosome gaps, breaks, fragments and chromosomes radials) in WT, SLF2 patient (f), or SMC5 patient LCLs (g). n = 3 independent experiments. A minimum of 140 metaphases were counted. h Average number of chromosomal aberrations per metaphase (chromatid/chromosome gaps, breaks, fragments and chromosome radials) in SLF2 and SMC5 mutant fibroblast cell lines infected with lentiviruses encoding WT SLF2, WT SMC5, or an empty vector was quantified. n = 3 independent experiments. A minimum of 90 metaphases were counted. i Average number of chromosomal aberrations (chromatid/chromosome gaps, breaks, fragments and chromosome radials) per metaphase in U-2 OS SLF2 CRISPR HM cell lines expressing either WT SLF2 or an empty vector. n = 3 independent experiments. A minimum of 100 metaphases were counted. In all cases, a Student’s t test (two-sided, equal variance) was performed for statistical analysis and error bars denote SEM.
Fig. 7
Fig. 7. SLF2 and SMC5 patient cells exhibit mosaic variegated hyperploidy, mitotic abnormalities and sister chromatid cohesion defects.
a Quantification of the numbers of chromosomes per metaphase in peripheral blood lymphocytes from SLF2 or SMC5 patients, or an unrelated WT individual. 200 metaphases were counted in total from 2 independent blood samples. b Average number of mitotic cells with mis-segregated lagging chromosomes in SLF2 and SMC5 mutant fibroblast cell lines infected with lentiviruses encoding WT SLF2, WT SMC5, or an empty vector. n = 3 independent experiments for SLF2-P1, SMC5-P7 and SMC5-P8, and n = 4 independent experiments for SLF2-P2. A minimum of 250 mitotic cells were counted. c Representative images of mitotic cells from (b) with lagging chromosomes (scale bar: 10 µM). d Average number of mitotic cells with mis-segregated lagging chromosomes in U-2 OS SLF2 CRISPR HM cells infected with lentiviruses encoding WT SLF2 or an empty vector. n = 3 independent experiments. A minimum of 190 mitotic cells were counted. e Left: percentage of metaphases with rail-road chromosomes in peripheral blood lymphocytes from SLF2 or SMC5 patients, or an unrelated WT individual. A minimum of 380 metaphases were counted in total from 2 independent blood samples. Right: Representative images of metaphases (scale bar: 10 µM). f Percentage of metaphases with premature chromatid separation following 4 h treatment with 25 μM MG132 in SLF2 and SMC5 patient LCLs. n = 4 independent experiments. 200 total metaphases were counted. g Percentage of S/G2 cells (CENPF positive cells) with >2 centrosomes with or without 24 h exposure to 250 nM APH. n = 3 independent experiments. A minimum of 900 CENPF positive cells were counted. h Percentage of mitotic cells in SLF2 and SMC5 mutant LCLs with multi-polar spindles in untreated cells and cells exposed to 250 nM APH for 24 h. A minimum of 300 mitotic cells were counted over 3 independent experiments. i The percentage of G1-phase cells (CENPF negative cells) with >5 53BP1 bodies in SLF2 and SMC5 mutant fibroblast cell lines, with or without 24 h exposure to 500 nM APH. n = 4 independent experiments. A minimum of 390 G1-phase cells were counted. In all cases, a Student’s t test (two-sided, equal variance) statistical test was performed and error bars denote SEM.
Fig. 8
Fig. 8. Variants in the RAD18-SLF1/2-SMC5/6 complex compromise the ability of cells to replicate in the presence of stabilized G4 quadruplex structures.
a Left: Average number of segmented chromosomes per metaphase in peripheral blood lymphocytes (PBLs) from SLF2 or SMC5 patients, or an unrelated WT individual. 250 total metaphases were counted from 2 independent blood samples. Middle: Representative images of ‘type 1’ and ‘type 2’ segmented chromosomes. Right: Representative image of a metaphase exhibiting segmented chromosomes from SLF2-P3 PBLs (scale bar: 10 µM). b Representative image of FISH with a centromere-specific probe showing dicentric chromosomes in a metaphase prepared from SLF2-P3 PBLs (scale bar: 10 µM). c Average number of sister chromatid exchanges in metaphase spreads from SLF2 and SMC5 patient-derived LCLs. n = 3 independent experiments. A minimum of 100 metaphases were counted. d Quantification of the IdU:CldU track length ratio in untreated and CX451-treated SLF2 and SMC5 patient fibroblast cells. Cell lines were pulse-labeled first with CldU for 30 min, followed by IdU, with or without 250 nM CX5461, for 30 min. n = 3 independent experiments. A minimum of 250 ongoing fork structures were counted. e Average number of chromosomal aberrations (chromatid/chromosome gaps, breaks, fragments and chromosome radials) per metaphase in SLF2 and SMC5 patient-derived LCLs with and without 24 h exposure to 250 nM CX5461. n = 5 independent experiments. A minimum of 350 metaphases were counted. Student’s t test (two-sided, equal variance) was performed. Error bars denote SEM. f LCL proliferation assay. WT and SLF2 and SMC5 patient-derived LCLs were cultured in increasing concentrations of CX5461 for the time untreated cells took to undergo three population doublings. Cell viability following CX5461 treatment was calculated as a percentage of the number of untreated cells. n = 4 independent experiments. Error bars denote SEM. A two-way ANOVA statistical test was performed. g Quantification of IdU:CldU track length ratio in untreated, pyridostatin-, etoposide- and BMH21-treated SLF2 and SMC5 mutant fibroblast cells. Cell lines were pulse-labeled first with CldU for 30 min, followed by IdU with or without 1µM pyridostatin, 50 nM etoposide or 1 µM BMH21, for 30 min. n = 3 independent experiments. A minimum of 150 ongoing forks were counted. For (c, d, g), red lines denote median values, and a Mann-Whitney rank sum statistical test was performed.

References

    1. Alcantara D, O’Driscoll M. Congenital microcephaly. Am. J. Med. Genet C. Semin. Med. Genet. 2014;166C:124–139. - PubMed
    1. O’Driscoll M. The pathological consequences of impaired genome integrity in humans; disorders of the DNA replication machinery. J. Pathol. 2017;241:192–207. - PubMed
    1. Grand, R. J. A. & Reynolds, J.J. (eds.). DNA Repair and Replication: Mechanisms and Clinical Significance, 348 (Garland Science, 2018).
    1. Schmit M, Bielinsky A.K. Congenital Diseases of DNA Replication: Clinical Phenotypes and Molecular Mechanisms. Int. J. Mol. Sci. 2021;22:911. - PMC - PubMed
    1. Klingseisen A, Jackson AP. Mechanisms and pathways of growth failure in primordial dwarfism. Genes Dev. 2011;25:2011–2024. - PMC - PubMed

Publication types

MeSH terms