. 2022 Nov 4;13(1):6662.
doi: 10.1038/s41467-022-34465-5.

Reward expectation extinction restructures and degrades CA1 spatial maps through loss of a dopaminergic reward proximity signal

Affiliations

Reward expectation extinction restructures and degrades CA1 spatial maps through loss of a dopaminergic reward proximity signal

Seetha Krishnan et al. Nat Commun. .

Abstract

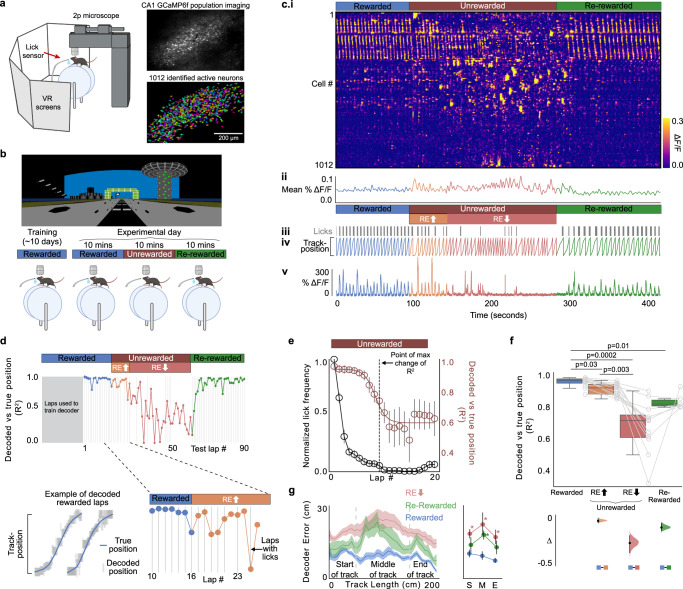
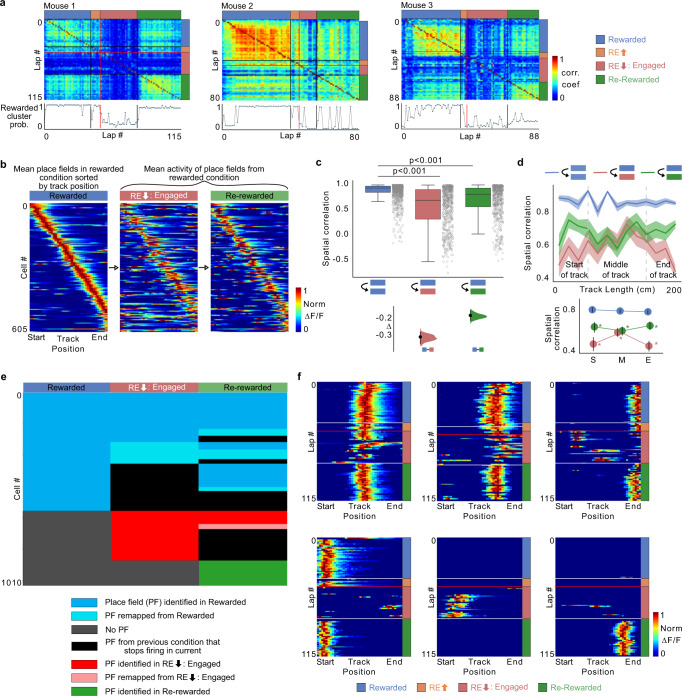
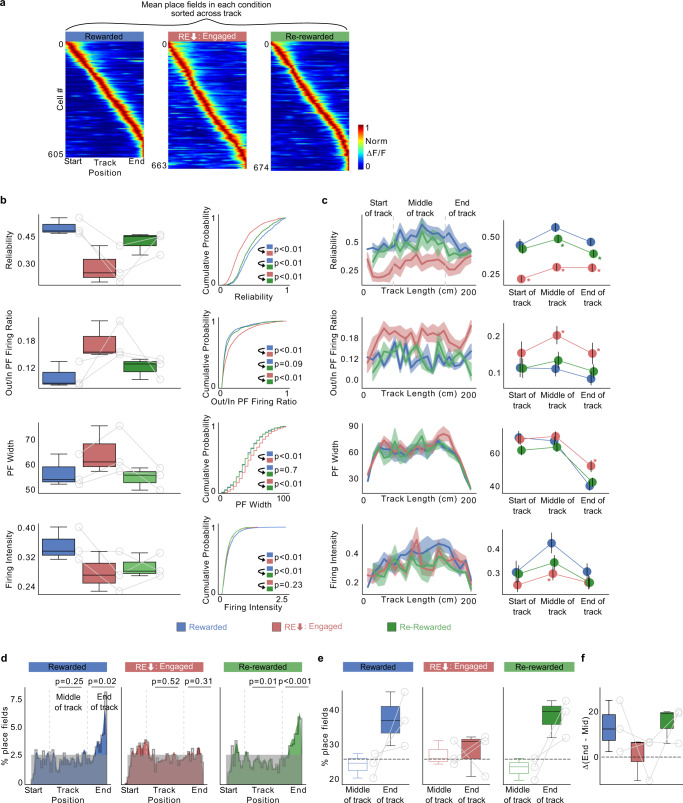
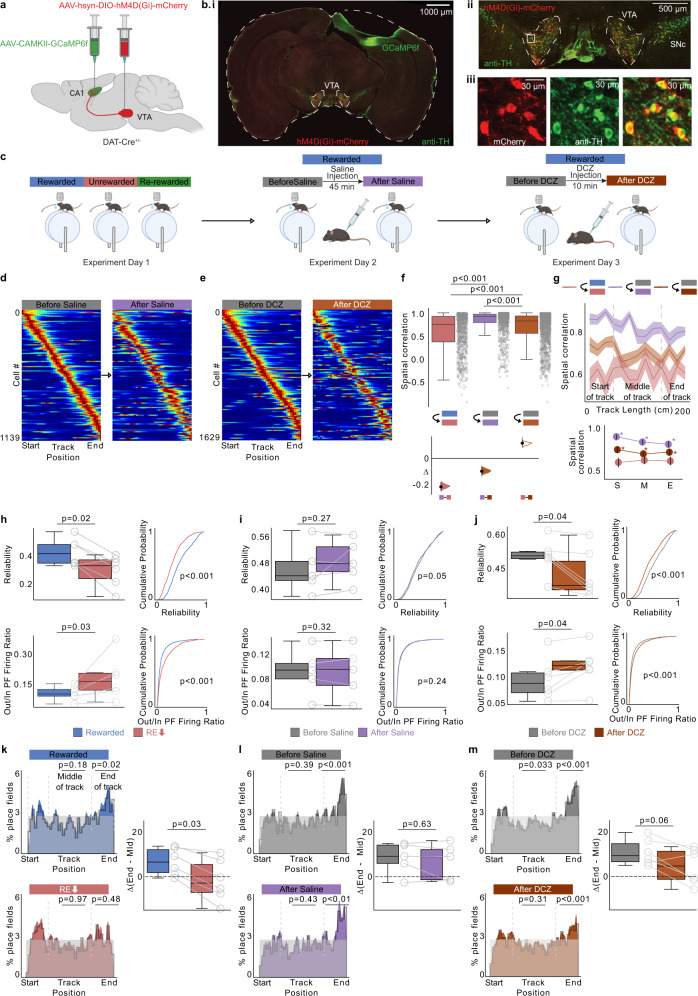
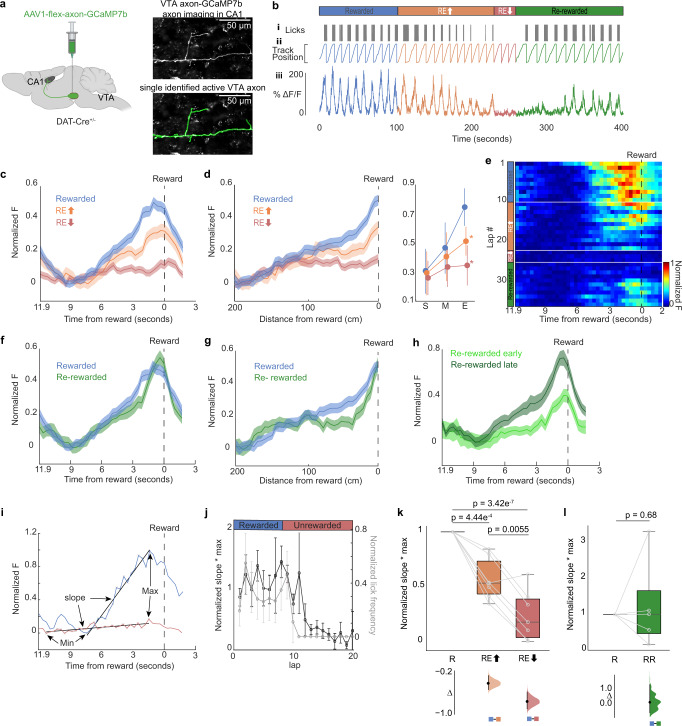
Hippocampal place cells support reward-related spatial memories by forming a cognitive map that over-represents reward locations. The strength of these memories is modulated by the extent of reward expectation during encoding. However, the circuit mechanisms underlying this modulation are unclear. Here we find that when reward expectation is extinguished in mice, they remain engaged with their environment, yet place cell over-representation of rewards vanishes, place field remapping throughout the environment increases, and place field trial-to-trial reliability decreases. Interestingly, Ventral Tegmental Area (VTA) dopaminergic axons in CA1 exhibit a ramping reward-proximity signal that depends on reward expectation and inhibiting VTA dopaminergic neurons largely replicates the effects of extinguishing reward expectation. We conclude that changing reward expectation restructures CA1 cognitive maps and determines map reliability by modulating the dopaminergic VTA-CA1 reward-proximity signal. Thus, internal states of high reward expectation enhance encoding of spatial memories by reinforcing hippocampal cognitive maps associated with reward.


Conflict of interest statement

The authors declare no competing interests.

Figures

Fig. 1
Fig. 1. Diminished reward expectation restructures spatial encoding in the hippocampus.
a Experimental setup (left), created with BioRender.com. A typical field of view in CA1 (right, top). Extracted regions of interest, randomly colored (right, bottom). b Experimental protocol. Image of virtual track (top). Changing reward contingencies (bottom, Rewarded (R), Unrewarded (UR), Re-Rewarded (RR)), created with BioRender.com. c i: Rasterplot representing fluorescence changes (ΔF/F) of cells in A across time. Cells (y-axis) are arranged with the most correlated cells next to each other. ii: Mean ΔF/F of the cells in (i). iii: Mouse licking behavior. iv: Mouse track position. v: ΔF/F from an example cell. Laps before animal stops consistently licking in UR were considered laps with high reward expectation (REhigh, orange laps) and after licking stops are laps with low reward expectation (RElow, red laps, see Methods). d A Bayesian decoder was trained on CA1 activity from initial laps in R and tested on remaining laps. (Top) Coefficient of determination (R2) between true and predicted position of tested laps, (bottom right) zoomed in. (Bottom left) An example fit. Gray lines indicate laps with licks. ad are from the same animal. e Mean decoder R2 fitted with a reverse Boltzmann Sigmoid (r = 0.94; magenta), mean lick frequency normalized to maximum licks (black) for each lap in unrewarded condition. Error bars indicate s.e.m. The point of maximum change in R2 as calculated from the fit is indicated by the dashed line. f (Top) Boxplots (see methods for definition) show distribution of mean decoder R2 in the different conditions. Circles represent individual animals. P values were obtained using a two-sided Paired t test. (Bottom) Bootstrapped mean differences (∆) with 95% Confidence Intervals (CI) (error bar). X-axis indicates the comparisons made. g (Left) Mean decoder error by track position. Shading indicates s.e.m. (Right) Mean decoder error binned by track position as indicated by gray bars in the left panel. Error bars indicate 95%CI. S: Start of the track, M: Middle of the track, E: End of the track. Asterisk (*) indicates significant p values (P < 0.01, two-sided paired t test) obtained by comparing R with other conditions at each position. n = 12 mice used for f, g.
Fig. 2
Fig. 2. Diminished reward expectation leads to place cell remapping across all track locations and loss of reward overrepresentation.
a (Top) Population vector correlations between place cell activity in each lap in all conditions in 3 animals. In laps with low reward expectation, only Engaged laps were used (RElow: Engaged). (Bottom) Probability of laps belonging to the Rewarded cluster following 1000 iterations of k-means clustering (see Methods). Red line indicates the lap where pre-licking stops, and black lines divide each condition. b Place fields defined in R plotted across all conditions. Activity of each place cell was normalized to peak in R and sorted by its center of mass along the track. c Boxplots show distribution of place field spatial correlation for cells (circles) within R condition (blue) and between R and other conditions. P values were obtained using two-sided paired t test. (Bottom) Bootstrapped mean differences (∆) with 95% CI (error bar). X-axis indicates the comparisons made. d (Top) Same data, averaged by track position. Shading indicates s.e.m. (Bottom) Average correlation binned by track position indicated by gray lines in the top panel. S: Start of the track, M: Middle of the track, E: End of the track. Asterisk (*) indicates significant P values (two-sided paired t test, P < 0.01) obtained by comparing R (blue) with other tasks at each position. Both d, e use n = 605 place cells defined in R. e Fate of place cells identified in different conditions. Place fields identified in R (blue) can be stable throughout RElow (blue) and RR (blue). They can also remap in RElow and RR (light blue) or lose their place field completely (black). New place fields can form in RElow (red) and be stable (red) or remap (light red), in RR. New place fields can also form in RR (green). f Example place cell activity in the different conditions. White lines divide each condition and the red line indicates lap defined as when pre-licking stops.
Fig. 3
Fig. 3. Diminished reward expectation leads to inferior spatial encoding by unreliable place cells across the entire environment.
a Place fields defined and sorted in each condition pooled from all mice (n = 3 mice). Each cell’s activity normalized to its peak and cells are sorted by their center of mass along the track. b Place cell parameters calculated independently from each condition are displayed as a boxplot of average per animal (left), cumulative histogram (right). P values were calculated using a two-sided t test. c (left) Mean place cell parameters across track location. Shading indicates s.e.m. (right) Average correlation binned by track position indicated by gray lines in the left panel. S: Start of the track, M: Middle of the track, E: End of the track. Asterisk (*) indicates significant P values (two tailed KS-test, P < 0.01) obtained by comparing R (blue) with other tasks at each position. d Distribution of place field center of mass (COM) locations in each condition pooled from all mice (n = 3 mice). Plots show observed density (gray line), uniform distribution (gray shade) and Gaussian distribution of place field density (color). P values (two-sided t test) were obtained by calculating the place field distribution with the uniform distribution. e Percentage of place fields in the middle of the track versus end of the track in each animal (circles). f Difference between end of track and middle of track place field percentages in each animal (circles, n = 3 mice). Dashed line in e, f indicates the percentage expected from a uniform distribution across the track. All place field calculations in RElow condition were done on Engaged laps (RElow: Engaged). Number of cells in bd; R: 605, RElow Engaged: 663, RR: 674.
Fig. 4
Fig. 4. Bilateral inhibition of VTA dopaminergic neurons largely replicates the effects of low reward expectation on place cells.
a Schematic representation of procedure, created with BioRender.com. b i, ii: Representative coronal brain section from 1 of 6 mouse brains expressing hm4D(Gi)-mCherry (red) in VTA, GCaMP6f in dorsal CA1(green), and immunostained for Tyrosine Hydroxolase (TH- green). iii: hm4D(Gi)-mCherry expression (left), TH expression (middle) and overlapping expression (right) in example VTA neurons. c Experimental protocol. d, e Place fields defined in the Before Saline/Before deschloroclozapine (DCZ) condition and plotted across After Saline/After DCZ administration. Activity of each place cell was normalized to peak in the Before conditions and sorted by their center of mass. f (Top) Boxplots show distribution of place field spatial correlation (circles) in R/RElow (left, n = 6 mice), Before Saline/After Saline (middle, n = 5 mice) and Before DCZ/After DCZ (right, n = 6 mice). Place cells were defined in the former condition. P values were obtained using two tailed KS-test. (Bottom) Bootstrapped mean differences (∆) with 95% CI (error bar). g (top) Same data, averaged by track position. Shading indicates s.e.m. (bottom) Average correlation binned by track position indicated by gray lines in the top panel. S: Start of the track, M: Middle of the track, E: End of the track. Asterisk (*) indicates significant P values (two tailed KS-test, P < 0.01) obtained by comparing UR (red) with other tasks at each position. hj Place cell parameters in each condition are displayed as boxplot of average per animal (left) and cumulative histogram (right, P values, two-sided paired t test). km (left) Distribution of place field center of mass (COM) locations in each condition pooled from all mice. Plots show observed density (gray line), uniform distribution (gray shade) and Gaussian distribution of place field density (color). P values (two-sided t test) were obtained by calculating the place field distribution with the uniform distribution. (right) Difference between end of track and middle of track place field percentages in each animal (circles). Dashed line indicates the difference expected from a uniform distribution across the track (P values, two-sided paired t test). Number of cells in fg and km; R/RElow: 928, Before Saline/After Saline: 1139, Before DCZ/After DCZ: 1629.
Fig. 5
Fig. 5. Activity of dopaminergic VTA axons in CA1 ramp up to reward.
a Schematic representation of injection procedure created with BioRender.com (left). Example CA1 field of view of VTA axons (right, top). Extracted region of interest (right, bottom). b Example mouse. i: Mouse licking behavior. ii: Mouse track position. iii: ΔF/F from an example ROI. c Fluorescent activity of axons (7 axons in 6 mice) in R (blue), REhigh (orange-RE arrow), and RElow (red-RE arrow) experimental conditions averaged by time to reward. Shaded areas represent s.e.m. d Same data, averaged by position (left). Mean with 95% CI (error bar) of starting 50 cm (S), middle 100 cm (M), and end 50 cm (E)(right). Asterisk (*) indicates significant p-values (two-sided paired t test, P < 0.01) obtained by comparing R (blue) with other tasks at each position. e Normalized fluorescence of an example axon in the different conditions binned by time to reward. White lines divide each condition, and the dashed line represents time of reward delivery. f Fluorescent activity of VTA axons (5 axons in 5 mice) in R(blue) and RR (green) averaged by time to reward. Shaded areas represent s.e.m. g Same data averaged by position. h RR time binned fluorescent activity divided into early (light green) and late laps (dark green) and averaged by time to reward. i Example showing how the max and slope of time binned fluorescence data was determined in an R (blue) and RElow (red) lap. j Mean slope*max for laps in the R and Unrewarded (black, n = 7) and mean lick frequency normalized to maximum licks (gray), error bars represent s.e.m. k, l Boxplot shows distribution of mean slope*max of axons (circles) within R, REhigh, and RElow (k; n = 7 axons) and within R and RR (l; n = 5 axons). P values were obtained using a two-sided paired t test. (Bottom) Bootstrapped mean differences (∆) with 95% CI (error bar) are shown at the bottom. X-axis indicates the comparisons made.

Similar articles

Cited by

References

    1. O’Keefe J, Dostrovsky J. The hippocampus as a spatial map. Preliminary evidence from unit activity in the freely-moving rat. Brain Res. 1971;34:171–175. - PubMed
    1. Colgin LL, Moser EI, Moser MB. Understanding memory through hippocampal remapping. Trends Neurosci. 2008;31:469–477. - PubMed
    1. Bostock E, Muller RU, Kubie JL. Experience-dependent modifications of hippocampal place cell firing. Hippocampus. 1991;1:193–205. - PubMed
    1. Ziv Y, et al. Long-term dynamics of CA1 hippocampal place codes. Nat. Neurosci. 2013;16:264–266. - PMC - PubMed
    1. Dong C, Madar AD, Sheffield MEJ. Distinct place cell dynamics in CA1 and CA3 encode experience in new environments. Nat. Commun. 2021;12:2977. - PMC - PubMed

Publication types