. 2022 Nov 4;7(1):139.
doi: 10.1038/s41541-022-00558-x.

Creation and preclinical evaluation of genetically attenuated malaria parasites arresting growth late in the liver

Affiliations

Creation and preclinical evaluation of genetically attenuated malaria parasites arresting growth late in the liver

Blandine Franke-Fayard et al. NPJ Vaccines. .

Abstract

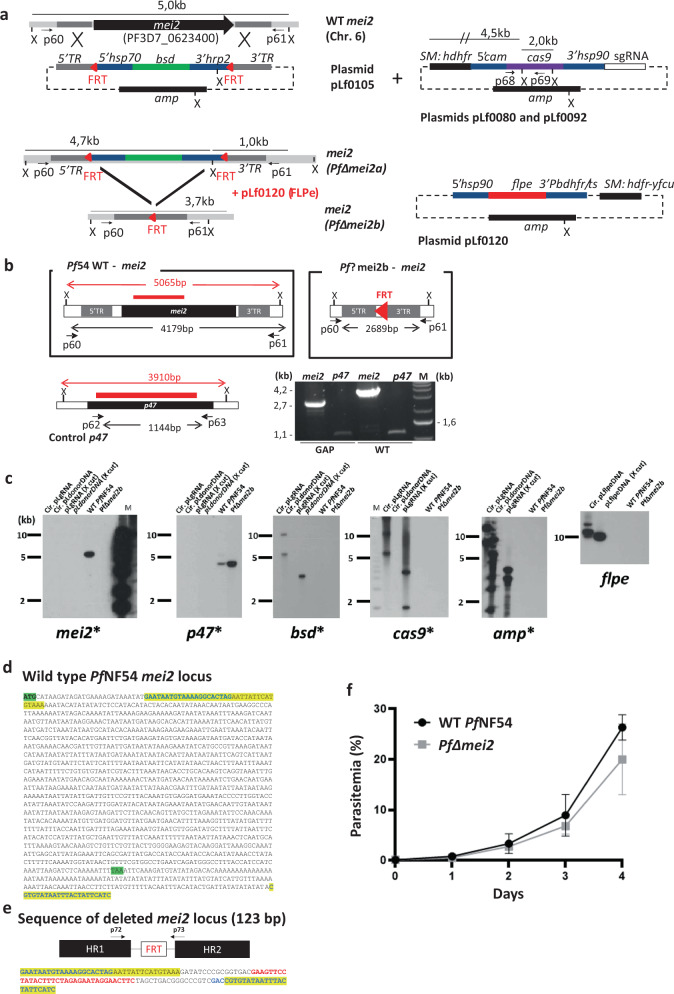
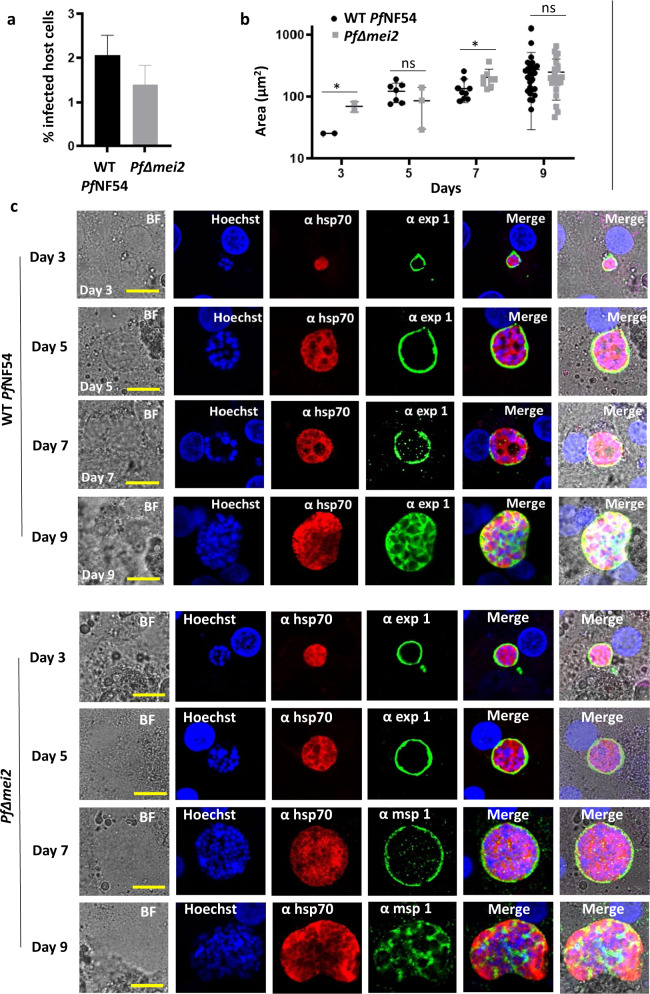
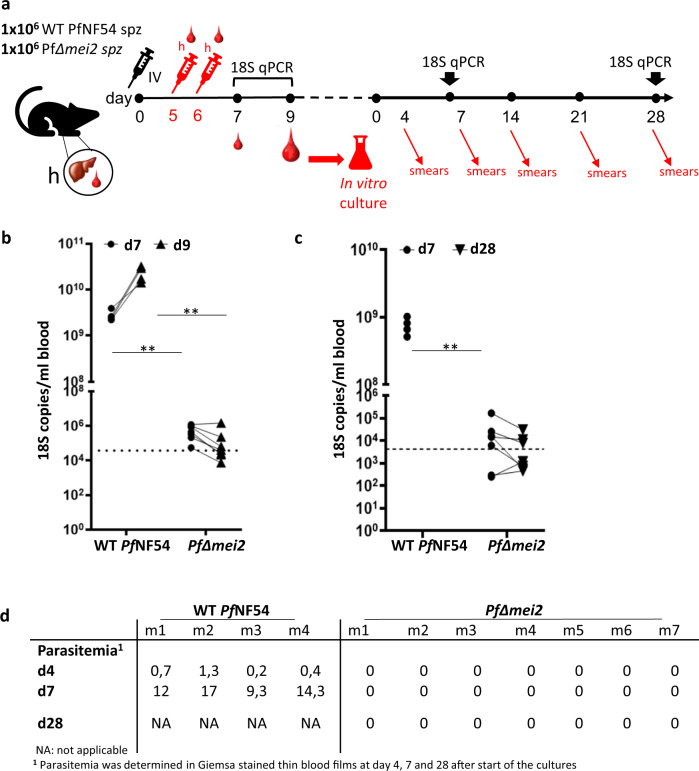
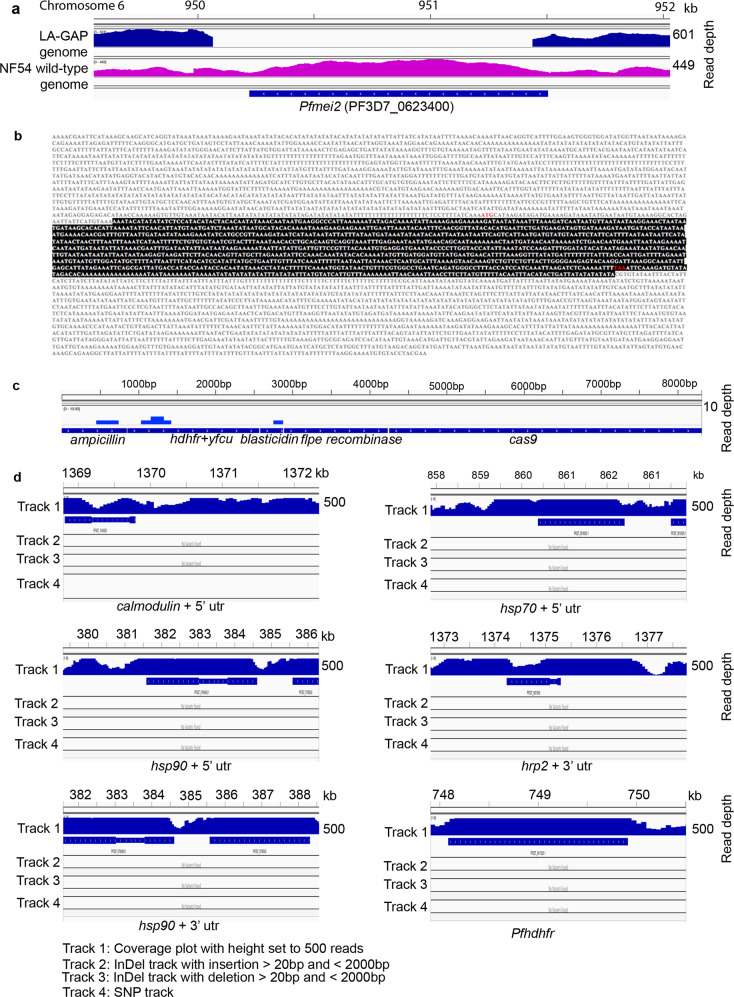
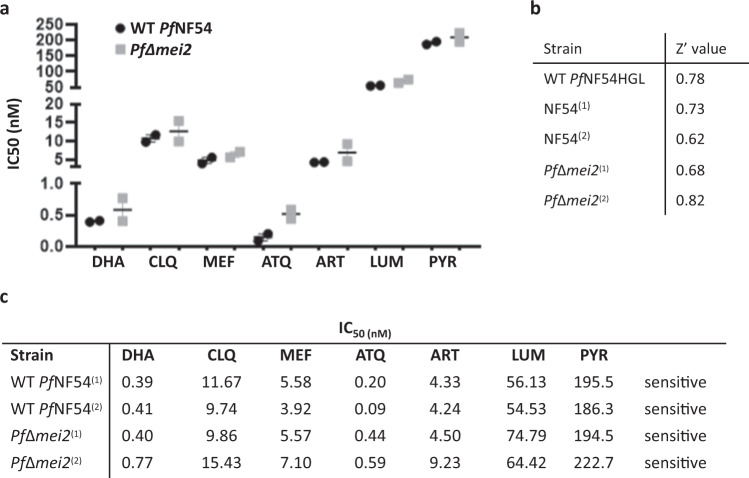
Whole-sporozoite (WSp) malaria vaccines induce protective immune responses in animal malaria models and in humans. A recent clinical trial with a WSp vaccine comprising genetically attenuated parasites (GAP) which arrest growth early in the liver (PfSPZ-GA1), showed that GAPs can be safely administered to humans and immunogenicity is comparable to radiation-attenuated PfSPZ Vaccine. GAPs that arrest late in the liver stage (LA-GAP) have potential for increased potency as shown in rodent malaria models. Here we describe the generation of four putative P. falciparum LA-GAPs, generated by CRISPR/Cas9-mediated gene deletion. One out of four gene-deletion mutants produced sporozoites in sufficient numbers for further preclinical evaluation. This mutant, PfΔmei2, lacking the mei2-like RNA gene, showed late liver growth arrest in human liver-chimeric mice with human erythrocytes, absence of unwanted genetic alterations and sensitivity to antimalarial drugs. These features of PfΔmei2 make it a promising vaccine candidate, supporting further clinical evaluation. PfΔmei2 (GA2) has passed regulatory approval for safety and efficacy testing in humans based on the findings reported in this study.


Conflict of interest statement

The authors declare no competing interests.

Figures

Fig. 1
Fig. 1. Generation, genotyping, and blood-stage growth of PfΔmei2 (LA-GAP, GA2).
a Left: the mei2 (PF3D7_ 0623400) genomic locus on chromosome 6 (Chr. 6) of wild-type Pf NF54 (WT Pf NF54) and PfΔmei2 parasites before (PfΔmei2a) and after (PfΔmei2b) FLPe-mediated removal of the blasticidin-S-deaminase (bsd) selectable marker (SM). The donor plasmid pLf0105 to delete mei2 contains the bsd SM, flanked by two frt sites (red triangles) and mei2 targeting sequences (5′ TR and 3′ TR) for double cross-over integration. Primer pairs p60/p61 and PCR fragment size for diagnostic PCR are indicated (b); X (XmnI): restriction site used for Southern blot analyses (c). hsp70, heat shock protein 90; hrp2, histidine-rich protein II; amp, ampicillin. Right top: sgRNA plasmids (pLf0080, pLf0092) containing the human dihydrofolate reductase-thymidylate synthase (hdhfr) SM and the cas9 expression cassette. Cam, calmodulin. PCR primers (p68/p69) to amplify part of cas9, sizes of the sgRNA constructs after XmnI (X) digestion and mei2 and cas9 probes are indicated (c). Right bottom: construct pLf0120 with the hdhfr-yfcu SM and the flpe expression cassette. pbdhfr/ts,: P. berghei bifunctional dihydrofolate reductase-thymidylate synthase, putative. See Supplementary Table 1 for primers details. b WT Pf NF54 and PfΔmei2b genomic loci and the control gene p47 (coding sequence shown as black boxes). Shown are the 5′ and 3′ mei2 targeting regions (5′TR and 3′TR), used construct pLf0105 (a) and the frt site. PCR primers (in black) for amplifying mei2 (p60/p61) and p47 (p62/63), expected sizes of the full length mei2 and p47 genes and size of mei2 locus after mei2 deletion and removal of bsd SM cassette are shown. X (XmnI): restriction site used for Southern analysis (c). DNA probes used in Southern analyses (c) and sizes of digested DNA fragments recognized by the probes (mei2 and p47) are shown (in red). Red triangle: the 34 bp frt site in the PfΔmei2b genome after removal of the bsd SM cassette. PCR (right lower panel) analysis of WT Pf NF54 and PfΔmei2b genomic DNA confirms mei2 deletion (control: amplification of p47). Primer pairs: p60/61 for mei2 and p62/p63 for p47. See Supplementary Table 1 for primer details). M, molecular weight marker; 1 kb DNA ladder (Invitrogen). c Southern analysis of restricted genomic DNA from WT Pf NF54, PfΔmei2b, and plasmids used to delete mei2 (DNA digested with XmnI (X)). DNA-samples/lanes: (i) circular sgRNA plasmids (Cir.pLgRNA); (ii) circular donor DNA plasmid pLf0105 (pLΔmei2); (iii) XmnI-digested sgRNA plasmid (pLgRNA-X cut); (iv) XmnI-digested donor DNA plasmid; v) genomic WT Pf NF54 DNA; (vi) genomic PfΔmei2b DNA. Probes: part of mei2, p47 (control), cas9, bsd, amp and flpe (see a and b for probe location and expected fragment sizes). Hybridizations show correct mei2 deletion and absence of cas9, bsd, amp and flpe in PfΔmei2b. M, molecular weight marker; 1 kb DNA ladder (Invitrogen) labeled on the sides of the gels. d Sequence of the WT PfNF54 mei2 locus. Yellow: sequences present in the disrupted mei2 locus of PfΔmei2 (e); Green: start and stop codon of mei2. e The mei2 locus in the PfΔmei2 genome after mei2 deletion by integration of pLf0105 and FLPe-mediated removal of the bsd SM marker The mei2 targeting regions (HR1 and HR2) for double cross-over integration and the frt site are shown. In addition, the sequence of the PCR fragment of the mei2 locus is shown, amplified using primers p72/p73 (see Supplementary Table 1 for primer details). Yellow: sequences present in the mei2 locus of WT PfNF54 and PfΔmei2. Red: the 34 bp FRT sequence, flanked by 16 bp and 14 bp cloning restriction sites. f In vitro growth rate of PfΔmei2 and WT Pf NF154 asexual blood stages. Parasitemia (%) during a 4-day culture period (mean and s.d. of three cultures). Error bars represent standard deviation.
Fig. 2
Fig. 2. PfΔmei2 liver-stage development in cultured human primary hepatocytes (BioIVT).
a Percentage of hepatocytes infected with WT PfNF54 and PfΔmei2 at day 3 post infection (p.i.) (p = 0.002; unpaired Mann–Whitney test). b Liver-stage size on day 3, 5, 7, and 9 p.i. (3-20 parasites measured in two wells). The average of the parasite’s cytoplasm at its greatest circumference using HSP70-positive area (μm2), s.d. and significances values are shown (unpaired Mann–Whitney test: *p < 0.05; ns: not significant). c Representative confocal microscopy images of liver stages on days 3, 5, 7, and 9 p.i. Upper panel WT PfNF54; lower panel PfΔmei2. Fixed hepatocytes were stained with the following antibodies: rabbit anti-PfHSP70 (α hsp70), mouse anti-PfEXP1 (α exp1), and anti-PfMSP1 (α msp1). Nuclei stained with Hoechst-33342. All pictures were recorded with standardized exposure/gain times; Alexa Fluor® 488 (green) 0.7 s; anti-IgG Alexa Fluor® 594 (red) 0.6 s; Hoechst (blue) 0.136 s; bright field (BF) 0.62 s (1× gain). Scale bar, 10 μm. Error bars represent standard deviation.
Fig. 3
Fig. 3. Development of PfΔmei2 in FRG huHep mice containing human red blood cells.
a Timeline of experiments in liver-chimeric mice where mice were injected intravenously (IV) with 1 × 10(6) sporozoites on day 0 and then with human red blood cells (h) on days 5 and 6 prior to emergence of blood-stage parasites. Blood samples were taken on days 7 and 9 for qRT-PCR with day 9 samples used for 28-day in vitro culture of blood stages with subsequent parasitaemia readout by microscopy and qRT-PCR. b 18 S qPCR analysis of blood samples from FRG huHep mice on day 7 and 9 after infection with 1 × 10(6) sporozoites of PfΔmei2 (n = 7 mice) and WT PfNF54 (n = 4 mice). Significance values (unpaired Mann–Whitney test): **p < 0.001. Dotted line: the cutoff as used in controlled human malaria infection (CHMI) at OHSU of 5 parasites/ml, assuming 7400 18 S copies/per parasite. c Analysis of blood samples from FRG huHep mice for presence of blood-stage parasites by in vitro cultivation of blood stages. Cultures, maintained in a semi-automated shaker system, were monitored for blood-stages for 28 days by microscopy analysis of Giemsa-stained thin and thick blood smears (see d) and by 18 S qPCR. Significance values (unpaired Mann–Whitney test): **p < 0.001. Dotted line: the 10 parasites/ml cutoff used in CHMI at LUMC, assuming 4252 18 S copies per parasite. d Blood-stage parasites in cultured blood samples collected from FRG huHep mice (m) after infection with PfΔmei2 and WT PfNF54 sporozoites. Samples from in vitro cultures were analyzed at different days (d) for blood-stage parasitemia by microscopy (% of infected RBC).
Fig. 4
Fig. 4. PfΔmei2 genome sequence analysis.
a The mei2 locus of PfΔmei2. No sequence reads are mapped on the mei2 coding sequence while reads map in the mei2 up- and downstream regions. b Sequence of the mei2 locus of PfΔmei2. The mei2 flanking regions are unaltered and the expected mei2 deletion event is shown by the preservation of the mei2 targeting sequences (yellow). The mei2 coding sequence (in red) is absent (start and stop codon in green). c Uniquely mapped sequence read (Illimina reads) coverage of heterologous sequences used in the DNA constructs/plasmids for generation of PfΔmei2. None of the sequences (ampicilin, hdhfr-yfcu, blasticydin, flpe, and cas9) were mapped with sequence reads from the PfΔmei2 genome. d Read coverage, InDel, and SNP information of the following endogenous 5′- and 3′-utr sequences, used in DNA constructs/plasmids to drive gene expression. These sequences were unaltered in the PfΔmei2 genome. The regions were: 5′UTR: calmodulin, PF3D7_1434200; Hsp70, PF3D7_0818900; Hsp90, PF3D7_0708400; 3′UTR: Hpr2, PF3D7_0831800; Hsp90, PF3D7_0708400; and the dhfr/ts locus, PF3D7_0417200.
Fig. 5
Fig. 5. Sensitivity of PfΔmei2 and WT PfNF54 blood stages to seven antimalarial drugs.
a Drug sensitivity of PfΔmei2 (gray) and WT PfNF54 (black) to seven antimalarial drugs was determined in an asexual Blood stage (ABS) SYBR Green drug assay. The graph shows the IC50 value with standard error of the mean (SEM) (see c below for the exact values). DHA dihydroartemisinin, CLQ chloroquine, MEF mefloquine, ATQ atovaquone, ART, artemisinin, LUM lumefantrine, PYR pyrimethamine. b Z’ values for each tested Plasmodium falciparum strain. The Table shows the Z’ values for each of the plates tested in the ABS replication assay. c IC50 values for each culture for the drugs shown in a. IC50 was determined using a four-parameter non-linear regression model using least-squares to find the best fit. Error bars represent the standard error of the mean.

References

    1. Richie TL, et al. Progress with Plasmodium falciparum sporozoite (PfSPZ)-based malaria vaccines. Vaccine. 2015;33:7452–7461. - PMC - PubMed
    1. Hollingdale MR, Sedegah M. Development of whole sporozoite malaria vaccines. Expert Rev. Vaccines. 2017;16:45–54. - PubMed
    1. Duffy PE, Patrick Gorres J. Malaria vaccines since 2000: progress, priorities, products. NPJ Vaccines. 2020;5:48. - PMC - PubMed
    1. Goh YS, McGuire D, Rénia L. Vaccination with sporozoites: models and correlates of protection. Front. Immunol. 2019;10:1227. - PMC - PubMed
    1. Hoffman SL, et al. Protection of humans against malaria by immunization with radiation-attenuated Plasmodium falciparum sporozoites. J. Infect. Dis. 2002;185:1155–1164. - PubMed