. 2022 Nov 4;13(1):6619.
doi: 10.1038/s41467-022-34395-2.

Pan-cancer single-cell analysis reveals the heterogeneity and plasticity of cancer-associated fibroblasts in the tumor microenvironment

Affiliations

Pan-cancer single-cell analysis reveals the heterogeneity and plasticity of cancer-associated fibroblasts in the tumor microenvironment

Han Luo et al. Nat Commun. .

Abstract

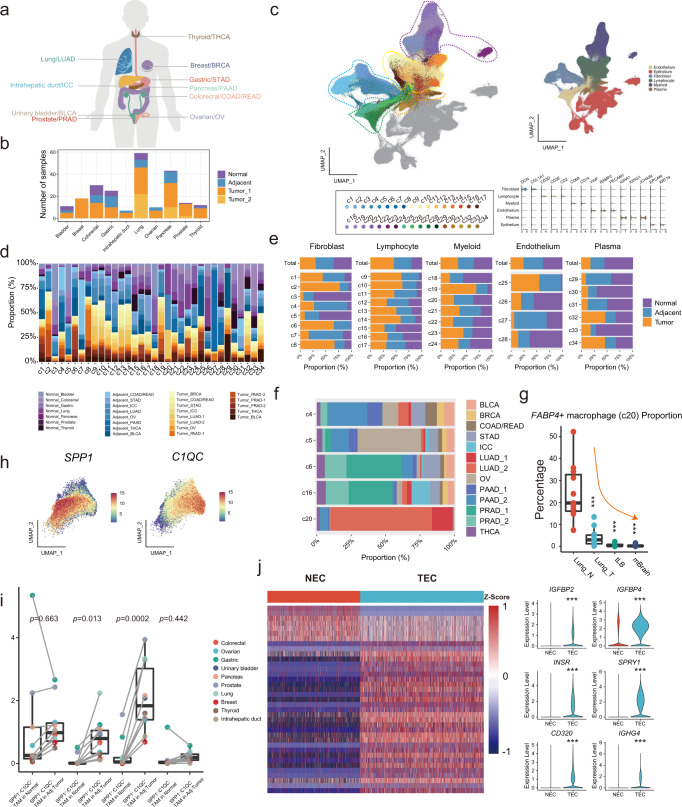
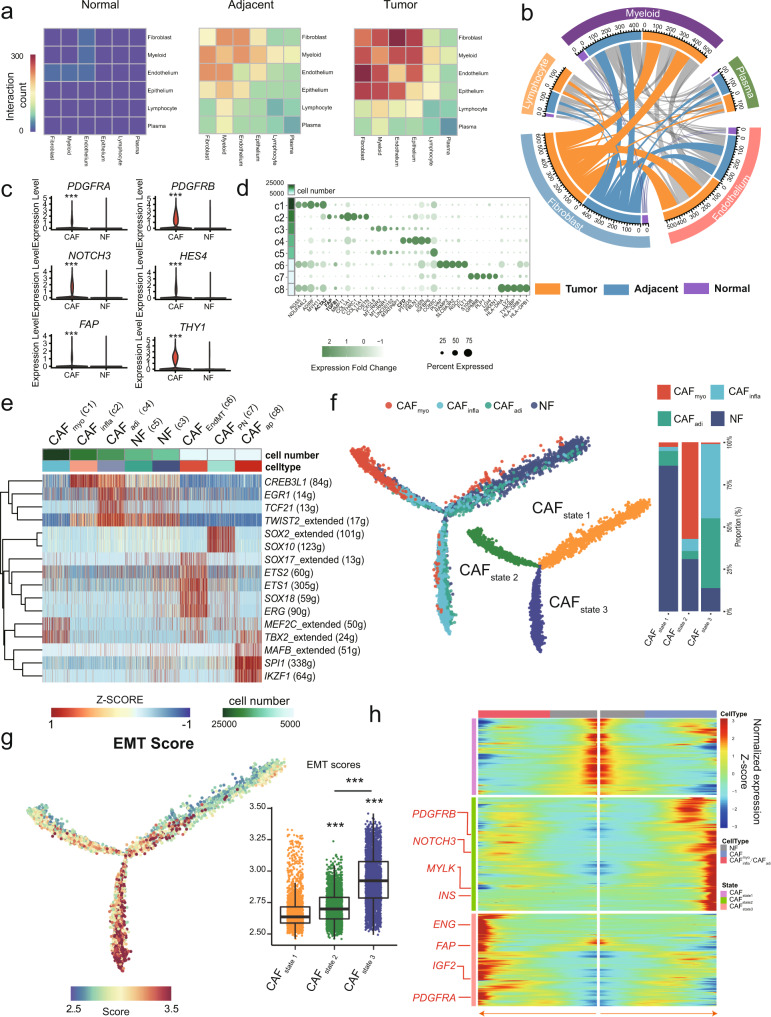
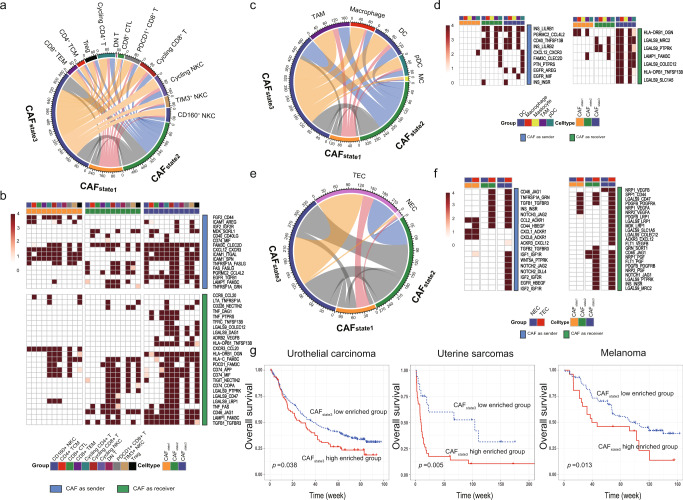
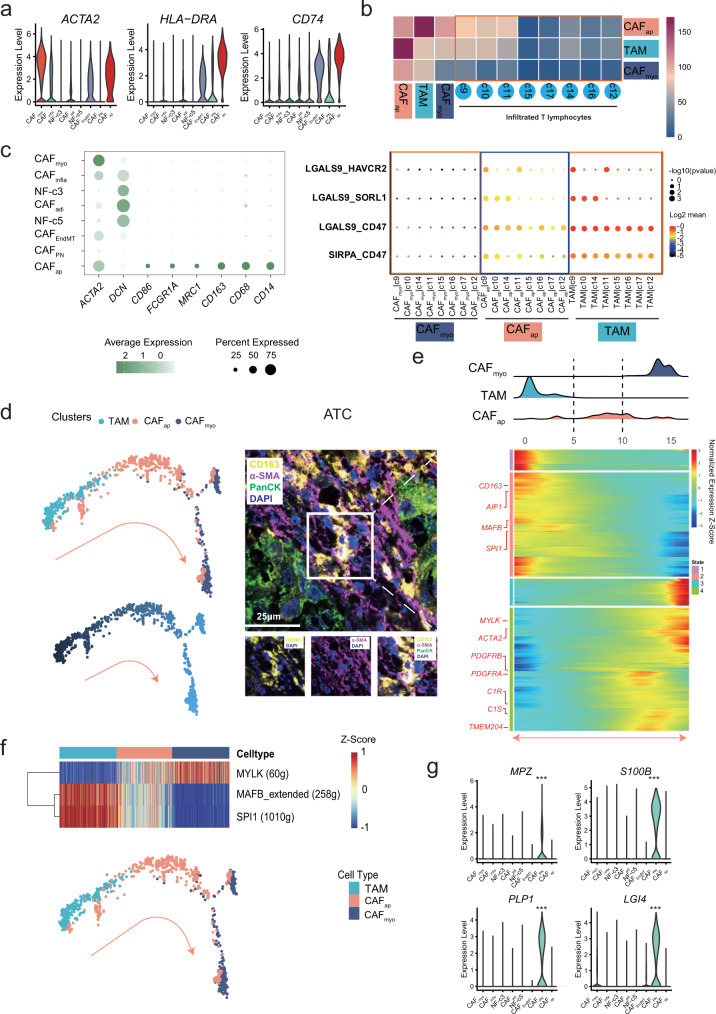
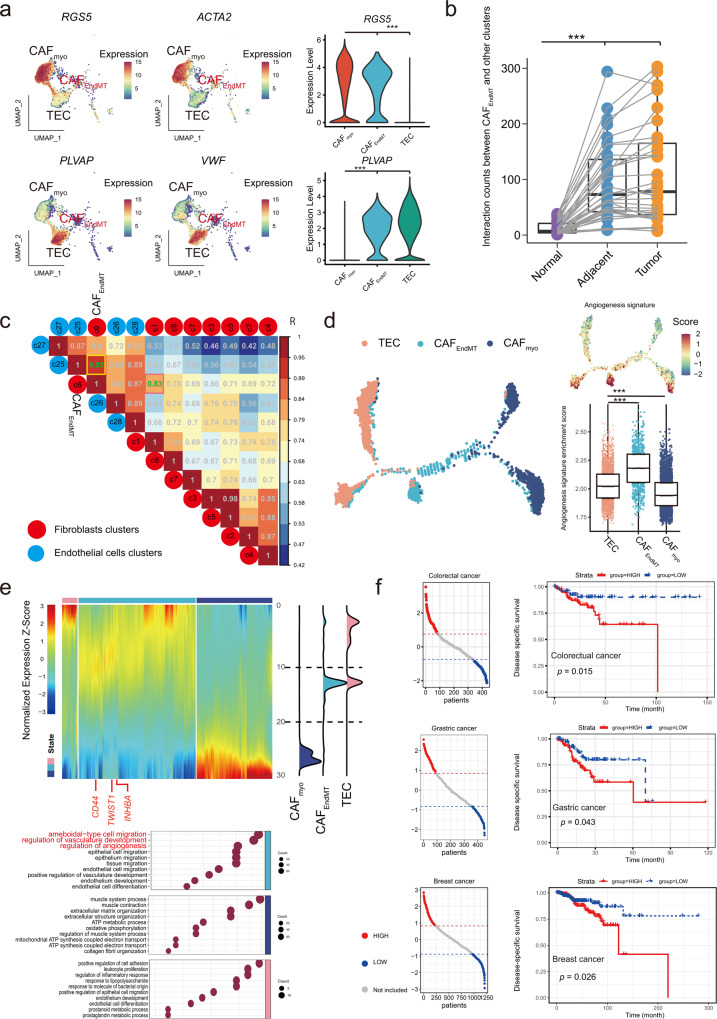
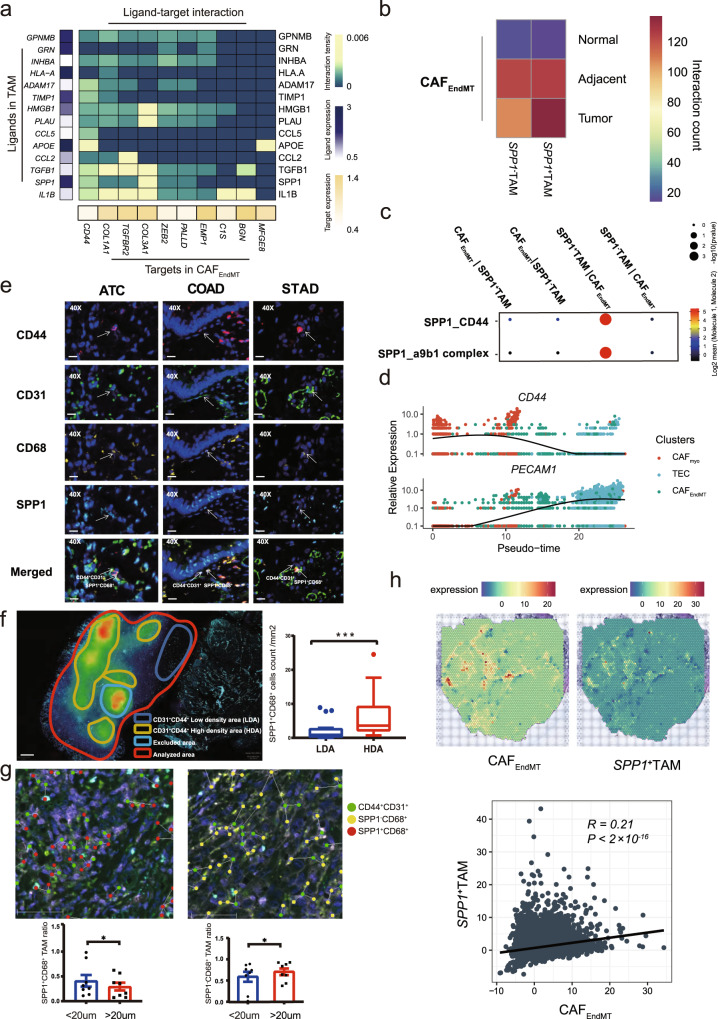
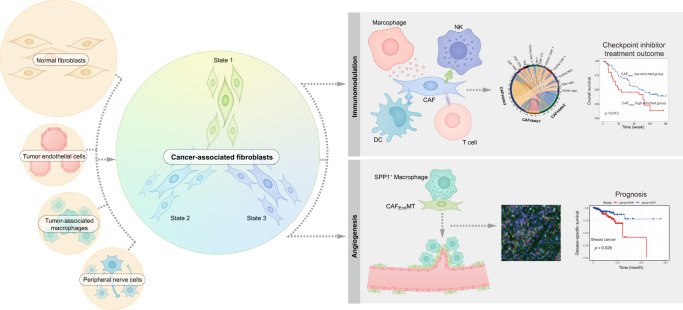
Cancer-associated fibroblasts (CAFs) are the predominant components of the tumor microenvironment (TME) and influence cancer hallmarks, but without systematic investigation on their ubiquitous characteristics across different cancer types. Here, we perform pan-cancer analysis on 226 samples across 10 solid cancer types to profile the TME at single-cell resolution, illustrating the commonalities/plasticity of heterogenous CAFs. Activation trajectory of the major CAF types is divided into three states, exhibiting distinct interactions with other cell components, and relating to prognosis of immunotherapy. Moreover, minor CAF components represent the alternative origin from other TME components (e.g., endothelia and macrophages). Particularly, the ubiquitous presentation of endothelial-to-mesenchymal transition CAF, which may interact with proximal SPP1+ tumor-associated macrophages, is implicated in endothelial-to-mesenchymal transition and survival stratifications. Our study comprehensively profiles the shared characteristics and dynamics of CAFs, and highlight their heterogeneity and plasticity across different cancer types. Browser of integrated pan-cancer single-cell information is available at https://gist-fgl.github.io/sc-caf-atlas/ .


Conflict of interest statement

The authors declare no competing interests.

Figures

Fig. 1
Fig. 1. Landscape of the TME in pan-cancer illustrated using scRNA-seq analysis.
a The cancer types included in this pan-cancer study. b The sample size histography of the selected normal/adjacent/tumor tissues. The sample size of replicates is shown when applicable. c Uniform Manifold Approximation and Projection (UMAP) plots of pan-cancer with 34 TME clusters, which are grouped into 4 main parts (i.e., endothelial cells, fibroblasts, lymphocytes/plasma cells, and myeloid cells). d Histography of the composition proportion of different tissue types in each TME cluster. e Clustering of TME components and their composition proportions in normal, adjacent, and tumor tissues. The proportion was normalized to the total cell number in each cancer. f Cancer type composition histography of tissue-enriched clusters according to cellular origin (c4-6, c16 and c20). g Significantly decreased proportions of FABP4+ macrophages along adjacent normal lung (Lung_N, n = 11), lung tumor (Lung_T, n = 11), advanced stage of tumor (tLB, n = 4), and brain metastasized (mBrain, n = 10) tissues, The box is bounded by the first and third quartile with a horizontal line at the median and whiskers extend to the maximum and minimum value. Dunnett-t two-sided test is used to test the significance of FABP4 + macrophages proportion between different tumor and normal tissue categories, Lung_N vs Lung_T p-value is 5.87 × 10−7, Lung_N vs tLB, p-value is 1.26 × 10−5, Lung_N vs mBrain, p-value is 2.97 × 10−8; ***: p < 0.001. h Feature plot of SPP1 and C1QC expression in the tumor-associated macrophage cluster. i Comparison of C1QC+ TAMs, SPP1+ TAMs, C1QC+/SPP1+ TAMs and C1QC-/SPP1- TAMs in normal and adjacent/tumor tissues, normal tissue n = 43, adjacent/tumor tissue n = 159. The box is bounded by the first and third quartile with a horizontal line at the median and whiskers extend to the maximum and minimum value. Mann–Whitney two-sided test is used to test the significance of proportion between different cell types. ***p < 0.001. j Differentially expressed genes clustering and specifically altered genes between tumor endothelial cells (TECs) and normal endothelial cells (NECs). Mann–Whitney two-sided test is used to test the significance of gene expression level between NEC and TEC categories. Source data are provided as a Source Data file.
Fig. 2
Fig. 2. Generalized activation of CAFs in the TME.
a The mutual interaction among the main TME components and epithelial cells in different tissue origins. b The interaction between fibroblasts and other TME components. The length of arcs represents the predicted interaction counts. c Violin plot of specific marker genes in cancer-associated fibroblasts (CAFs) and normal fibroblasts (NFs). Mann–Whitney two-sided test is used to test the significance of gene expression level between CAF and NF categories. ***p < 0.001. d Bubble plot showing the expression of tag genes between CAFs and NFs. e Regulons enriched in each fibroblast cluster detected via SCENIC analysis. f Left: activation trajectory of CAFs, which are divided into three states (CAFState1/2/3). Right: histography of the different CAF components in each CAF state. g Left: epithelial-mesenchymal transition (EMT) score enriched along the evolutionary trajectory of CAFs. Right: comparison of EMT scores among three CAF states, state1: n = 2130, state2: n = 4948, state3: n = 8667. The box is bounded by the first and third quartile with a horizontal line at the median and whiskers extend to the maximum and minimum value. Mann–Whitney two-sided test is used to test the significance of EMT scores among different state categories. ***p < 0.001. h Fluctuation of genes along different states. Source data are provided as a Source Data file.
Fig. 3
Fig. 3. CAFs orchestrate the immune TME and angiogenesis.
a and b Predicted and detailed interactions between different CAF states and NK/T cells. c and d Predicted and detailed interactions between different CAF states and subgroups of dendritic cells. e and f Predicted and detailed interactions between different CAF states and endothelial cells (TECs and NECs). g Estimation of the prognostic value of the CAFstate3 signature score in three immunotherapy cohorts (urothelial carcinoma, uterine sarcoma, and melanoma) Kaplan–Meier curves for overall survival in all patients according to the number of positive ligands. p-values for all survival analyses have been calculated using the log-rank test.ue.
Fig. 4
Fig. 4. Characterization of fibroblast plasticity.
a Violin plot of specific gene expression in antigen-presenting CAFs (CAFap). b Upper: peer comparison of the interactions of CAFap, TAM, and CAFmyo with T-cell clusters. Lower: the instance of interaction pattern presentation in CAFmyo, TAM, and CAFap with T-cell clusters. c Bubble plot of mono-macrophage-specific markers in each fibroblast cluster, one-sided Wilcoxon rank-sum test is used to assess the statistical significance of each interaction score. d The evolutionary trajectory along the TAM-CAFap-CAFmyo path. Confocal image of multiplexed immunofluorescence staining of PanCK, α-SMA, and CD163 in anaplastic thyroid cancer tissues. Multiplexed immunofluorescence assays are performed twice on tumor samples following assay optimization. e Gene expression alteration and ridgeline plot along the reciprocal trajectory. f Regulon enrichment along the evolutionary trajectory in different cell types. g Violin plot of peripheral nerve-specific genes (MPZ, S100B, PLP1, and LGI4) in CAFPN. Kruskal-Wallis two-sided test is used to test the significance of gene expression level among different fibroblast clusters. ***p < 0.001.
Fig. 5
Fig. 5. Characterization of CAFs in endothelial-mesenchymal transition (EndMT).
a Feature and violin plots of specific genes in CAFEndMT and TECs. b The interaction counts between CAFEndMT and other components in different tissue origins. Normal: n = 34, Adjacent: n = 34, Tumor: n = 34. The box is bounded by the first and third quartile with a horizontal line at the median and whiskers extend to the maximum and minimum value. Mann–Whitney two-sided test is used to test the significance of interaction counts between CAFEndoMT and other clusters. Normal vs Adjacent p-value is 2.52 × 10−6, Normal vs Tumor p-value is 5.87 × 10−8, ***p < 0.001. c Genetic similarity between clusters of CAFs and endothelial cells. d The evolutionary trajectory along the TECs-CAFEndMT-CAFmyo path with the angiogenesis hallmark signature enriched along the trajectory and CAFEndMT. State1: n = 3550, state2: n = 754, state3: n = 3062. The box is bounded by the first and third quartile with a horizontal line at the median and whiskers extend to the maximum and minimum value. Mann–Whitney two-sided test is used to test the significance of Angiogenesis signatures enrichment scores among TECs-CAFEndMT-CAFmyo clusters. TEC vs CAFEndoMT p-value is 4.67 × 10−102. TEC vs CAFmyo p-value is 5.53 × 10−27, ***p < 0.001. e Gene expression alteration with gene ontology and ridgeline plot along the reciprocal trajectory. f Estimation on the prognostic value of the CAFEndMT signature in colorectal, gastric and breast cancer in terms of disease-specific survival. Kaplan–Meier curves for overall survival in all patients according to the number of positive ligands. p-values for all survival analyses have been calculated using the log-rank test. Source data are provided as a Source Data file.
Fig. 6
Fig. 6. Triple interplay between CAFEndMT and SPP1+ TAMs.
a NicheNet analysis screening potential ligands of CD44. The left bar presents the expression scale of the potential ligand in TAM. b Predicted interaction counts between CAFEndMT and SPP1+ TAM/SPP1- TAM using CellphoneDB analysis. c SPP1-involved specific ligand–receptor interaction between CAFEndMT and SPP1+/SPP1- TAMs, one-sided Wilcoxon rank-sum test is used to assess the statistical significance of each interaction score. d Dynamic alterations in CD44 and PECAM1 during EndMT. e Multiplexed immunofluorescence staining of CD44, CD31, CD68, and SPP1 in anaplastic thyroid cancer, gastric cancer, and colorectal cancer tissues, Scale bar: 20 μm. Multiplexed immunofluorescence assays are performed twice on tumor samples following assay optimization. f Illustration of CD44+CD31+ high- and low-density areas (HDA and LDA, respectively) and the quantified results (LDA: n = 23, HDA: n = 17, The box is bounded by the first and third quartile with a horizontal line at the median and whiskers extend to the maximum and minimum value. Mann–Whitney two-sided test is used to test the significance of proportion between LDA and HDA categories. ***p < 0.001, p-value is 0.0008), Scale bar: 500 μm Multiplexed immunofluorescence assays are performed twice on tumor samples following assay optimization. g The spatial distance quantification. The left panel compares the SPP1+CD68+ and the right panel compares SPP1-CD68+ macrophage ratios (normalized by the total number of macrophage) between within 20 μm and outside 20 μm of CAFEndMT (<20 μm: n = 8, >20 μm: n = 8, Wilcoxon two-sided test is used to test the significance of ratio between within 20 μm and outside 20 μm of CAFEndMT. *p < 0.05, left panel: p-value is 0.0391, right panel: p-value is 0.0391). Scale bar: 50 μm. h Upper: Illustration of the spatial transcriptomic spot of colorectal cancer tissues with CAFEndMT and SPP1+TAM signature enrichment. Lower: The scatter plot and correlation between the CAFEndMT enrichment score and SPP1+TAM enrichment score (R represents Pearson’s correlation and its coefficient of determination, p-value is 2.26 × 10−10), suggesting the co-localization of these two cell types. Source data are provided as a Source Data file.
Fig. 7
Fig. 7. Summary illustration of the study.
Left part: four circles stand for the origins of cancer associated fibroblast (CAF). The big circle indicates the main origin of CAF-derived from normal fibroblasts activation, whereas the three small circles indicate the alternative origin of CAF. In general, the activation trajectory is divided into three states (state 1–3). Right part: The state of CAF is associated with immunomodulation, thus may predicting the prognosis of checkpoint-inhibitor-based treatment for specific cancer types, and it is also associated with angiogenesis by interacting with proximal SPP1+ macrophages and prognosis of cancer patients.

References

    1. Hanahan D, Coussens LM. Accessories to the crime: functions of cells recruited to the tumor microenvironment. Cancer Cell. 2012;21:309–322. - PubMed
    1. Hanahan D, Weinberg RA. Hallmarks of cancer: the next generation. Cell. 2011;144:646–674. - PubMed
    1. Pitt JM, et al. Targeting the tumor microenvironment: removing obstruction to anticancer immune responses and immunotherapy. Ann. Oncol. 2016;27:1482–1492. - PubMed
    1. Quail DF, Joyce JA. Microenvironmental regulation of tumor progression and metastasis. Nat. Med. 2013;19:1423–1437. - PMC - PubMed
    1. Meurette O, Mehlen P. Notch signaling in the tumor microenvironment. Cancer Cell. 2018;34:536–548. - PubMed

Publication types