. 2022 Nov 4;13(1):6647.
doi: 10.1038/s41467-022-34433-z.

2'-5' oligoadenylate synthetase‑like 1 (OASL1) protects against atherosclerosis by maintaining endothelial nitric oxide synthase mRNA stability

Affiliations

2'-5' oligoadenylate synthetase‑like 1 (OASL1) protects against atherosclerosis by maintaining endothelial nitric oxide synthase mRNA stability

Tae Kyeong Kim et al. Nat Commun. .

Abstract

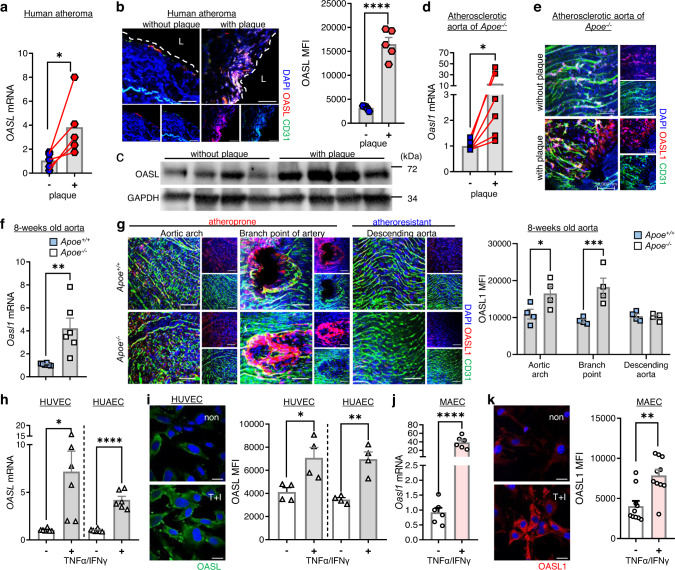
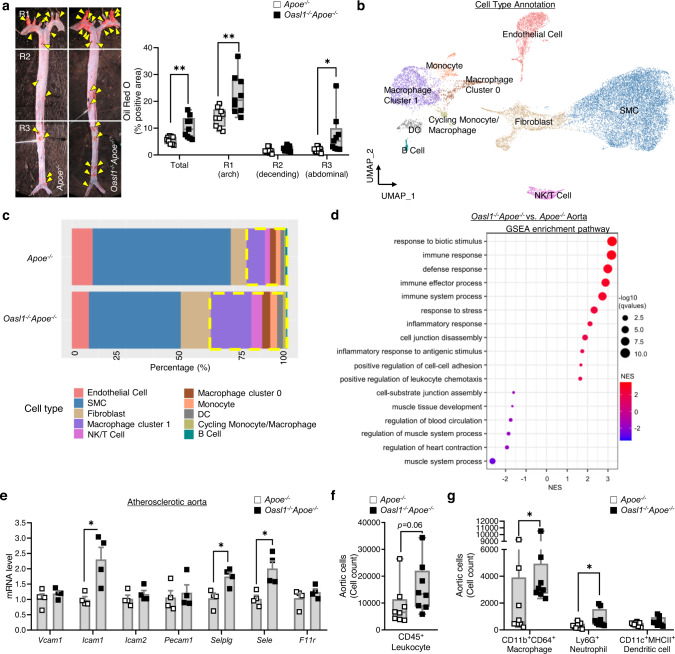
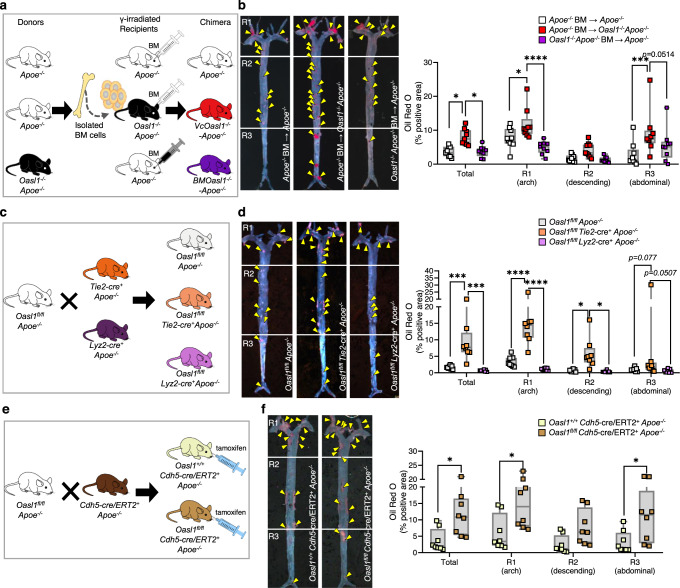
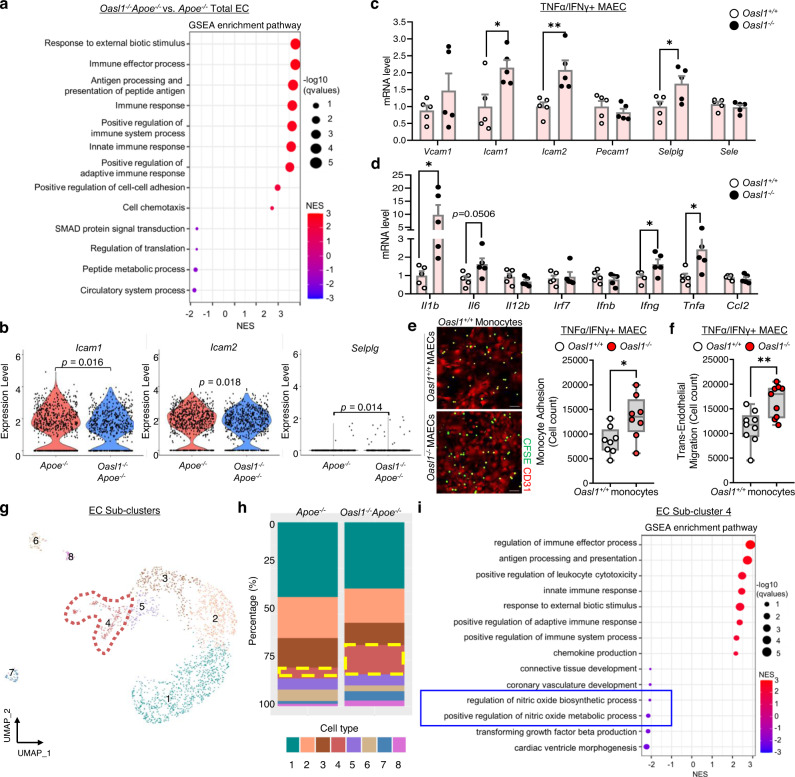
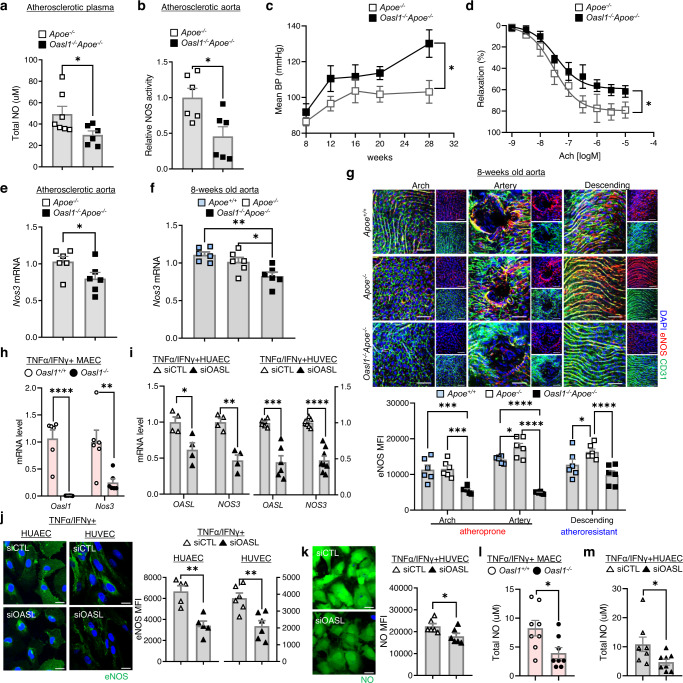
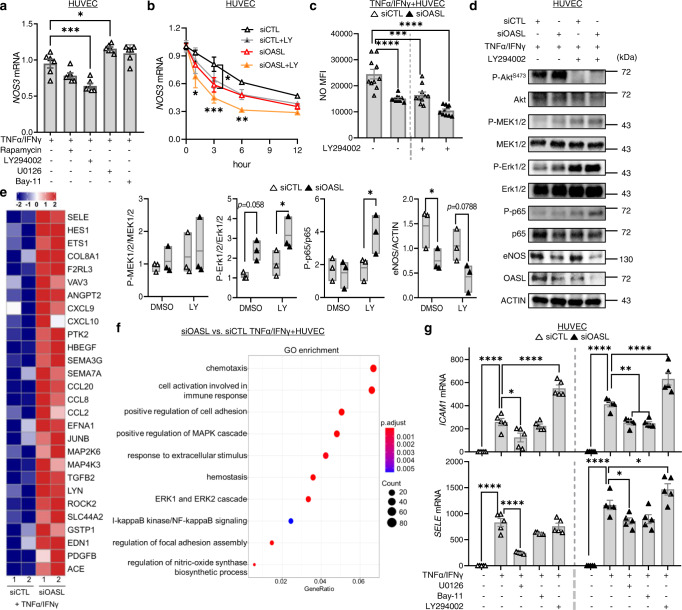
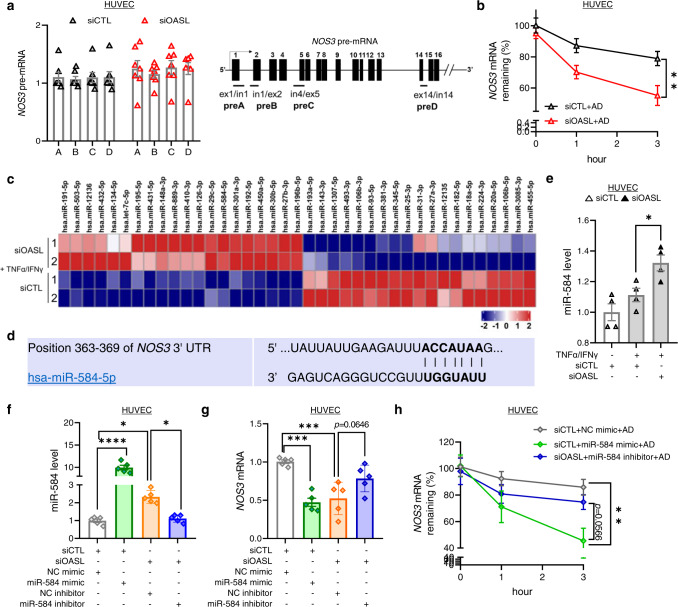
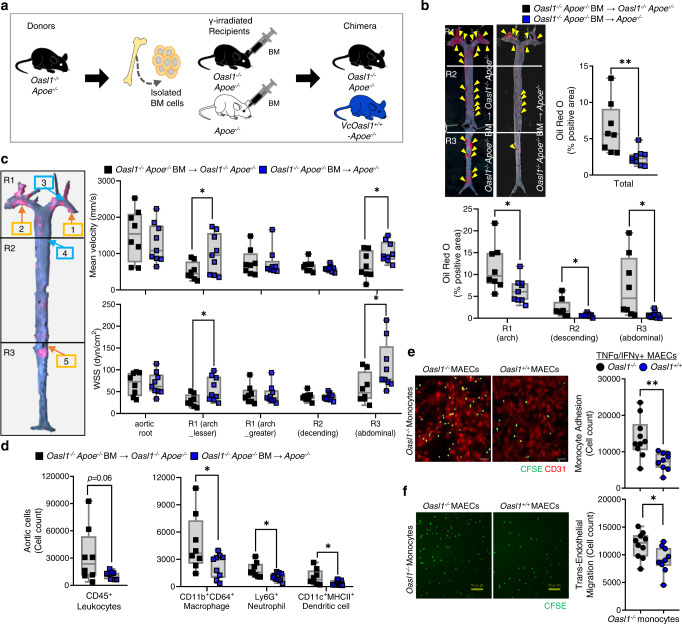
Endothelial nitric oxide synthase (eNOS) decreases following inflammatory stimulation. As a master regulator of endothelial homeostasis, maintaining optimal eNOS levels is important during cardiovascular events. However, little is known regarding the mechanism of eNOS protection. In this study, we demonstrate a regulatory role for endothelial expression of 2'-5' oligoadenylate synthetase-like 1 (OASL1) in maintaining eNOS mRNA stability during athero-prone conditions and consider its clinical implications. A lack of endothelial Oasl1 accelerated plaque progression, which was preceded by endothelial dysfunction, elevated vascular inflammation, and decreased NO bioavailability following impaired eNOS expression. Mechanistically, knockdown of PI3K/Akt signaling-dependent OASL expression increased Erk1/2 and NF-κB activation and decreased NOS3 (gene name for eNOS) mRNA expression through upregulation of the negative regulatory, miR-584, whereas a miR-584 inhibitor rescued the effects of OASL knockdown. These results suggest that OASL1/OASL regulates endothelial biology by protecting NOS3 mRNA and targeting miR-584 represents a rational therapeutic strategy for eNOS maintenance in vascular disease.


Conflict of interest statement

The authors declare no competing interests.

Figures

Fig. 1
Fig. 1. Expression of human OASL and murine OASL1 are increased in athero-prone aortic ECs.
ac Human atheroma tissues with or without plaques were used to measure OASL expression. a OASL mRNA levels (p = 0.0463, n = 5) were measured by quantitative PCR. b Left: Immunofluorescence (IF) staining of OASL protein and CD31+ ECs (p < 0.0001, n = 5 per group). Right: Quantitation of mean fluorescence intensity (MFI). Scale bar, 50 μm. L, lumen. (c) Western blot analysis of OASL expression (n = 4 per group). d, e Atherosclerotic aortas were isolated from Apoe−/− mice fed a normal chow diet (NCD) for 28 weeks. Oasl1 mRNA levels (p = 0.0313, n = 6) (d) and en face IF staining for OASL1 and CD31+ aortic ECs (n = 5 per group) (e) in matched aortic specimens with and without plaques are shown. Scale bar, 50 μm. f, g Aorta tissues were isolated from Apoe+/+ and Apoe−/− mice fed an NCD for 8 weeks. f mRNA levels of Oasl1 in aortas of each group (p = 0.0055, n = 6 per group) as measured by quantitative PCR. g Left: En face IF staining for OASL1 and CD31+ ECs in athero-prone or athero-resistant regions. Right: Quantitation of MFI (arch: p = 0.036, branch: p = 0.0008, descending: p = 0.9994, n = 4 per group). Scale bar, 50 μm. h, i OASL mRNA level (HUVEC: p = 0.017, HUAEC: p < 0.0001, n = 6 per group) (h) and immunocytochemical detection of OASL protein (HUVEC: p = 0.0222, HUAEC: p = 0.0017, n = 4 per group) (i) in HUVECs and HUAECs stimulated with TNFα and IFNγ. Scale bar, 20 μm. j, k Oasl1 mRNA level (p < 0.0001, n = 6 per group) (j) and immunocytochemical detection of OASL1 expression (p = 0.001, n = 10 per group) (k) in MAECs stimulated with TNFα and IFNγ. Scale bar, 20 μm. Data in b, e, g, i and k are representative of at least 3 independent experiments. Data are presented as the means ± SEMs (*p ≤ 0.05, **p ≤ 0.01, ***p ≤ 0.001, ****p ≤ 0.0001; a, two-sided paired t-test; d, two-sided Wilcoxon matched-pairs signed rank test; b, f, hk, two-sided unpaired Student’s t-test; g, two-way ANOVA with Sidak’s test for multiple comparisons). Source data are provided as a Source Data file.
Fig. 2
Fig. 2. Oasl1 deficiency increases endothelial dysfunction, leading to vascular inflammation and leukocyte infiltration into the lesion.
Apoe−/− and Oasl1−/−Apoe−/− mice were fed a normal chow diet (NCD) for 28 weeks to allow atherosclerotic conditions to develop. a Left: Oil red O-stained lesions in whole aortas. Right: Quantitation of stained areas in en face preparations (Total: p = 0.0040, R1: p = 0.0071, R2: p = 0.1175, R3: p = 0.0484, n = 9 per group). Yellow arrowhead: plaque in aorta. bd Analysis of the transcriptomes of single cells from atherosclerotic aortas using the 10x Genomics platform. b Uniform manifold approximation and projection (UMAP) plot of 20,876 total aortic cells, colored by clusters. c Bar graphs showing the relative proportion of each cell type per group. d Dot plot showing Gene Set Enrichment Analysis (GSEA) according to the normalized enrichment score (NES) for Gene Ontology (GO) terms of aortas from Oasl1−/−Apoe−/− versus Apoe−/− mice. e Quantitative PCR analysis of the adhesion-related molecules in atherosclerotic aortas (Vcam1, Pecam1, F11r: p = 0.4857, Icam1, Selplg, Sele: p = 0.0286, Icam2: p = 0.2000, n = 4 per group). f, g Flow cytometry of single cells obtained from atherosclerotic aortas (n = 8 per group), including total leukocytes (f) and macrophages (p = 0.0499), neutrophils (p = 0.0433), and dendritic cells (DC; p = 0.1755) (g). Data in a are representative of each group. a, f and g, Box plots are shown as median of each value and the interquartile range (IQR, the range between the 25th and 75th percentiles); whiskers indicate 1.5 times the IQR. Data are presented as the means ± SEMs (*p ≤ 0.05, **p ≤ 0.01; a, f and g, two-sided unpaired Student’s t-test; e, two-sided Mann-Whitney U test). Source data are provided as a Source Data file.
Fig. 3
Fig. 3. Vascular EC-specific Oasl1 deficiency exacerbates atherosclerotic plaque formation.
a, b Apoe−/− and Oasl1−/−Apoe−/− recipient mice, reconstituted with bone marrow (BM) from Apoe−/− mice or Oasl1−/−Apoe−/− mice, after γ-irradiation were fed a normal chow diet (NCD) for 28 weeks. a Experimental scheme. b Left: Oil red O-stained lesions in en face preparations of whole aortas (p = 0.0145; p = 0.0148, n = 9 per group). Yellow arrowhead: plaque in aorta. Right: Quantitation of oil red O-stained areas in the whole aorta and separate regions, including the aortic arch (R1; p = 0.0212; p < 0.0001), descending (R2; p = 0.2079; p = 0.1467) and abdominal (R3; p = 0.0002) regions. c, d Oasl1fl/fl Apoe−/−, Oasl1fl/fl Tie2-cre+ Apoe−/− and Oasl1fl/fl Lyz2-cre+ Apoe−/− mice were fed a NCD for 28 weeks. (c) Experimental scheme. d Left: Oil red O-stained lesions in en face preparations of whole aortas (p = 0.0009; p = 0.0002, n = 8 per group). Yellow arrowhead: plaque in aorta. Right: Quantitation of Oil red O-stained areas in the whole aorta and separate regions (R1: p < 0.0001; p < 0.0001, R2: p = 0.0257; p = 0.0175). e, f Oasl1+/+ Cdh5-cre/ERT2+ Apoe−/− and Oasl1fl/fl Cdh5-cre/ERT2+ Apoe−/−mice were fed a western diet (WD) for 13 weeks. e Experimental scheme. f Left: Oil red O-stained lesions in en face preparations of whole aortas (p = 0.0220, n = 8 per group). Yellow arrowhead: plaque in aorta. Right: Quantitation of Oil red O-stained areas in the whole aorta and separate regions (R1: p = 0.0106, R2: p = 0.1934, R3: p = 0.0231). Data in left panels in b, d, and f are representative of each group. b, d, and f, Box plots are shown as median of each value and the IQR; whiskers indicate 1.5 times the IQR. Data are presented as means ± SEMs (*p ≤ 0.05, **p ≤ 0.01, ***p ≤ 0.001, ****p ≤ 0.0001; b and d, two-way ANOVA with Tukey’s test; f, two-way ANOVA with Sidak’s test for multiple comparisons). Source data are provided as a Source Data file.
Fig. 4
Fig. 4. Oasl1 deficiency down-regulates NO synthesis and promotes endothelial inflammation.
a Dot plot showing Gene Set Enrichment Analysis (GSEA) according to normalized enrichment score (NES) for Gene Ontology (GO) terms of the total EC cluster from Oasl1−/−Apoe−/− mice versus that of Apoe−/− mice. b Violin plot showing a comparison of the adhesion molecules, Icam1, Icam2, and Selplg, in the aortic EC cluster of Oasl1−/−Apoe−/− versus Apoe−/− mice. c, d Quantitative PCR analysis of the adhesion molecules, Vcam1 (p = 0.2965), Icam1 (p = 0.0264), Icam2 (p = 0.0080), Pecam1 (p = 0.4082), Selplg (p = 0.0362), and Sele (p = 0.3979) (c), and the proinflammatory genes, Il1b (p = 0.0486), Il6 (p = 0.0506), Il12b (p = 0.2400), Irf7 (p = 0.7404), Ifnb (p = 0.4914), Ifng (p = 0.0477), Tnfa (p = 0.047) and Ccl2 (p = 0.5093) (d) in MAECs isolated from Oasl1+/+ and Oasl1−/− mice and stimulated with TNFα and IFNγ (n = 5 per group). e Assay of CFSE-labeled Oasl1+/+ monocyte adhesion to TNFα- and IFNγ-stimulated MAECs isolated from Oasl1+/+ and Oasl1−/− mice (p = 0.0194, n = 8 per group). Scale bar, 50 μm. f Transendothelial migration assay of Oasl1+/+ monocyte movement across activated Oasl1+/+ and Oasl1−/− MAECs (p = 0.0044, n = 9 per group). gi Among the total aortic cells, 2,121 aortic ECs were subclustered after performing a dimensionality reduction and were newly separated considering transcriptional similarity within the 2 experimental groups. g UMAP plot showing the distribution of eight defined endothelial sub-clusters. h Bar graph showing cell distribution according to genotype across the cell clusters. i Dot plot showing GSEA according to NES for GO terms of subclustered EC 4 derived from atherosclerotic aortas. Data in e are representative of each group. e and f, Box plots are shown as median of each value and the IQR; whiskers indicate 1.5 times the IQR. Data are presented as means ± SEMs (*p ≤ 0.05, **p ≤ 0.01; bf, two-sided unpaired Student’s t-test). Source data are provided as a Source Data file.
Fig. 5
Fig. 5. Oasl1 deficiency promotes endothelial dysfunction by reducing the levels of Nos3 mRNA.
ae Apoe−/− and Oasl1−/−Apoe−/− mice were fed a normal chow diet (NCD) for 28 weeks to allow atherosclerotic conditions to develop. Total nitric oxide (NO) levels in plasma (p = 0.0442, n = 7 for Apoe−/−, n = 6 for Oasl1−/−Apoe−/−) (a) and NOS enzymatic activity in atherosclerotic aortas (p = 0.0156, n = 6 per group) (b), as measured by the Griess method. c Mean blood pressure (BP) change measured using tail-cuff techniques (p = 0.0063, n = 7 per group). d The cumulative vascular relaxation response of the aortic rings to acetylcholine (Ach) as measured by myography (p = 0.0350, n = 4 per group). e Quantitative PCR analysis of Nos3 mRNA in aorta tissues (p = 0.0318, n = 6 per group). f–g eNOS expression detected at multiple levels in the aortas of 8-week-old Apoe+/+, Apoe−/− and Oasl1−/−Apoe−/− mice. f Nos3 mRNA as measured by quantitative PCR (p = 0.0029; p = 0.0413, n = 6 per group). g Top: En face IF staining of eNOS protein in CD31+ ECs (arch: p = 0.9877; p = 0.0004; p = 0.0002, branch: p = 0.0472; p < 0.0001; p < 0.0001, descending: p = 0.0306; p = 0.1017; p < 0.0001, n = 6 per group). Bottom: Quantitation of the corresponding MFI results. Scale bar, 50 μm. h Quantitative PCR analysis of Oasl1 and Nos3 mRNA levels in MAECs isolated from Oasl1+/+ and Oasl1−/− mice and stimulated with TNFα and IFNγ (Oasl1: p < 0.0001, Nos3: p = 0.0087, n = 6 per group). i–k HUAECs and HUVECs were transfected with non-targeting siRNA (siCTL) or OASL-targeting siRNA (siOASL) followed by stimulation with TNF-α and IFN-γ. i OASL and NOS3 mRNA levels as measured by quantitative PCR (n = 4 for OASL: p = 0.0192, NOS3: p = 0.0011 in HUAEC; n = 6 for OASL: p = 0.0002, n = 8 for NOS3: p < 0.0001 in HUVEC). j Left: Immunocytochemical detection of eNOS. Scale bar, 20 μm. Right: Quantitation of corresponding MFI values (p = 0.0014, n = 4 for HUAEC; p = 0.0014, n = 6 for HUVEC). k Left: Immunocytochemical detection of NO. Scale bar, 20 μm. Right: Quantitation of corresponding MFI values (p = 0.0343, n = 6 per group). l, m Total NO was determined by ELISA using the Griess reaction in the supernatant of MAECs isolated from Oasl1+/+ and Oasl1−/− mice (p = 0.0214, n = 8 per group) (l) and HUAECs transfected with siCTL or siOASL (p = 0.0382, n = 8 per group) (m). Data in g, j, and k are representative of at least 5 independent experiments. Data are presented as means ± SEMs (*p ≤ 0.05, **p ≤ 0.01, ***p ≤ 0.001, ****p ≤ 0.0001; a, b, e, and hm, two-sided unpaired Student’s t-test; c, two-way ANOVA with Sidak’s test; f, one-way ANOVA with Tukey’s test; g, two-way ANOVA with Tukey’s test for multiple comparisons; Nonlinear fit data in d was calculated using a Sigmoidal dose-response). Source data are provided as a Source Data file.
Fig. 6
Fig. 6. Endothelial OASL knockdown reduces NOS3 expression via the PI3K/Akt-dependent pathway.
a, b Quantitative RT-PCR analysis of NOS3 mRNA in HUVECs pretreated with the mTOR inhibitor, rapamycin, PI3K inhibitor, LY294002, ERK 1/2 inhibitor, U0126, or the NF-κB inhibitor, Bay-11 (20 μmol/L for each) for 1 h before stimulation with TNF-α and IFN-γ for 3 h (LY: p = 0.0003, U: p = 0.0206, n = 6 per group) (a), or pretreated with the PI3K inhibitor, LY294002 (LY), transfected with siCTL or siOASL, and monitored over time (siCTL vs. siOASL 3 h: p = 0.0472; siCTL vs. siOASL+LY 1 h: p = 0.0146, 3 h: p = 0.0003, 6 h: p = 0.0036, n = 4 per group) (b). c, d siCTL- or siOASL-transfected HUVECs were pretreated with the PI3K inhibitor, LY294002 (20 μmol/L), and stimulated with TNF-α and IFN-γ. c Quantitation of MFI values for DAF-DM diacetate staining of nitric oxide (NO; p < 0.0001; p = 0.0004; p < 0.0001, n = 10 per group). d Right: Western blot analysis of Akt, Erk1/2, NF-κB (p65), and eNOS expression. Left: Quantitation of band density (P-ERK1/2: p = 0.0355, P-p65: p = 0.0407, eNOS: p = 0.0478). e, f Bulk RNA-seq analysis performed on siCTL- or siOASL-transfected HUVECs stimulated with TNFα and IFNγ (n = 2 per group). e Heatmap showing different gene expression patterns between the two groups. f Gene ontology (GO) enrichment analysis of dysregulated biological processes in OASL-KD HUVECs. g Quantitative PCR analysis of the adhesion molecules, ICAM1 (siCTL DMSO: p < 0.0001; U: p = 0.0330; LY: p < 0.0001, siOASL DMSO: p < 0.0001; U: p = 0.0055; Bay: p = 0.0034; LY: p < 0.0001) and SELE (siCTL DMSO: p < 0.0001; U: p < 0.0001, siOASL DMSO: p < 0.0001; U: p = 0.0399; LY: p = 0.0498), in siCTL- or siOASL-transfected HUVECs pretreated with the MEK1/2 inhibitor, U0126, the NF-κB inhibitor, Bay-11, or PI3K inhibitor, LY294002 (20 μmol/L each), for 1 h before stimulation with TNF-α and IFN-γ (n = 5 per group). Data in d are representative of 3 independent experiments. d, Box plots are shown as median of each value and the IQR. Data are presented as the means ± SEMs (*p ≤ 0.05, **p ≤ 0.01, ***p ≤ 0.001, ****p ≤ 0.0001; a, one-way ANOVA with Bonferroni’s test; b, c and g, two-way ANOVA with Tukey’s test; d two-way ANOVA with Sidak’s test for multiple comparisons; f, one-sided Fisher’s exact test). Source data are provided as a Source Data file.
Fig. 7
Fig. 7. Endothelial OASL contributes to NOS3 mRNA stability by regulating NOS3-targeting miRNAs.
a NOS3 pre-mRNA levels measured by detecting primary transcripts isolated from siCTL- or siOASL-transfected HUVECs (n = 7 per group). b qRT-PCR–based analysis of NOS3 mRNA stability in siCTL- or siOASL-transfected HUVECs (3 h: p = 0.0035, n = 7 for siCTL+AD; n = 8 for siOASL+AD). NOS3 mRNA was measured over time in the presence of actinomycin D (AD), which was added to block transcription. c microRNA (miRNA)-seq analysis performed on HUVECs transfected with siCTL or siOASL and stimulated with TNF-α and IFN-γ (n = 2 per group), depicted as a heatmap showing differences in miRNA expression patterns between the two groups. d The miR-584-5p binding site within the NOS3 3ʹ-UTR region as predicted by TargetScan. e qRT-PCR analysis of miR-584 expression in siCTL- or siOASL-transfected HUVECs stimulated with TNF-α and IFN-γ (p = 0.0399, n = 4 per group). f–h qRT-PCR analysis of miR-584 levels (p < 0.0001; p = 0.0185; p = 0.0348, n = 4 per group) (f), NOS3 mRNA (p = 0.0002; p = 0.0007, n = 4 per group) (g) and NOS3 mRNA stability in the presence of AD (3 h: p = 0.0057, n = 5 for NC mimic, miR-584 inhibitor; n = 7 for miR-584 mimic) (h) in siCTL- or siOASL-transfected HUVECs, post-transfected with 80 nM of negative control (NC) mimic, miR-584 mimic, NC inhibitor, or miR-584 inhibitor. Data are presented as means ± SEMs (*p ≤ 0.05, **p ≤ 0.01, ***p ≤ 0.001, ****p ≤ 0.0001; a, b and h, two-way ANOVA with Tukey’s test; e–g, one-way ANOVA with Tukey’s test for multiple comparisons). Source data are provided as a Source Data file.
Fig. 8
Fig. 8. Endothelial OASL1 attenuates leukocyte recruitment and lesion formation.
ad Rescue effects of Oasl1 in vascular cell types were assessed by reconstituting γ-irradiated Oasl1−/−Apoe−/− and Apoe−/− mice with bone marrow (BM) from Oasl1−/−Apoe−/− mice followed by a normal chow diet (NCD) for 28 weeks (n = 8 for Oasl1−/−Apoe−/−; n = 9 for VcOasl1+/+-Apoe−/−). a Experimental scheme. b Left panel: Oil red O-stained lesions in whole aortas. Yellow arrowhead: plaque in aorta. Right panel: Quantification of stained en face area. Bottom panel: Separate quantitation of Oil red O+ areas in aortic arch (R1), descending (R2) and abdominal (R3) regions (Total: p = 0.0058, R1: p = 0.0203, R2: p = 0.0310, R3: p = 0.0159). c Blood flow velocity (top) and endothelial wall shear stress (WSS; bottom) at the athero-resistant greater curvature, descending and athero-prone lesser curvature, or abdominal branching point of arteries were assessed in age-matched 20-week-old mice prior to identification of plaque formation by serial echocardiography (velocity R1 (lesser): p = 0.0421, R3: p = 0.0383; WSS R1 (lesser): p = 0.0283, R3: p = 0.0478). d Flow cytometry analysis of single cells including total leukocytes, macrophages, neutrophils, and DCs, isolated from atherosclerotic aortas (Macrophage: p = 0.0499, Neutrophil: p = 0.0204, DC: p = 0.0427). e Assay of CFSE-labeled Oasl1−/− monocyte adhesion on TNFα- and IFNγ-stimulated MAECs isolated from Oasl1−/− and Oasl1+/+ mice (p = 0.0028, n = 10 per group). Scale bar, 50 μm. f Transendothelial migration assay of Oasl1−/− monocyte movement across TNFα- and IFNγ-stimulated Oasl1−/− and Oasl1+/+ MAECs (p = 0.0198, n = 10 per group). Scale bar, 100 μm. Data in b, e, and f are representative of each group. b–f, Box plots are shown as median of each value and the IQR; whiskers indicate 1.5 times the IQR. Data are presented as means ± SEMs (*p ≤ 0.05, **p ≤ 0.01, ***p ≤ 0.001; bf, two-sided unpaired Student’s t-test). Source data are provided as a Source Data file.

References

    1. Weber C, Noels H. Atherosclerosis: current pathogenesis and therapeutic options. Nat. Med. 2011;17:1410–1422. - PubMed
    1. Davignon, J. & Ganz, P. Role of Endothelial Dysfunction in Atherosclerosis. Circulation109, III-27-III-32 (2004). - PubMed
    1. Libby P, Ridker PM, Hansson GK. Progress and challenges in translating the biology of atherosclerosis. Nature. 2011;473:317–325. - PubMed
    1. Gimbrone MA, Jr., Garcia-Cardena G. Endothelial cell dysfunction and the pathobiology of atherosclerosis. Circ. Res. 2016;118:620–636. - PMC - PubMed
    1. Förstermann U, Sessa WC. Nitric oxide synthases: regulation and function. Eur. Heart J. 2011;33:829–837. - PMC - PubMed

Publication types

MeSH terms