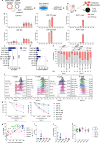
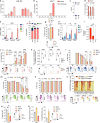
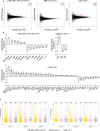
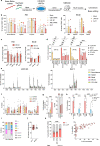
Fig. 8. RNA-mediated base editing of the −200 region of HBG promoters in repopulating HSCs.
a Experimental protocol of HSPC xenotransplantation in NBSGW mice. G-CSF-mobilized HD HSPCs or non-mobilized SCD HSPCs were subjected to RNA-mediated base editing. A BE mRNA and a chemically modified sgRNA were co-transfected in HSPCs and cells were xenotransplanted into NBSGW immunodeficient mice. b Engraftment of human cells in NBSGW mice transplanted with control (mock-transfected, transfected with CBE or ABE mRNA alone) and edited (LRF 8C or KLF1) mobilized HD or SCD HSPCs [HD: n = 4 (mock, CBE mRNA, LRF 8C, ABE mRNA), n = 3 (KLF1) mice per group; SCD: n = 3 (mock), n = 2 (LRF 8C), n = 5 (KLF1) mice per group] 16 to 20 weeks post-transplantation. Engraftment is represented as a percentage of human CD45+ cells in the total murine and human CD45+ cell population, in bone marrow (BM), spleen, thymus, and peripheral blood. Each data point represents an individual mouse. Data are expressed as mean ± SEM. c Human hematopoietic progenitor content in BM human CD45+ cells derived from mice transplanted with control and edited HSPCs [HD: n = 4 (mock), n = 3 (CBE), n = 4 (LRF 8C), n = 3 (ABE), n = 2 (KLF1) mice per group; SCD: n = 5 (mock), n = 1 (LRF 8C), n = 2 (KLF1) mice per group]. We plotted the percentage of human CD45+ cells giving rise to BFU-E and CFU-GM. Data are expressed as mean ± SEM. d C-G to T-A or A-T to G-C base-editing efficiency, calculated by the EditR software, in input, bone marrow-, spleen-, BFU-E-, CFU-GM-, and peripheral blood-derived HD and SCD human samples subjected to Sanger sequencing. Data are expressed as mean ± SEM [HD-LRF 8 C: n = 3 (Input) biologically independent experiments, n = 4 (bone marrow and blood), n = 3 (spleen, BFU-E, CFU-GM) mice per group; HD-KLF1: n = 3 (Input) biologically independent experiments, n = 3 (bone marrow and spleen), n = 2 (BFU-E, CFU-GM and Blood) mice per group; SCD-LRF 8C: n = 2 (Input) biologically independent experiments, n = 2 (bone marrow, spleen and blood), n = 1 (BFU-E and CFU-GM) mice per group; SCD-KLF1: n = 2 (Input) biologically independent experiments, n = 6 (bone marrow and spleen), n = 2 (BFU-E and CFU-GM), n = 5 (Blood) mice per group]. The frequency of base editing in input cells was calculated in cells cultured in the HSPC medium (pointing-up triangle), in liquid erythroid cultures (rhombus), BFU-E (square) and CFU-GM (pointing-down triangle) colonies. Each data point (circle) represents an individual mouse. HD/LRF8C: **P = 0.021 for bone marrow, or P = 0.0094 for spleen, or P = 0.0037 for BFU-E, or P = 0.0059 for CFU-GM, or P = 0.0042 for Blood. HD/KLF1: *P = 0.0136; **P = 0.0065; ***P = 0.0009. SCD/LRF8C: **P = 0.0056 for Bone marrow, or P = 0.012 for BFU-E; ***P = 0.0004 for Spleen, or P = 0.0010 for CFU-GM, or P = 0.0001 for Blood. SCD/KLF1: **P = 0.0040; ***P = 0.0009; ****P ≤ 0.0001 (two-way ANOVA with Dunnett correction for multiple comparisons). e Base-editing profile for LRF 8C and KLF1 samples, calculated using EditR software, in input, bone marrow-, spleen- and peripheral blood-derived human samples subjected to Sanger sequencing. Data are expressed as mean ± SEM [LRF 8C: n = 5 (Input) biologically independent experiments, n = 6 (bone marrow and blood), n = 5 (spleen and CFU-GM), n = 4 (BFU-E) mice per group; KLF1: n = 5 (Input) biologically independent experiments, n = 9 (Bone Marrow and Spleen), n = 8 (Blood) n = 4 (BFU-E and CFU-GM) mice per group]. f Frequency of InDels, measured by TIDE analysis, in input, bone marrow-, spleen- and peripheral blood-derived human samples subjected to Sanger sequencing. Data are expressed as mean ± SEM [Input: n = 7 (Control), n = 5 (LRF 8C and KLF1) biologically independent experiments; Bone Marrow: n = 11 (Control), n = 6 (LRF 8C), n = 9 (KLF1) mice per group; Spleen: n = 11 (Control), n = 5 (LRF 8C), n = 9 (KLF1) mice per group; Blood: n = 11 (Control), n = 4 (LRF 8C), n = 8 (KLF1) mice per group; BFU-E: n = 9 (Control), n = 4 (LRF 8C), n = 4 (KLF1) mice per group; CFU-GM: n = 10 (Control), n = 5 (LRF 8C), n = 4 (KLF1) mice per group]. g Frequency of the 4.9-kb deletion, measured by ddPCR, in input samples (left panel). Frequency of mice that bear the 4.9-kb deletion in bone marrow-derived human CD45+ cells (right panel). Data are expressed as mean ± SEM (n = 11 (control), n = 5 (LRF 8C and KLF1) biologically independent experiments for left panel and n = 6–9 mice per group for right panel). ***P = 0.0002 (ordinary one-way ANOVA with Dunnett correction for multiple comparisons). h A-T to G-C base-editing efficiency at on- and off-target sites, calculated by the EditR software, in input, bone marrow- and spleen-derived HD and SCD human samples subjected to Sanger sequencing. Data are expressed as mean ± SEM [ctr: n = 3 biologically independent experiments; Input: n = 3 (HD), n = 2 (SCD) biologically independent experiments; BM: n = 3 (HD), n = 6 (ON), n = 5 (OT4) mice per group]. ns P = 0.5920 for HD, or P > 0.9999 for SCD; *P = 0.0104; **P = 0.0033 (two-way ANOVA with Dunnett correction for multiple comparisons). i Base editing in single BFU-E colonies derived from engrafting HD HSPCs, calculated by the EditR software. We plotted the frequency of BFU-E with 0, 1, 2, 3, or 4 edited HBG promoters, the frequency of BFU-E with 0, 1 or 2 edited OT4 alleles and the frequency of BFU-E edited only at HBG promoters or OT4 or at both HBG promoters and OT4 (n = 42 BFU-E obtained from 2 different mice). j Frequency of chromosome 11 loss, as indicated by the ratio of CARS (p arm) and PODL1 (q arm), measured by ddPCR, for edited or control (AAVS1) single BFU-E colonies (KLF1 n = 29 biologically independent colonies; AAVS1 n = 6 biologically independent colonies; 1 donor). k RT-qPCR analysis of β-like globin mRNA levels in bone marrow-derived BFU-E. β-like globins mRNA expression was normalized to α-globin mRNA. Data are expressed as mean ± SEM [n = 7 (Mock), n = 3 (ABE mRNA), n = 4 (KLF1) biologically independent experiments; HD (black circles) and SCD (empty circles) samples]. ****P ≤ 0.0001 (two-way ANOVA with Sidak correction for multiple comparisons). l Correlation between γ-globin mRNA relative expression and base-editing efficiency in bone marrow-derived single BFU-E (n = 69). γ-globin mRNA expression was normalized to α-globin mRNA and expressed as a percentage of the total β- and γ- globin mRNA. Base-editing efficiency was calculated by the EditR software in samples subjected to Sanger sequencing (R2 = 0.4263, Y = 0.5328*X + 51.81, P < 0.0001 non-zero slope significance; simple linear regression). Source data are provided as a Source Data file.