. 2022 Nov 4;8(1):116.
doi: 10.1038/s41523-022-00485-z.

Sensory nerves enhance triple-negative breast cancer invasion and metastasis via the axon guidance molecule PlexinB3

Affiliations

Sensory nerves enhance triple-negative breast cancer invasion and metastasis via the axon guidance molecule PlexinB3

Thanh T Le et al. NPJ Breast Cancer. .

Abstract

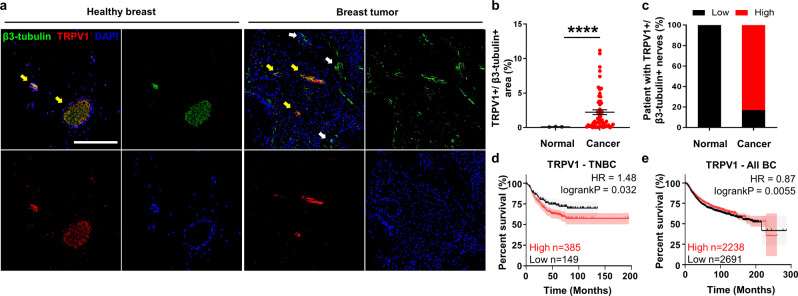
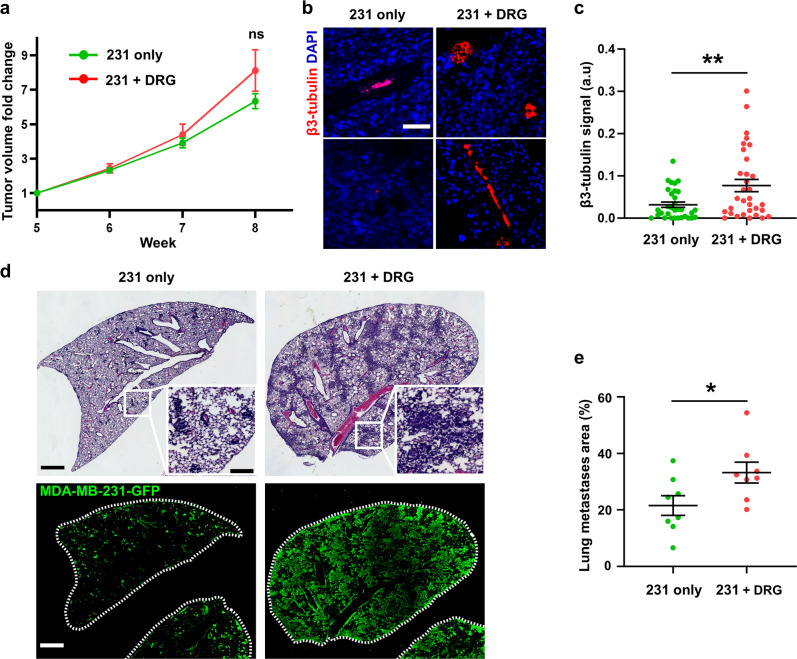
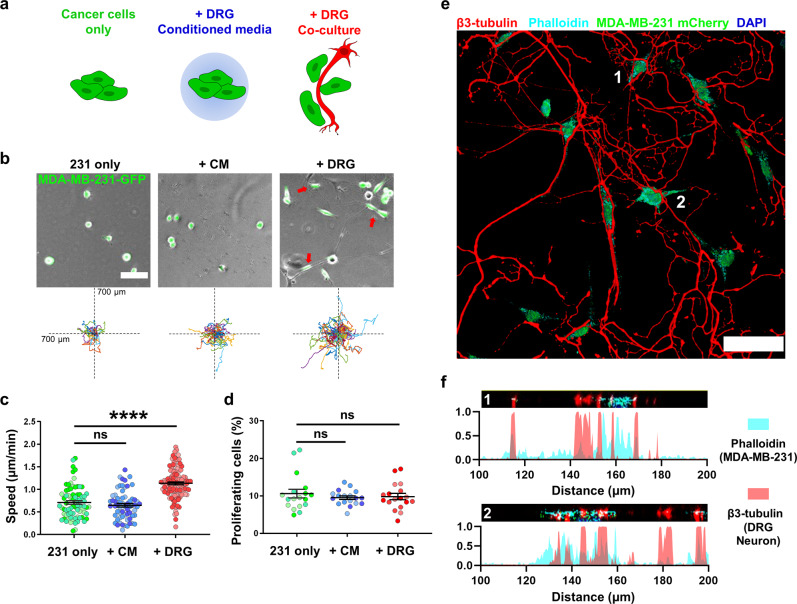
In breast cancer, nerve presence has been correlated with more invasive disease and worse prognosis, yet the mechanisms by which different types of peripheral nerves drive tumor progression remain poorly understood. In this study, we identified sensory nerves as more abundant in human triple-negative breast cancer (TNBC) tumors. Co-injection of sensory neurons isolated from the dorsal root ganglia (DRG) of adult female mice with human TNBC cells in immunocompromised mice increased the number of lung metastases. Direct in vitro co-culture of human TNBC cells with the dorsal root ganglia (DRG) of adult female mice revealed that TNBC cells adhere to sensory neuron fibers leading to an increase in migration speed. Species-specific RNA sequencing revealed that co-culture of TNBC cells with sensory nerves upregulates the expression of genes associated with cell migration and adhesion in cancer cells. We demonstrated that lack of the semaphorin receptor PlexinB3 in cancer cells attenuate their adhesion to and migration on sensory nerves. Together, our results identify a mechanism by which nerves contribute to breast cancer migration and metastasis by inducing a shift in TNBC cell gene expression and support the rationale for disrupting neuron-cancer cell interactions to target metastasis.


Conflict of interest statement

The authors declare no competing interests.

Figures

Fig. 1
Fig. 1. Sensory nerves are abundant in TNBC tumor tissue.
a Immunostaining of human breast tissue from a tissue microarray stained for β3-tubulin, TRPV1, and nuclei. White arrows show β3-tubulin+ nerve fibers, yellow arrows show sensory nerve fibers positive for both TRPV1 and β3-tubulin (TRPV1+/β3-tubulin+), scale bar denoting 200 μm. b Quantification of TRPV1+ and β3-tubulin+ sensory nerve area relative to tumor area (****p < 0.0001, significance was determined by unpaired t test with Welch’s correction). c Percent patients with high levels of TRPV1+/β3-tubulin+ sensory nerve presence. d Kaplan–Meier curve of TNBC patients comparing outcomes for patients with low or high TRPV1 mRNA expression. e Kaplan–Meier curve of all breast cancer patients comparing outcomes for patients with low or high TRPV1 mRNA expression.
Fig. 2
Fig. 2. DRG sensory neurons increased metastasis in vivo.
a Tumor volume of mice injected with GFP tagged MDA-MB-231 cells alone or in combination with DRG sensory neurons measured over time, n = 8 for each group. b Representative images of immunostaining of mammary tumors for β3-tubulin and nuclei with DAPI, scale bar denoting 50 μm. c Quantification of β3-tubulin signal intensity (a.u - arbitrary unit, n = 30 field of views across 8 animals). d Upper: H&E staining of lung in injected mice, scale bar denoting 1000 μm with insert showing higher magnification view of individual metastases, scale bar denoting 200 μm. Lower: immunostaining of lung metastasis in injected mice stained for anti-GFP antibody, scale bar denoting 1000 μm. e Quantification of GFP+ area in lung. Data show mean ± SEM. Significance was determined by unpaired student’s t test (*p = 0.038, **p < 0.01).
Fig. 3
Fig. 3. DRG sensory neurons in co-culture increase MDA-MB-231 TNBC cell migration in vitro.
a Schematic for experimental setup. b Representative images and Rose plots displaying the migration track of GFP-tagged 231 cells over 16 h, red arrows denoting cells attached to neuron fibers, scale bar denoting 100 μm. c 2D migration speed of 231 cells, each point represents the average speed of one tracked cell over 16h, n ≥ 150 cells per condition. d Quantification of 231 cells undergoing proliferation in tracking period, each point represents a field of view, n ≥ 10 per condition. Data show mean ± SEM. Different shades of color represent cells from different biological replicates. Significance was determined by one-way ANOVA. (**p < 0.01, ****p < 0.0001). e Immunostaining of m-Cherry tagged 231 co-cultured with DRG, with β3-tubulin staining for neuron fiber and Phalloidin staining for F-actin. Volume was constructed using 5 μm z-stacks with 0.5 μm step size, scale bar denoting 50 μm. f Orthogonal slices of cells numbered 1,2 in e (black bar) with plots showing normalized fluorescent signal intensity of Phalloidin and β3-tubulin signal. Distance represents distance across image slice.
Fig. 4
Fig. 4. MDA-MB-231 cells undergo a significant change in expression profile when co-cultured with DRG sensory neurons.
a Principal component analysis of 231 cells gene expression shows distinct clustering among three conditions. b Heat map clustering of differentially expressed genes compared to control. c Enrichment score for dysregulated pathways in 231 cells cultured with DRG conditioned media. d Enrichment score for dysregulated pathways in 231 cells cultured with DRG. e Left: Overlap of differentially expressed genes in 231 co-cultured and 231 in conditioned media, with respect to their enriched pathways, right: the ratio of DRG co-culture/conditioned media gene expression fold change for overlapped genes, with each point representing a gene.
Fig. 5
Fig. 5. PlexinB3-Sema5A signaling regulates the nerve-cancer crosstalk.
a Read count of PlexinB3 and Sema5A in 231 cells and neurons (***p < 0.001, significance was determined by EdgeR package). b PlexinB3 expression in various breast cancer subtypes, data taken from TCGA. c Representative images of 231-Cas9 and 231-sgPLXB3 cells, scale bar denoting 100 μm. d Aspect ratio of 231-Cas9 and 231-sgPLXB3 cells, each point represents a cell, n ≥ 500 cells per condition. e 2D migration speed of 231-Cas9 and 231-sgPLXB3 #1 and #2 cells, each point represents the average speed of one tracked cell, n ≥ 150 cells per condition. f Schematic for proposed PlexinB3-Sema5A interaction. Different shades of color represent cells from different biological replicates. Data show mean ± SEM. Significance was determined by one-way ANOVA (* = 0.034, **p < 0.01, ****p < 0.0001).

Similar articles

Cited by

References

    1. Batsakis JG. Nerves and neurotropic carcinomas. Ann. Otol. Rhinol. Laryngol. 1985;94:426–427. - PubMed
    1. Pundavela J, et al. Nerve fibers infiltrate the tumor microenvironment and are associated with nerve growth factor production and lymph node invasion in breast cancer. Mol. Oncol. 2015;9:1626–1635. - PMC - PubMed
    1. Albo D, et al. Neurogenesis in colorectal cancer is a marker of aggressive tumor behavior and poor outcomes. Cancer. 2011;117:4834–4845. - PubMed
    1. Ayala GE, et al. Cancer-related axonogenesis and neurogenesis in prostate cancer. Clin. Cancer Res. 2008;14:7593–7603. - PubMed
    1. Shao JX, et al. Autonomic nervous infiltration positively correlates with pathological risk grading and poor prognosis in patients with lung adenocarcinoma. Thorac. Cancer. 2016;7:588–598. - PMC - PubMed