. 2022 Nov 4;12(1):18694.
doi: 10.1038/s41598-022-23339-x.

Intrinsic host susceptibility among multiple species to intranasal SARS-CoV-2 identifies diverse virological, biodistribution and pathological outcomes

Affiliations

Intrinsic host susceptibility among multiple species to intranasal SARS-CoV-2 identifies diverse virological, biodistribution and pathological outcomes

Neil Berry et al. Sci Rep. .

Abstract

SARS-CoV-2 exhibits a diverse host species range with variable outcomes, enabling differential host susceptibility studies to assess suitability for pre-clinical countermeasure and pathogenesis studies. Baseline virological, molecular and pathological outcomes were determined among multiple species-one Old World non-human primate (NHP) species (cynomolgus macaques), two New World NHP species (red-bellied tamarins; common marmosets) and Syrian hamsters-following single-dose, atraumatic intranasal administration of SARS-CoV-2/Victoria-01. After serial sacrifice 2, 10 and 28-days post-infection (dpi), hamsters and cynomolgus macaques displayed differential virus biodistribution across respiratory, gastrointestinal and cardiovascular systems. Uniquely, New World tamarins, unlike marmosets, exhibited high levels of acute upper airway infection, infectious virus recovery associated with mild lung pathology representing a host previously unrecognized as susceptible to SARS-CoV-2. Across all species, lung pathology was identified post-clearance of virus shedding (antigen/RNA), with an association of virus particles within replication organelles in lung sections analysed by electron microscopy. Disrupted cell ultrastructure and lung architecture, including abnormal morphology of mitochondria 10-28 dpi, represented on-going pathophysiological consequences of SARS-CoV-2 in predominantly asymptomatic hosts. Infection kinetics and host pathology comparators using standardized methodologies enables model selection to bridge differential outcomes within upper and lower respiratory tracts and elucidate longer-term consequences of asymptomatic SARS-CoV-2 infection.


Conflict of interest statement

The authors declare no competing interests.

Figures

Figure 1
Figure 1
Study plan parameters. (A) Study outline for evaluation of SARS-CoV-2 in multiple species. Major termination time-points of A, B and C at 2, 10 and 28 days post-infection (dpi) respectively; vertical blue arrows indicate sampling frequencies. At termination, tissues taken for analysis were lung, trachea, oesophagus, olfactory bulb, tongue, tonsil, salivary gland LN, salivary gland, aorta, heart, kidney, liver, MLN, PLN-LN, spleen, rectum, small intestine, large intestine. (B) weight loss profiles in female and male hamsters as percentage weight change from baseline (day of challenge) over 28 days (females, red) and 11 days (males, black). SE bars indicated; (C, D) clinical score comparison between female and male hamsters respectively; (E) strong linear relationship between SARS-CoV-2 E-gene genomic RNA (gRNA) expressed as log10 IU/mL against subgenomic (sg) Orf7 RNA levels expressed as log10 copies/mL in 51 combined nasal and oral swabs over the first 10 days of Vic-01 infection.
Figure 2
Figure 2
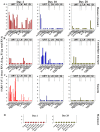
Infectivity and shedding profiles of SARS-CoV-2/Vic-01 in four independent species. (A, B) Comparative shedding outcomes in nasal and oral/mouth swabs in female hamsters followed over the time course. SARS-CoV-2 genomic RNA levels expressed as Log10 International Units (IU)/mL calibrated against the WHO International Standard for SARS-CoV-2 RNA (NIBSC# 20/146/Eng02) amplified with E gene primers in nasal and oral swabs monitored over the 28 day time-course. Qualitative microculture data using VeroE6/TMPRSS2 indicator cells shown in squares as green (no virus) and red (positive virus culture) at the times indicated. Red bars indicate positive antigen lateral flow device result where sampled. (C, D) Subgenomic (sg) RNA levels expressed as copies/mL in female hamsters over the acute period. (E, F) Genomic (g) and subgenomic RNA levels in faecal pellets recovered daily over the first 10 days in female hamsters. Comparable nasal and oral swab data are shown for the 3 NHP species: cynomolgus macaques (G, H), tamarins (I, J) and marmosets (K, L). Culture data are similarly indicated by red or green squares and lateral flow device result by red or green bars where sampled.
Figure 3
Figure 3
Anatomical biodistribution of SARS-CoV-2 genomic RNA. Multiple tissue extracts analysed for SARS-CoV-2 RNA expressed as Log10 International Units (IU)/µg total RNA. (A) female hamsters compared across the 2, 10 and 28 dpi time-course in multiple tissues from upper respiratory tract (URT), lung (L), lymphatic organs (LN), major abdominal organs (AO) and the gastrointestinal tract (GI); (B) cynomolgus macaque and (C) tamarins with a comparable set of tissues as indicated. (D) marmosets assayed at days 2 and 28 for a range of upper airway tissues and lung. Bars indicate tissues analysed which varied slightly across species; vertical bars up to the limit of detection of log10 20 IU/µg total RNA indicate where a tissue was analysed but a negative result returned.
Figure 4
Figure 4
Detection and localisation of SARS-CoV-2 and sub-gross histopathological lesions in lung tissue. (A) RNAscope, nucleoprotein and spike protein detection in hamster lung sections across the 2, 10 and 28 day time-course. (B) sub-gross pathologic analysis of lung sections at each time point indicated. Brown labelling indicates nucleoprotein in lesions taken as a focus of infection of SARS-CoV-2. Day 2, RCau (right caudal), RCra (right cranial); day 10 RCau (right caudal), RMid (right middle). Labelling intensity indicated by red bars (high), orange bars (intermediate) and yellow bars (low) for IHC panels.
Figure 5
Figure 5
Comparative histopathological outcomes in lung section across the time-course of four species. Haematoxylin and eosin (H&E) staining of representative sections of lung tissue for: (A) female hamster lungs showing multifocally extensive alveolar wall congestion and mild to moderate protein-rich alveolar oedema. Foci of interstitial pneumonia with type II pneumocyte hyperplasia, and infiltrates of mixed inflammatory cells, including neutrophils, and single cell necrosis. (B) cynomolgus macaque; (S44, d28) diffuse, marked flooding of alveolar spaces with protein-rich oedema. (C) tamarin lung (e.g. S110, d28) typified by multifocal alveolar wall degeneration and necrosis with multifocal organising fibrin exudation. Alveolar wall necrosis, abundant fibrin exudation and hyaline membrane formation. (D) marmoset, showing multifocally extensive alveolar wall necrosis, intra-alveolar fibrin exudation and haemorrhage at day 28 (S74). Alveolar wall necrosis, abundant fibrin exudation and early hyaline membrane formation were present. Bar represents 50 µM.
Figure 6
Figure 6
Comparative pathology scores in four species across the time-course. (A) histopathology outcome heat map scores in each species: 0 = minimal, 1 = mild, 2 = moderate, > 3 = marked. (BE) percentage adjusted scores of overall pathology for each of alveolar wall necrosis, alveolar inflammation, bronchiolar inflammation and type 2 pneumocyte hyperplasia across the time-course for each of the four species. Cyno cynomolgus macaque, RBT red-bellied tamarin. Heat map graphics generated using GraphPad Prism version 9.3 software.
Figure 7
Figure 7
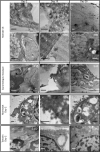
Tokuyasu cryo sections of lung tissue. At day 2 in hamster lungs (S62), virions (white open arrowheads) were visualised (A) and associated with perinuclear replication organelles (dotted ellipses) (B). At 10 dpi (S65) SARS-CoV-2 virion-like particles were further identified in lung tissue (C) with evidence of possible budding (D). Differences in morphology between infected cells and cells without current infection are apparent in hamster S60 extending out to 28 dpi (E) with replication organelles visible in infected cells (bottom cell). (F) (S60) is a higher magnification of E showing the replication organelle and mitochondria (black open arrowheads) with evidence of disrupted cristae indicating more generalised disrupted cell ultrastructure. (GI) cynomolgus macaques S48, S46, S45 at days 2, 10 and 28 respectively. Virions shown (day10) with evidence of disrupted mitochondria 28dpi (panel I). (JL) membrane-associated virions identified in marmoset S76 2 dpi. (M, N), tamarin lung S112 at day 2 with evidence of virions associated with a replication organelle. (O) uninfected hamster lung (S90) displays long sections of endoplasmic reticulum (er) in the perinuclear region. Magnifications range from 6000 × to 25,000 × with all scale bars corresponding to 500 nm. Annotations correspond to white open arrowheads, virions; black open arrowheads, mitochondria; and dotted ellipses, replication organelle. White asterisk, back asterisk and er denote collagen fibrils, nucleus and endoplasmic reticulum respectively.
Figure 8
Figure 8
Time-course of anti-SARS-CoV-2 responses across species. Anti-RBD antibodies detected by the Genscript surrogate competition ACE-2 neutralisation (C-ACE-2) assay expressed as percentage inhibition (relative units) for (A) female hamsters, (B) cynomolgus macaque, (C) tamarin, (D) marmoset 0-28dpi. Dotted lines indicate assay cut-off of specific reactivity. (E) Log10 end-point titers measured in hamster sera by C-ACE-2 assay, (F) titres by microneutralisation assay (MNA) 10 and 28 days post-infection for hamsters (blue), cynomolgus macaques (red), tamarins (dark green) and for marmosets at day 28 (light green).

References

    1. Andersen KG, Rambaut A, Lipkin WI, Holmes EC, Garry RF. The proximal origin of SARS-CoV-2. Nat. Med. 2020;26(4):450–452. - PMC - PubMed
    1. Muñoz-Fontela C, Dowling WE, Funnell SGP, Gsell PS, Riveros-Balta AX, Albrecht RA, Andersen H, Baric RS, Carroll MW, Cavaleri M, Qin C, Crozier I, Dallmeier K, de Waal L, de Wit E, Delang L, Dohm E, Duprex WP, Falzarano D, Finch CL, Frieman MB, Graham BS, Gralinski LE, Guilfoyle K, Haagmans BL, Hamilton GA, Hartman AL, Herfst S, Kaptein SJF, Klimstra WB, Knezevic I, Krause PR, Kuhn JH, Le Grand R, Lewis MG, Liu WC, Maisonnasse P, McElroy AK, Munster V, Oreshkova N, Rasmussen AL, Rocha-Pereira J, Rockx B, Rodríguez E, Rogers TF, Salguero FJ, Schotsaert M, Stittelaar KJ, Thibaut HJ, Tseng CT, Vergara-Alert J, Beer M, Brasel T, Chan JFW, García-Sastre A, Neyts J, Perlman S, Reed DS, Richt JA, Roy CJ, Segalés J, Vasan SS, Henao-Restrepo AM, Barouch DH. Animal models for COVID-19. Nature. 2020;586(7830):509–515. - PMC - PubMed
    1. Callender LA, Curran M, Bates SM, Mairesse M, Weigandt J, Betts CJ. The impact of pre-existing comorbidities and therapeutic interventions on COVID-19. Front. Immunol. 2020;11:1991. - PMC - PubMed
    1. Tao K, Tzou PL, Nouhin J, Gupta RK, de Oliveira T, Kosakovsky Pond SL, Fera D, Shafer RW. The biological and clinical significance of emerging SARS-CoV-2 variants. Nat. Rev. Genet. 2021;1:1–17. - PMC - PubMed
    1. Damas J, Hughes GM, Keough KC, Painter CA, Persky NS, Corbo M, Hiller M, Koepfli KP, Pfenning AR, Zhao H, Genereux DP, Swofford R, Pollard KS, Ryder OA, Nweeia MT, Lindblad-Toh K, Teeling EC, Karlsson EK, Lewin HA. Broad host range of SARS-CoV-2 predicted by comparative and structural analysis of ACE-2 in vertebrates. Proc. Natl. Acad. Sci. USA. 2020;117(36):22311–22322. - PMC - PubMed

Publication types