. 2022 Nov 4;5(1):1187.
doi: 10.1038/s42003-022-04126-w.

Relay and higher-order thalamic nuclei show an intertwined functional association with cortical-networks

Affiliations

Relay and higher-order thalamic nuclei show an intertwined functional association with cortical-networks

Vinod Jangir Kumar et al. Commun Biol. .

Abstract

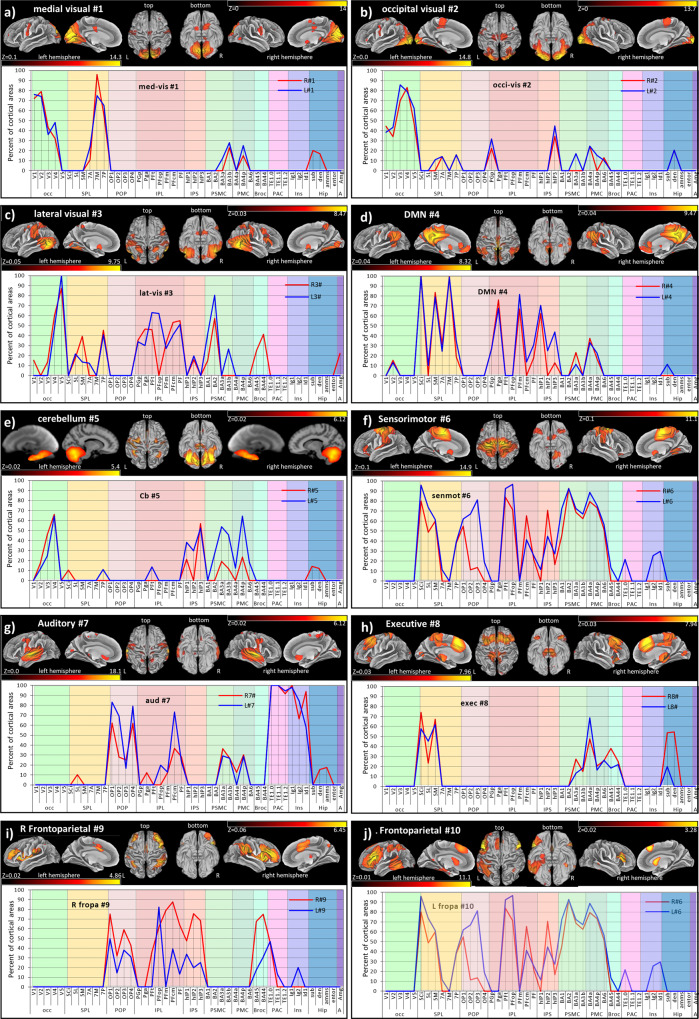
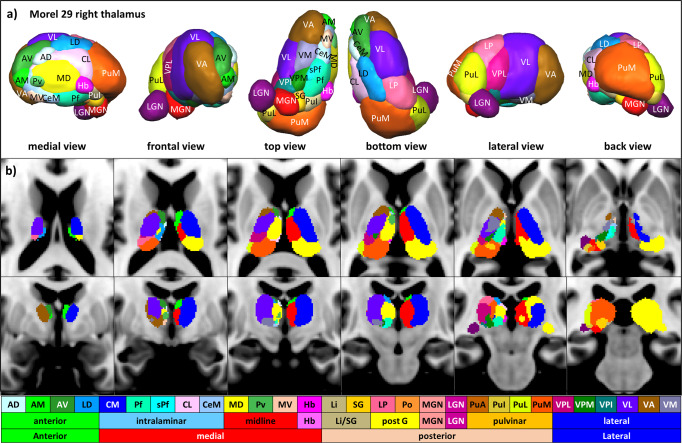
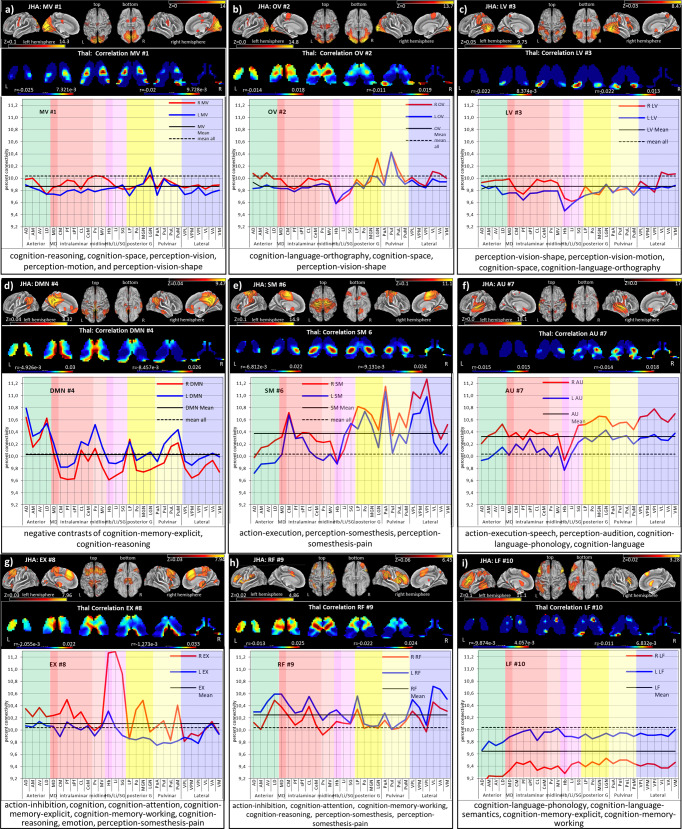
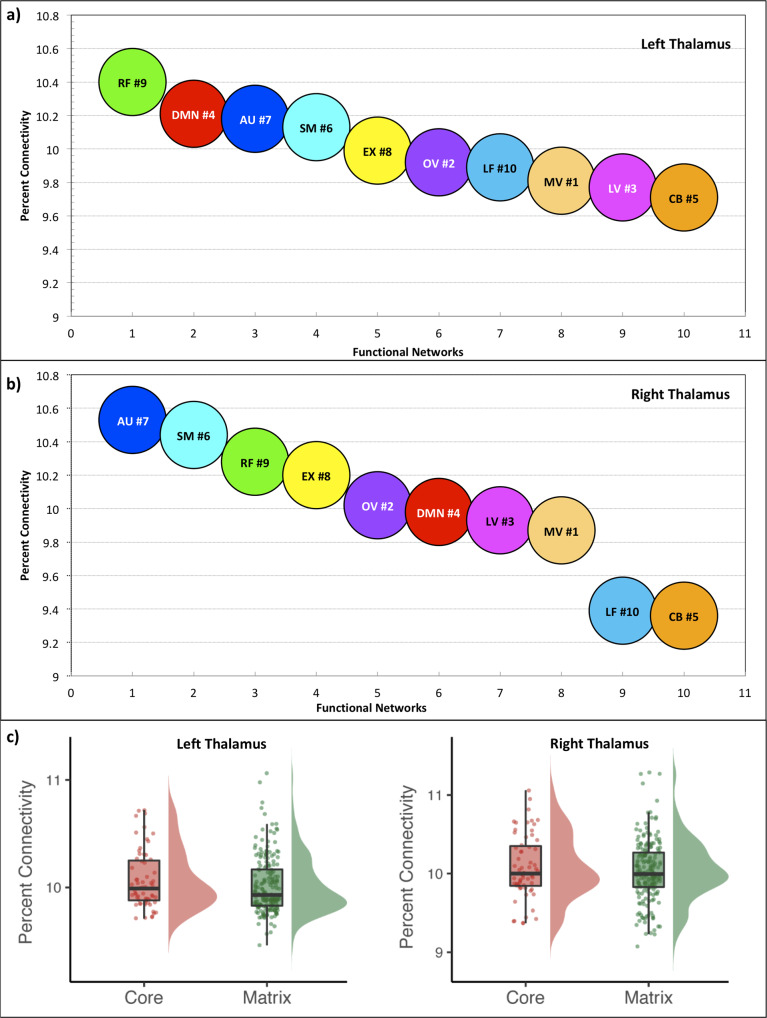
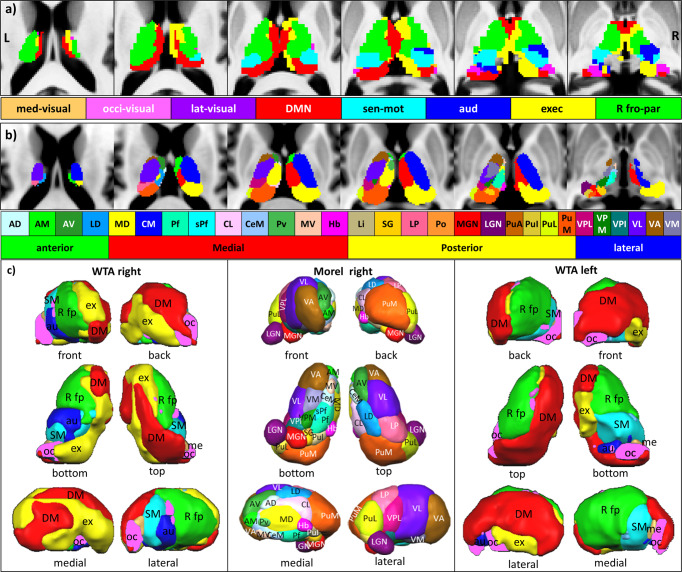
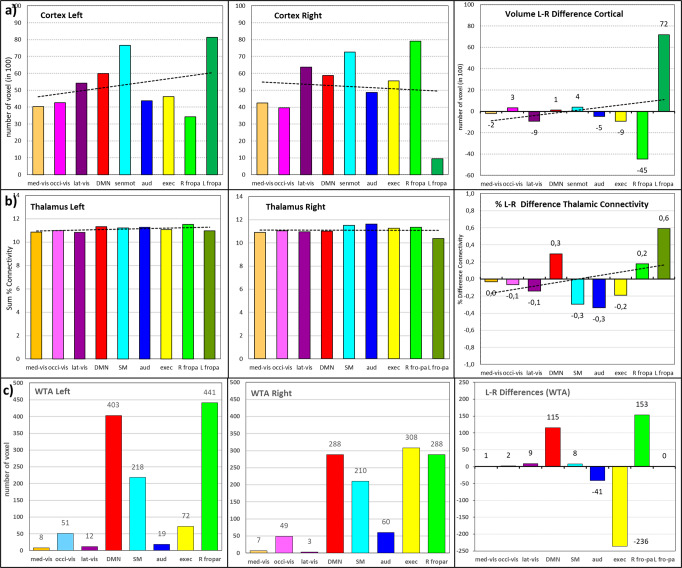
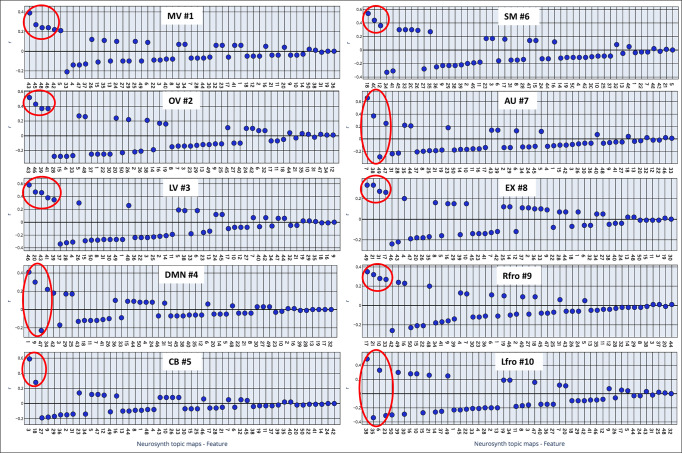
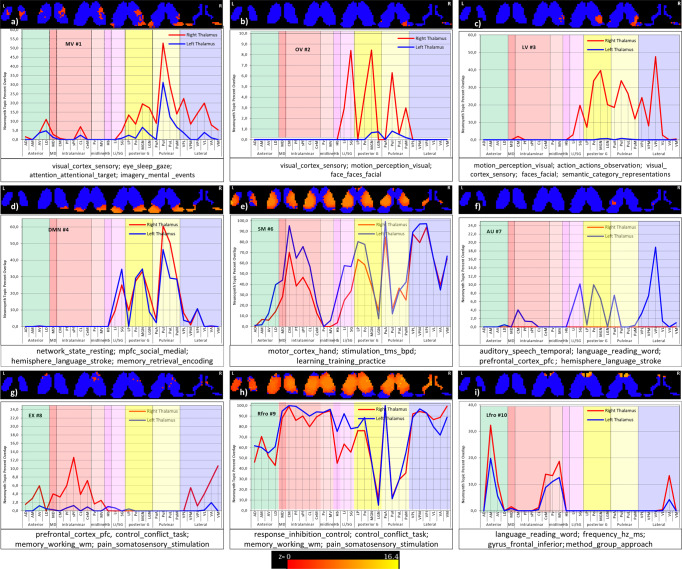
Almost all functional processing in the cortex strongly depends on thalamic interactions. However, in terms of functional interactions with the cerebral cortex, the human thalamus nuclei still partly constitute a terra incognita. Hence, for a deeper understanding of thalamic-cortical cooperation, it is essential to know how the different thalamic nuclei are associated with cortical networks. The present work examines network-specific connectivity and task-related topical mapping of cortical areas with the thalamus. The study finds that the relay and higher-order thalamic nuclei show an intertwined functional association with different cortical networks. In addition, the study indicates that relay-specific thalamic nuclei are not only involved with relay-specific behavior but also in higher-order functions. The study enriches our understanding of interactions between large-scale cortical networks and the thalamus, which may interest a broader audience in neuroscience and clinical research.


Conflict of interest statement

The authors declare no competing interests.

Figures

Fig. 1
Fig. 1. Cytoarchitectonic Characterization of Smith-10 brain maps.
Surface views (top) and plotted percent overlap (bottom) of cortical areas according to the Jülich Histology atlas (bottom), which covered ≥10%. The X-axis depicts the cortical areas within the Jülich atlas. For Abbreviations: see Supplementary Table 1 (which includes all overlaps). The Y-axis indicates the percent overlap of the functional network with the atlas labels in the Jülich atlas. The color scale (z) of the visualized RSN aligned brain maps: a MV: Left, 0.1–14.3 right 0–14; b OV: Left, 0–14.8 right 0 13.7; c LV: Left, 0.05–9.75 right 0.03–8.47; d DMN: Left 0.04–8.32, right 0.04–9.47; e CB: Left 0.02–5.4, right 0.02–6.12; f SM: Left 0.1–14.9, right 0.1–11.1; g AU: Left 0–18.1, right 0–17; h EX: Left 0.03–7.96, right 0.03–7.94; i RF: Left 0.02–4.86, right 0.06–6.45; j LF: Left 0.1–11.1, right 0.02–3.28.
Fig. 2
Fig. 2. Anatomy of the thalamus.
a 3D Rendered views of 29 thalamic nuclei of Morel’s histological atlas with abbreviations. b Depiction of thalamic nuclei and nuclei groups of the Morel atlas six axial and coronal views (Krauth et al.). The nuclei depiction is color-coded with respect to each nucleus. The detailed color assignments in hex color code: AD (CBFFFF), AM (41FB30), AV (359430), LD (1AA0FC), MD (FFFC38), CM (002CFB), Pf (3FFDB6), sPf (3CFEFE), CL (FDCAFE), CeM (98C9FD), Pv (52B755), MV (FDC8AC), Hb (F933FC), Li (C0B47F), SG (FECE30), LP (FA6897), Po (FC963F), MGN (FA141B), LGN (711172), PuA (C56419), PuI (DCC642), PuL (DCFC36), PuM (FA571F), VPL (C2187B), VPM (1C7F13), VPI (177877), VL (612DFB), VA (965B15), VM (797AA6).
Fig. 3
Fig. 3. Cortico-thalamic connectivity of 9 cortical RSN.
Each subplot depicts surface views of functional networks, Corresponding correlations maps of the thalamus, and percent connectivity thalamic nuclei; highly associated behavioral domains. Abbreviations are mentioned in Supplementary Table 4. See Supplementary Table 5 for the nuclei names. The color bar depicts the correlation maps within each network, i.e., the left and right color bars for the left and right thalamus. Scales according to the network specific maps are as following: a MV: Left −0.025 to 7.321e−3, right −0.02 to 9.728e−3; b OV: Left −0.014 to 0.018, right −0.011 to 0.019; c LV: Left −0.022 to 8.374e−3, right −0.022 to 0.013; d DMN: Left −4.926e−3 to 0.03, right −8.457e−3 to 0.026; e SM: Left −6.812e−3 to 0.022, right −9.131e−3 to 0.024; f AU: Left −0.015 to 0.015, right −0.014 to 0.018; g EX: Left −2.055e−3 to 0.022, right −1.273e−3 to 0.033; h RF: Left −0.013 to 0.025, right −0.022 to 0.024; i LF: Left −9.874e−3 to 4.057e−3, right −0.011 to 6.832e−3. The cortical maps’ color bar scales are also given in Fig. 1.
Fig. 4
Fig. 4. Ranking of network connectivity.
ab Depicted are the sum of percent contribution from all left and right thalamic nuclei within each cortical network sorted in descending order. Note: Right frontoparietal (RF) communicates strongest, while the cerebellum (CB) communicates least to the thalamus at rest. Interestingly, the three visual networks align almost next to each other. c Core and matrix nuclei percent connectivity of all functional networks: The raincloud plots show percent connectivity between the core and matrix nuclei values for all functional networks. Note: No significant differences exist between the groups. The raincloud takes input from the fixed effect maps of “n = 730 subjects.” The underline data are provided in the Supplementary Data 2 excel sheet. Box plot: left thalamus: quartiles (min 9.7100, lower quartile 9.8800, median 9.9900, upper quartile 10.2500, max 10.7200). right thalamus: quartiles (min 9.3700, lower quartile 9.8450, median 10.0000, upper quartile 10.3500, max 11.0600). The centerline in the box plot shows the medians, box limits indicate the 25th and 75th percentiles as determined by the R software, and whiskers extend 1.5 times the interquartile range from the 25th and 75th percentiles.
Fig. 5
Fig. 5. Winner-takes-it-all (WTA) maps.
a WTA maps of the right and left thalamus on six axial slices and b corresponding slices from the histology atlas of the thalamus. c 3D rendered views of WTA maps of the left and right thalamus in comparison with right thalamic nuclei of the atlas of Morel. The networks are depicted in their different colors. The color assignments in hex color code: MV (FDCB6E), OV (FA70FC), LV (971B99), DMN (FA141B), SM (3CFEFE), AU (002CFB), EX (FFFC38), RF (41FB30), LF (6A971B). The nuclei depiction is color-coded with respect to each nucleus. The detailed color assignments in hex color code: AD (CBFFFF), AM (41FB30), AV (359430), LD (1AA0FC), MD (FFFC38), CM (002CFB), Pf (3FFDB6), sPf (3CFEFE), CL (FDCAFE), CeM (98C9FD), Pv (52B755), MV (FDC8AC), Hb (F933FC), Li (C0B47F), SG (FECE30), LP (FA6897), Po (FC963F), MGN (FA141B), LGN (711172), PuA (C56419), PuI (DCC642), PuL (DCFC36), PuM (FA571F), VPL (C2187B), VPM (1C7F13), VPI (177877), VL (612DFB), VA (965B15), VM (797AA6).
Fig. 6
Fig. 6. Comparison of 6 WTA maps with histologically defined thalamus nuclei.
Top and bottom: the most apparent involvement of thalamic nuclei for six dominant RSN is depicted according to the Jülich Histology atlas. Surface views of cortical areas and their major functional assignments and corresponding thalamic nuclei exceeding ≥0. Two dice overlap (except for AU > 0.1) are shown. Middle: display of anatomy of thalamic nuclei according to Morel and WTA maps of the left and right hemispheres. The cortical maps’ color bar scales are also given in Fig. 1.
Fig. 7
Fig. 7. Hemispheric comparison.
a Number of voxels and L–R difference of nine cortical RSN (number of voxels in 100); b Hemispheric distribution and L–R differences of thalamic connectivity in percent; c Max, mean and minimum of hemispheric distribution and L–R differences of connectivity of all thalamic nuclei.
Fig. 8
Fig. 8. Large-scale functional networks associated with neurosynth topic maps.
The neurosynth topic-based meta-analyses (https://www.neurosynth.org/analyses/topics/) using standard topic modeling approach (Latent Dirichlet allocation—train a correlation decoder) to the abstracts or text of articles in the database revealed 50 topic maps. Each subplot represents a correlation between LDA 50 topic maps and the corresponding functional network. The X-axis shows the numbered topic maps in each subplot. The related names are separately listed in Supplementary Table 10. The Y-axis in each sub-plot depicts the decoded correlation with Smith-10 large-scale functional networks. The red circles indicate the highly correlated topics above >+0.2. Figure 9 shows the topics within the red circles and their anatomical assignments within the thalamus.
Fig. 9
Fig. 9. Large-scale functional network highly correlated neurosynth topic maps within thalamus: each subplot represents a functional network and its highly correlated topic maps (spatially overlaid on six different axial slices, depicting correlation maps with each network).
The topic maps were thresholded at z-value 3.1 (p value 0.001). The graph within each subplot depicts the percent nuclei overlap of highly correlated topic maps (marked in the red circle in the figure) with the thalamus. Color scale: same for all the maps (0–16.4) across all the networks. The blue color depicts the thalamus mask in the background. a MV #1: 43 visual_cortex_sensory; 45 eye_sleep_gaze; 48 attention_attentional_target; 42 imagery_mental_events; b OV #2: 43 visual_cortex_sensory; 46 motion_perception_visual; 41 face_faces_facial; c LV #3: 46 motion_perception_visual; 20 action_actions_observation; 43 visual_cortex_sensory; 41 face_faces_facial; 39 semantic_category_representations; d DMN #4: 1 network_state_resting; 9 mpfc_social_medial; 47 hemisphere_language_stroke; 34 memory_retrieval_encoding; e SM #6: 18 motor_cortex_hand; 40 stimulation_tms_bpd; 12 learning_training_practice; f AU #7: 7 auditory_speech_temporal; 38 language_reading_word; 49 prefrontal_cortex_pfc; 47 hemisphere_language_stroke; g EX #8: 49 prefrontal_cortex_pfc, 21 control_conflict_task; 30_decision_making_risk, 16_response_inhibition_control; h Rfro #9: 17 response_inhibition_control; 21 control_conflict_task; 10 memory_working_wm; 33 pain_somatosensory_stimulation; i Lfro #10: 38 language_reading_word; 35 frequency_hz_ms; 6 gyrus_frontal_inferior; 23 method_group_approach.
Fig. 10
Fig. 10. Analysis workflow.
Workflow summarized according to the performed steps. (1) The first analysis relates to the anatomical assignments of the Smith-10 maps. (2–6) Correlation analysis between large-scale functional networks (Smith-10) and thalamus. 2: The mentioned preprocessing steps outline the major steps in the graphical illustration. The HCP minimal processing pipeline includes a more detailed overview of the preprocessing workflow (see Figs. 7 and 8 in Glasser et al.), topic analysis of Smith-10, and visualizing highly correlated topics within the thalamus. Figures are designed using biorender.

References

    1. Sherman, S. M. in Progress in Brain Research Vol. 149 107–126 (Elsevier, 2005). - PubMed
    1. Sherman SM. The thalamus is more than just a relay. Curr. Opin. Neurobiol. 2007;17:417–422. - PMC - PubMed
    1. Sherman SM, Guillery RW. The role of the thalamus in the flow of information to the cortex. Philos. Trans. R. Soc. B Biol. Sci. 2002;357:1695–1708. - PMC - PubMed
    1. Sherman, S. M. & Guillery, R. W. in Exploring the Thalamus and Its Role in Cortical Function 253–286 (MIT Press, 2006).
    1. Liu J, et al. Frequency-selective control of cortical and subcortical networks by central thalamus. eLife. 2015;4:e09215. - PMC - PubMed

Publication types