. 2022 Nov;54(11):1702-1710.
doi: 10.1038/s41588-022-01210-z. Epub 2022 Nov 4.

DNA sequence and chromatin modifiers cooperate to confer epigenetic bistability at imprinting control regions

Affiliations

DNA sequence and chromatin modifiers cooperate to confer epigenetic bistability at imprinting control regions

Stefan Butz et al. Nat Genet. 2022 Nov.

Abstract

Genomic imprinting is regulated by parental-specific DNA methylation of imprinting control regions (ICRs). Despite an identical DNA sequence, ICRs can exist in two distinct epigenetic states that are memorized throughout unlimited cell divisions and reset during germline formation. Here, we systematically study the genetic and epigenetic determinants of this epigenetic bistability. By iterative integration of ICRs and related DNA sequences to an ectopic location in the mouse genome, we first identify the DNA sequence features required for maintenance of epigenetic states in embryonic stem cells. The autonomous regulatory properties of ICRs further enabled us to create DNA-methylation-sensitive reporters and to screen for key components involved in regulating their epigenetic memory. Besides DNMT1, UHRF1 and ZFP57, we identify factors that prevent switching from methylated to unmethylated states and show that two of these candidates, ATF7IP and ZMYM2, are important for the stability of DNA and H3K9 methylation at ICRs in embryonic stem cells.


Conflict of interest statement

The authors declare no competing interests.

Figures

Fig. 1
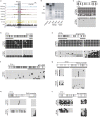
Fig. 1. Ectopic ICR sequences recapitulate chromatin states of endogenous ICRs.
a, Experimental overview of stable cell line generation with methylated or unmethylated donor plasmids using RMCE. b, Tabular summary of methylation analysis for all integrated ICRs, control DMR and promoter sequences. Endogenous methylation (Endog. meth.) describes the methylation state of the endogenous locus in mESCs. Mat., maternal methylation; Pat., paternal methylation; n/a, no methylation. Size, CpG density (in 100 bp) and GC content (%) are indicated. Total methylation percentages of DNA sequences integrated via RMCE measured by bsPCR is shown for experiments using unmethylated (− M.SssI) and premethylated (+ M.SssI) donor plasmids. n/d, not determined. Asterisks indicate measurements obtained from Lienert et al.. c, Detailed methylation analysis for the ectopic Airn ICR. CpG positions within the Airn ICR sequence are indicated with black vertical lines. Amplified regions for bsPCR are depicted, and single-molecule measurements are shown as black circles corresponding to methylated CpG dinucleotides and white circles to unmethylated CpG dinucleotides. CpG positions marked with ‘x’ correspond to unaligned nucleotides due to sequencing errors. Aggregated methylation values are displayed as color-coded vertical lines at the respective CpG position. d, ChIP-qPCR measurements at ectopic and endogenous ICRs compared to an intergenic site. H3K9me3, blue; H3K4me2, orange. Data points indicate individual technical replicates.
Fig. 2
Fig. 2. Maintenance of epigenetic memory at ICRs is sequence dependent in mESCs.
a, Tabular summary of methylation analysis for all Airn-ICR fragments schematically indicated on the left. In addition, fragment length, CpG densities and GC content is shown for each fragment. Same representation as in Fig. 1b. b, Methylation analysis for the shuffled Airn ICR. Same representation as in Fig. 1c. CpG positions marked with ‘x’ correspond to unaligned nucleotides due to sequencing errors. c, ChIP-qPCR measurements at the shuffled Airn ICR at the ectopic site compared to the endogenous Airn ICR. Data points show individual technical replicates. H3K9me3, blue; H3K4me2, orange. d, Methylation analysis for the shuffled Airn ICR with reconstituted ZFP57 binding sites. Same representation as in panel b. e, Methylation analysis for the shuffled Airn ICR integrated to murine erythroleukemia (MEL) cells shows maintenance of DNA methylation.
Fig. 3
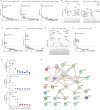
Fig. 3. Methylated ICR sequences repress nearby promoters in a sequence-dependent manner.
a, Schematic and experimental overview of reporter cell line generation using RMCE. b, Flow cytometric analysis of GFP expression 12 days after transfection with different premethylated ICR/promoter combinations. Each data point shows percentage of GFP-positive cells measurement from a clonally derived cell population. c, Flow cytometric analysis indicates percentage of GFP-positive cells in independent cell lines retrieving methylated or unmethylated RMCE donor plasmids containing the wild-type, shuffled Airn ICR or the shuffled Airn ICR with reconstituted ZFP57 sites in combination with the pEF1a promoter. GFP activity was measured at two consecutive time points (16 and 23 days). d, Flow cytometric analysis of three independent clones with the methylated Airn-CAG reporter after 2 days treatment with the DNA methylation inhibitor GSK-3484862 and untreated and DMSO controls. Measurements were repeated 7 days after washout of the drug to test for reversion of the reporter silencing. Same representation as in panel b.
Fig. 4
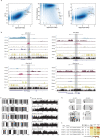
Fig. 4. CRISPR screens identify regulators of epigenetic memory at ICRs in mESCs.
a, Experimental overview of targeted CRISPR screens using multiple premethylated ICR reporters. Gating strategy is described in Extended Data Fig. 7a and Methods. b, Overview hits from CRISPR screens in three ICR reporter cell lines grown in serum conditions. Blue dots indicate genes with a P value < 0.01 calculated using MAGeCK RRA (robust rank aggregation). Dashed lines indicate the P value threshold at 0.05. c, Heatmap showing potential candidates from all CRISPR screens. Color indicates the summarized log fold change across all guides for a given gene, as determined by MAGeCK. Enrichments were calculated combining all replicates for one comparison, using the GFP-enriched fraction against the unsorted pool of cells. Asterisk indicates P < 0.05 using MAGeCK robust rank aggregation. See corresponding panel b and Extended Data Fig. 8b,d. Exact P values can be found in Supplementary Table 1.
Fig. 5
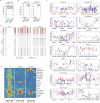
Fig. 5. ATF7IP and ZMYM2 colocalize to ICRs and contribute to DNA methylation and H3K9me3 maintenance in mESCs.
a, Genome browser snapshots for the Airn, Kcnq1ot1 and Peg10 ICRs used in the CRISPR screen experiments. ChIP-seq datasets indicate colocalization of ZFP57, ATF7IP, ZMYM2 and SETDB1 at the ICRs of interest. b, Heatmaps summarizing binding of ATF7IP, ZMYM2, ZFP57, SETDB1 and H3K9me3 10 kb (k) upstream and downstream at all annotated ICRs in the mouse genome. Shown are library-normalized reads per 20 bp. c, Left: schematic representation of biotin-proximity ligation setup to detect proteins at ZFP57-bound sites comparing ZFP57 fused to TurboID. LC MS/MS: liquid chromatography coupled to tandem mass spectrometry. Right: volcano plot showing enriched proteins and indicating statistically significant hits from a direct comparison between ZFP57-TurboID and TurboID-NLS (nTurboID). Statistically enriched proteins are indicated (false discovery rate (FDR)-corrected two-tailed t-test: FDR = 0.05, Artificial within groups variance (s0) = 1, n = 4 technical replicates). d, DNA methylation analysis at selected ICRs shows loss of methylation in Atf7ip-KO and Zmym2-KO cells (see Extended Data Fig. 10c for other ICRs). Shown are methylation values for individual CpGs obtained from WGBS in wild-type, Zmym2-KO or Atf7ip-KO cells. Genomic position of CpGs is indicated below. e, H3K9me3 ChIP-seq indicates loss of H3K9me3 at the selected ICRs (Extended Data Fig. 10e for other ICRs). Shown are reads per 100-bp windows. ICRs in the respective imprinting regions are indicated.
Extended Data Fig. 1
Extended Data Fig. 1. ICR sequences maintain pre-established methylation levels at an ectopic integration site.
a) Genome browser snapshot for the for the Airn ICR locus in mouse embryonic stem cells. Shown are ChIP-seq tracks for chromatin modifications, RNA-seq data for transcriptional activity, DHS-seq for chromatin accessibility, WGBS data for DNA methylation and local GC density in percent. The ICR sequence used for experiments is highlighted. b) Representative agarose gel for restriction digest of in vitro methylated and unmethylated plasmids prior to transfection. HpaII and MspI share the same recognition site, however HpaII is blocked by CpG methylation. Experiment was repeated at least twice prior to RMCE integration. Molecular size markers are indicated. c) Schematic overview of the ectopic integrated DNA fragment for H19 with vertical lines illustrating individual CpG sites (top) and single molecule measurements of DNA methylation of the pre-methylated and unmethylated sequences using bisulfite PCR (bottom). d-e) same as in (c): for Zrsr1 (d) and Kcnq1ot1 (e). f) Schematic overview of the ectopic integrated DNA fragment for the Igf2r gametic DMR with vertical lines illustrating individual CpG sites (top) and single molecule measurements of DNA methylation of the pre-methylated and unmethylated sequences using bisulfite PCR (bottom). g-i) same as in f: Hes3 (g), Syt1 (h), and Tcl1 (i). Unmethylated (- M.SssI) bisulphite data for g-i was obtained from Lienert et al. and shown for comparison. Source data
Extended Data Fig. 2
Extended Data Fig. 2. Stable methylation maintenance at ectopic ICRs.
a) Summary table for the methylation analysis of the Airn ICR after long term culture (over 20 consecutive passages), random integration to a different genomic site, during differentiation to neuronal progenitor cells (NPCs), or after culturing in 2i for 10 days. b-d) Single molecule measurements from bisulfite PCR corresponding to data summarized in a. e) Methylation analysis for the ectopic and endogenous Airn ICR after CRISPR-mediated Zfp57 KO. Triangles indicate CpGs within ZFP57 motifs. The region analysed by bsPCR is indicated. f) Schematic overview of Airn ICR fragments tested in the study (top) and single-molecule bisulphite PCR results from the individual fragments (below) g) Summary table for the methylation analysis of the H19 ICR fragments, including size, CpG density and GC content information. h) Single molecule measurements from bisulfite PCR corresponding to data summarized in g.
Extended Data Fig. 3
Extended Data Fig. 3. Identification of elements with similar sequence characteristics to the Airn ICR.
a) Analysis of sequence characteristics for genome-wide 1 kb windows. Yellow dots indicate ICR sequences used in this study. Red dots indicate Airn-like fragments. b) Genome browser snapshots for all four Airn-like sequences. Highlighted boxes indicate the DNA sequences used in the RMCE experiments. c) Sequence characteristics of selected Airn-like sequences compared to the Airn ICR. Vertical lines correspond to individual CpG sites within the sequence. d) GC percentage of selected Airn-like sequences. e) Single molecule representation of data summarized in f. f) Tabular summary of methylation analysis for all Airn-like sequences, including the Airn ICR for comparison.
Extended Data Fig. 4
Extended Data Fig. 4. Methylation maintenance of Airn ICR is independent of CpG positioning and GC content but requires ZFP57 motifs.
a) Workflow indicating in silico sequence shuffling for the Airn ICR. b) Sequence characteristic of most-divergent shuffled sequence (Airn shuffled) compared to the original Airn sequence. c) BPNet evaluation of ZFP57 binding at the wild type Airn ICR, and predicted binding in the shuffled Airn ICR. d) Predicted ZFP57 binding in wild type Airn with a scanning 10 bp replacement from the shuffled Airn sequence. Each row represents the prediction from one replacement experiments. e) ZFP57 binding prediction in shuffled Airn + reconstituted ZFP57 binding motifs.
Extended Data Fig. 5
Extended Data Fig. 5. Methylated ICR sequences can repress different promoters in cis.
a) Design of GFP reporter constructs with different promoters using identical overhang sequences for Gibson assembly, and b) flow cytometric analysis of GFP expression of cells that carry the unmethylated, empty reporter constructs without ICRs. c) Flow cytometry analysis indicating percentage of GFP-positive cells per population (derived from individual clones) showing stability of repression for methylated ICR reporters in combination with either EF1a (top) or PGK (bottom) promoters measured at 16, 23 and 30 days after transfection. In addition, the GFP percentage is shown for cells receiving reporters with methylated promoters only (no ICRs) or in combination with the Dazl promoter as controls. Each dot indicates independently derived clones. d) Flow cytometry analysis of cells containing an H19-EF1a reporter. e) Flow cytometry analysis for a representative mESC clone with the Airn-pCAGGS reporter cultured in serum, 2i, or 2i + vitamin C for 12 days. f) Flow cytometric analysis of three independent clones with the methylated Airn-CAG reporter after 8 days in different media conditions. g) Time course for reactivation of different ICR-promoter combinations in different growth conditions. Data points show the mean value of 3 independent clones. Error bar indicates the standard error of the mean.
Extended Data Fig. 6
Extended Data Fig. 6. ICR sequences repress promoters in a DNA methylation-dependent manner.
a) Flow cytometric analysis of GFP reactivation 8 days after transfection with guide RNAs targeting Uhrf1 and Dnmt1 genes, compared to cells transfected with non-targeting guide RNAs. Data is shown from the entire population of targeted cells without pre-selection for KO cells. b) Summarized results from a. Each dot indicates % GFP-positive cells in the entire population of targeted cells. c) Flow cytometric analysis of pre-methylated Airn-EF1a-GFP treated with the DNA methylation inhibitor GSK-3484862 for 2 days (top) and following washout for 7 days, indicating that once reactivated, the reporter does not re-silence.
Extended Data Fig. 7
Extended Data Fig. 7. Targeted CRISPR screen strategy and setup.
a) FACS gating strategy for CRISPR screens using the ChromMM libraries. Transduced mESCs are selected based on the CD90.1 cell surface marker, co-expressed from the sgRNA containing transgene. Reactivated cells are sorted based on GFP expression (for example 8 days). b) Time course experiment for a CRISPR screen using the ChromMM or control library performed with three independent clones. Error bars indicate the standard error of the mean. c-d) Flow cytometric analysis of cell lines transduced with the chromatin targeting library vs. the non-targeting control library in serum and 2i, respectively. Axis is indicating percentage of GFP-positive cells in the CRISPR screen population.
Extended Data Fig. 8
Extended Data Fig. 8. CRISPR screens identify factors required for methylation maintenance in mESCs.
a) Rank plot for screens in serum conditions. Dashed horizontal line indicates the p-value threshold of 0.05. P-values were obtained using MAGeCK RRA (robust rank aggregation). Red dots indicate known heterochromatin factors associated with ICR regulation, blue dots indicate genes found in multiple screens, and green dots indicate the positive controls. b) Overview of CRISPR hits for the Airn and Kcnq1ot1 reporter cell lines grown in 2i conditions. Dashed horizontal line indicates the p-value threshold of 0.05 obtained using MAGeCK RRA (robust rank aggregation). c) Rank plot for screens in 2i conditions. Dashed horizontal line indicates the p-value threshold of 0.05 obtained using MAGeCK RRA (robust rank aggregation). d) Overview of CRISPR hits using the EpiTF library in the serum-grown Airn reporter cell line. Dashed horizontal line indicates the p-value threshold of 0.05 obtained using MAGeCK RRA (robust rank aggregation). e) Rank plot for the screen using the Airn pEF1a reporter in serum using the EpiTF library. Dashed horizontal line indicates the p-value threshold of 0.05 obtained using MAGeCK RRA (robust rank aggregation). f) Validation of potential candidates using single transfections of guide RNAs against the indicated gene. GFP expression was measured 12 days after transfection. Transfections were performed in technical replicates. Potential candidates were targeted with one independent guide and one guide from the ChromMM library. Data is showing % of positive cells in pools after CRISPR targeting. g) Network representation for all potential candidates using the STRING database. Pink edge indicates experimentally determined interactions; cyan edge indicates known interactions from curated databases. Green, red, and blue edges indicate predicted interactions based on gene neighbourhood, gene fusion, and gene co-occurrence, respectively. Yellow and black edges are predicted interactions based on textmining and co-expression, respectively.
Extended Data Fig. 9
Extended Data Fig. 9. ATF7IP and ZMYM2 co-localize with ZFP57 at ICRs.
a) Peak overlap analysis showing percentage of ZMYM2 or ATF7IP peaks coinciding with SETDB1, ZFP57, or genomic sites co-bound by ZFP57 and SETDB1. b) Heatmap indicating ZMYM2 binding at ZMYM2 peaks and separated by peaks overlapping SETB1 and SETB1-independent peaks. H3K9me3 ChIP-seq signal is shown for the same peak sets. c) WGBS methylation analysis at independent ZMYM2 and ATF7IP peaks (N = 159). ZMYM2 peaks are separated by sites overlapping (N = 4201) and non-overlapping (N = 10292) to SETDB1. Box plots denote the interquartile range as a box (IQR) and the lowest and highest values within the range of 1.5 x IQR around the box as whiskers. d) ChIP-qPCR for ATF7IP and ZMYM2 binding at the endogenous Airn ICR in wild type and Zfp57-KO cells. ChIP enrichment is normalized to 5% input and calibrated to a background genomic site (intergenic). Shown are independent technical replicates. e) Volcano plots indicating proteins enriched in the ZFP57_dZNF-TurboID (KRAB domain only) over a background TurboID cell line (nTurbo). Statistically enriched proteins are indicated (FDR-corrected two-tailed t-test: FDR = 0.05, s0 = 1, n = 4 technical replicates). f) Expression levels for ZFP57, ATF7IP and ZMYM2, measured at different timepoints during early embryo development. Shown are RPKM-normalized reads obtained from ref. . g) Immunoblot detection of ATF7IP and ZMYM2 in wild type and KO cells using specific antibodies. Lamin B1 is used as loading control. Asterisk denotes the Zmym2-KO clone used for WGBS analysis. Experiment was repeated at least three times. Molecular weight markers are indicated. Source data
Extended Data Fig. 10
Extended Data Fig. 10. DNA methylation and H3K9me3 analysis in Atf7ip and Zmym2 KO cells.
a) Boxplots indicating average DNA methylation over all CpGs covered at least 10x in the mouse genome. Interquartile range is shown as a box (IQR) and the lowest and highest values within the range of 1.5 x IQR around the box as whiskers. Number of independent CpGs analyzed are indicated b) Bisulphite conversion controls from spiked-in Lambda and methylated T7 phage DNA show complete conversion of DNA molecules. Interquartile range is shown as a box (IQR) and the lowest and highest values within the range of 1.5 x IQR around the box as whiskers. Number of independent CpGs analyzed are indicated. c) WGBS data analysis of all annotated ICRs in wild type, Atf7ip-KO, and Zmym2-KO mESCs. d) Individual methylation profiles from targeted bisulfite sequencing experiments for Airn, Kcnqot1 and Peg10 ICRs in wild type, Atf7ip-KO, and Zmym2-KO mESCs. 1000 amplicons per sample were randomly sampled for better visualization. e) Heatmap showing H3K9me3 at all ICRs in wild type, Atf7ip-KO, and Zmym2-KO mESCs. Shown are library-normalized reads per 20 bp.

References

    1. Almouzni G, Cedar H. Maintenance of epigenetic information. Cold Spring Harb. Perspect. Biol. 2016;8:a019372. - PMC - PubMed
    1. Villaseñor R, Baubec T. Regulatory mechanisms governing chromatin organization and function. Curr. Opin. Cell Biol. 2021;70:10–17. - PubMed
    1. Lienert F, et al. Identification of genetic elements that autonomously determine DNA methylation states. Nat. Genet. 2011;43:1091–1097. - PubMed
    1. Wachter E, et al. Synthetic CpG islands reveal DNA sequence determinants of chromatin structure. eLife. 2014;3:e03397. - PMC - PubMed
    1. Krebs AR, Dessus-Babus S, Burger L, Schübeler D. High-throughput engineering of a mammalian genome reveals building principles of methylation states at CG rich regions. eLife. 2014;3:e04094. - PMC - PubMed

Publication types