Meta-Analysis
. 2022 Nov;54(11):1640-1651.
doi: 10.1038/s41588-022-01213-w. Epub 2022 Nov 4.

Multi-ancestry genome-wide association analyses identify novel genetic mechanisms in rheumatoid arthritis

Kazuyoshi Ishigaki #  1   2   3 Saori Sakaue #  1   2   4   5 Chikashi Terao #  6   7   8 Yang Luo  1   2   5   9   10 Kyuto Sonehara  4   11 Kensuke Yamaguchi  12   13 Tiffany Amariuta  1   2   5   10   14   15   16 Chun Lai Too  17   18 Vincent A Laufer  19   20 Ian C Scott  21   22 Sebastien Viatte  23   24   25 Meiko Takahashi  26 Koichiro Ohmura  27 Akira Murasawa  28 Motomu Hashimoto  29   30 Hiromu Ito  29   31 Mohammed Hammoudeh  32 Samar Al Emadi  32 Basel K Masri  33 Hussein Halabi  34 Humeira Badsha  35 Imad W Uthman  36 Xin Wu  37 Li Lin  37 Ting Li  37 Darren Plant  23 Anne Barton  23   25 Gisela Orozco  23   25 Suzanne M M Verstappen  25   38 John Bowes  23   25 Alexander J MacGregor  39 Suguru Honda  40   41 Masaru Koido  6 Kohei Tomizuka  6 Yoichiro Kamatani  6   42 Hiroaki Tanaka  43 Eiichi Tanaka  40   41 Akari Suzuki  13 Yuichi Maeda  11   44   45 Kenichi Yamamoto  4   46   47 Satoru Miyawaki  48 Gang Xie  49 Jinyi Zhang  49   50 Christopher I Amos  51 Edward Keystone  52 Gertjan Wolbink  53 Irene van der Horst-Bruinsma  54 Jing Cui  9 Katherine P Liao  9   10   55 Robert J Carroll  56 Hye-Soon Lee  57   58 So-Young Bang  57   58 Katherine A Siminovitch  49   59 Niek de Vries  60 Lars Alfredsson  61 Solbritt Rantapää-Dahlqvist  62 Elizabeth W Karlson  9 Sang-Cheol Bae  57   58 Robert P Kimberly  63 Jeffrey C Edberg  63 Xavier Mariette  64 Tom Huizinga  65 Philippe Dieudé  66   67 Matthias Schneider  68 Martin Kerick  69 Joshua C Denny  56   70   71 BioBank Japan ProjectKoichi Matsuda  72   73 Keitaro Matsuo  74   75 Tsuneyo Mimori  27 Fumihiko Matsuda  26 Keishi Fujio  76 Yoshiya Tanaka  43 Atsushi Kumanogoh  11   23   44   45 Matthew Traylor  77   78   79 Cathryn M Lewis  77   80 Stephen Eyre  23   25 Huji Xu  37   81   82 Richa Saxena  5 Thurayya Arayssi  83 Yuta Kochi  12   13 Katsunori Ikari  40   84   85 Masayoshi Harigai  40   86 Peter K Gregersen  87 Kazuhiko Yamamoto  13 S Louis Bridges Jr  88   89 Leonid Padyukov  18 Javier Martin  69 Lars Klareskog  18 Yukinori Okada  90   91   92   93   94   95 Soumya Raychaudhuri  96   97   98   99   100   101
Affiliations
Meta-Analysis

Multi-ancestry genome-wide association analyses identify novel genetic mechanisms in rheumatoid arthritis

Kazuyoshi Ishigaki et al. Nat Genet. 2022 Nov.

Abstract

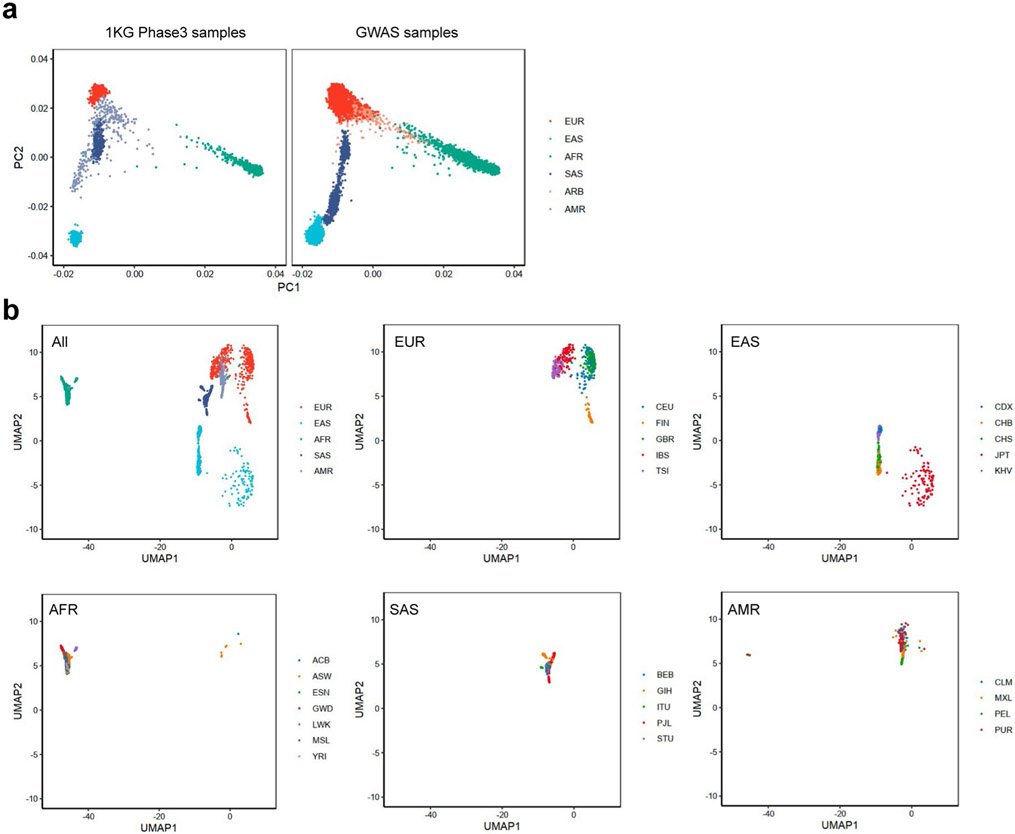
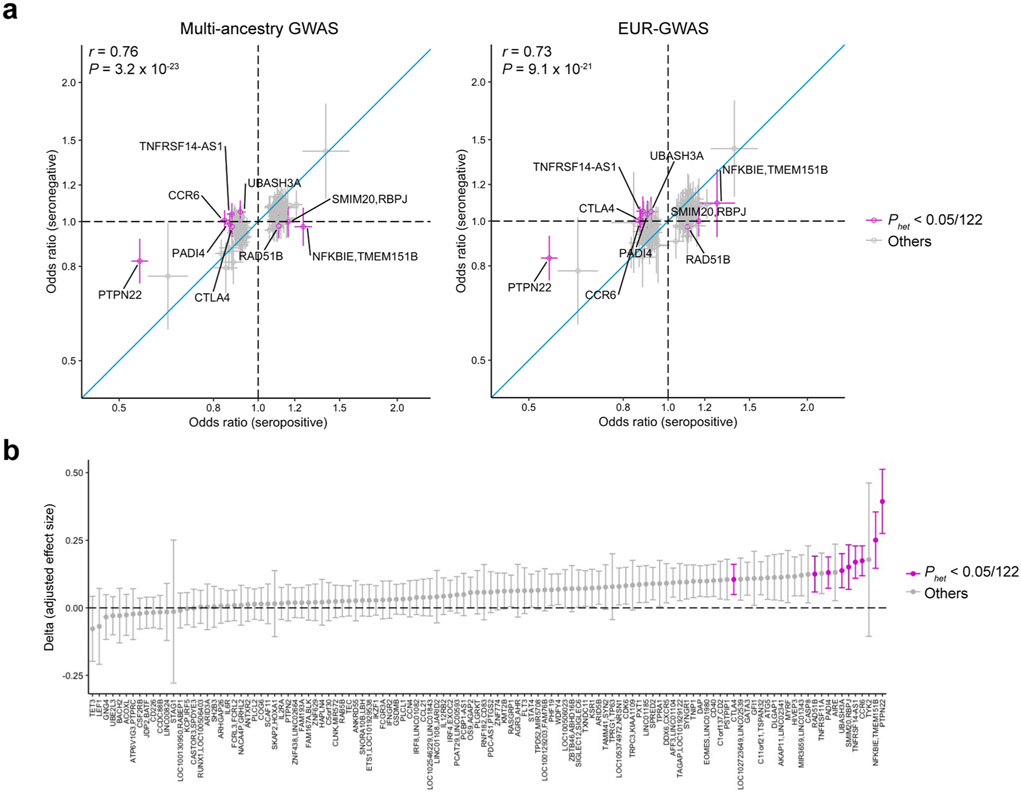
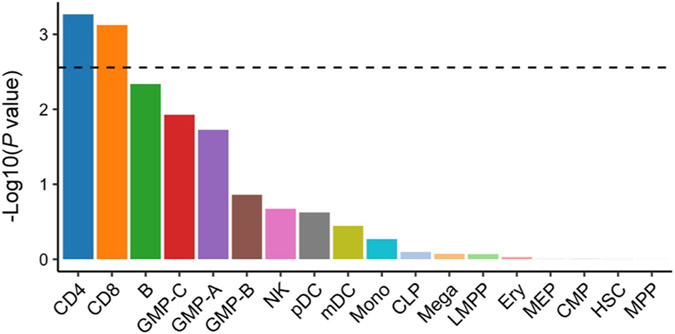
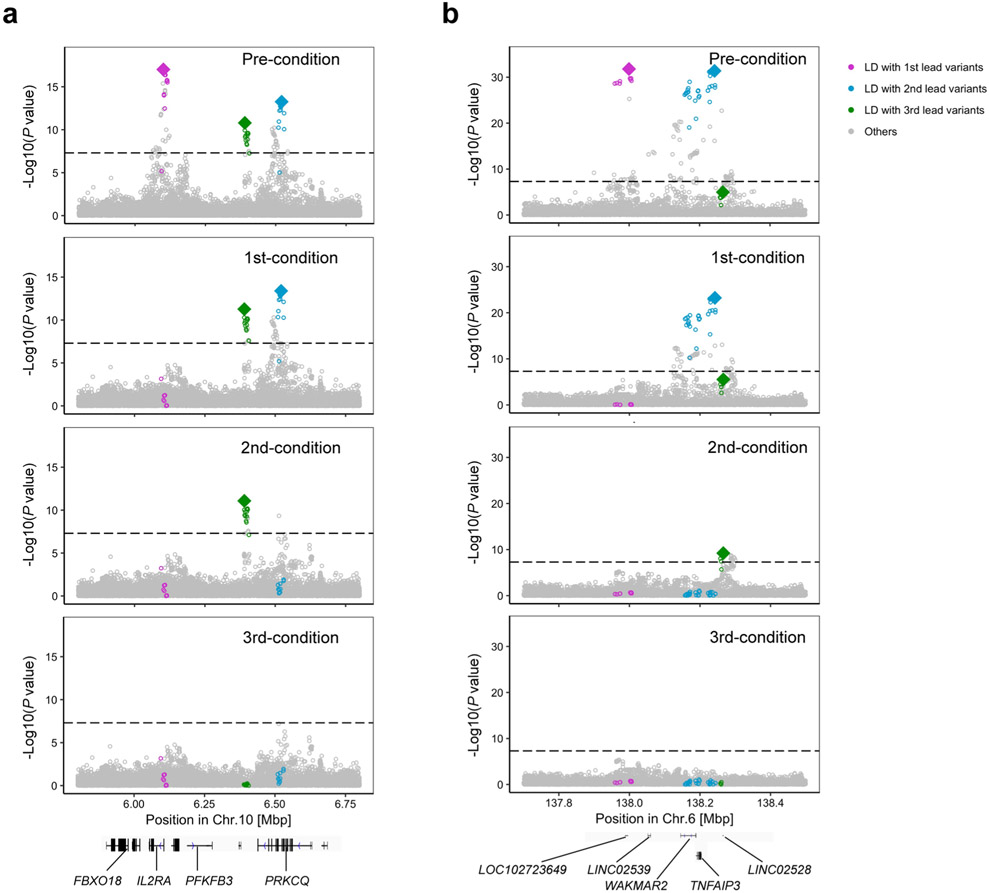
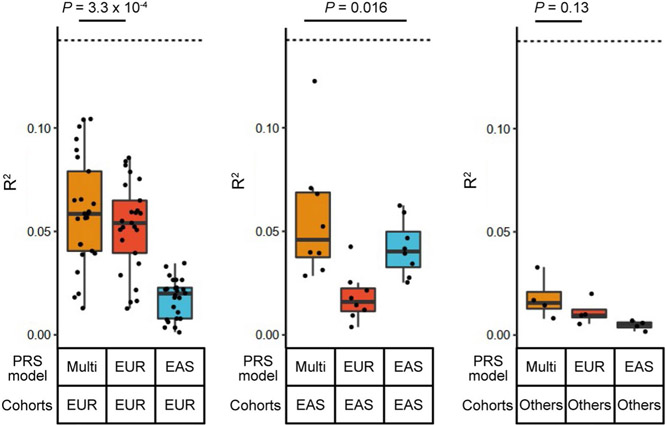
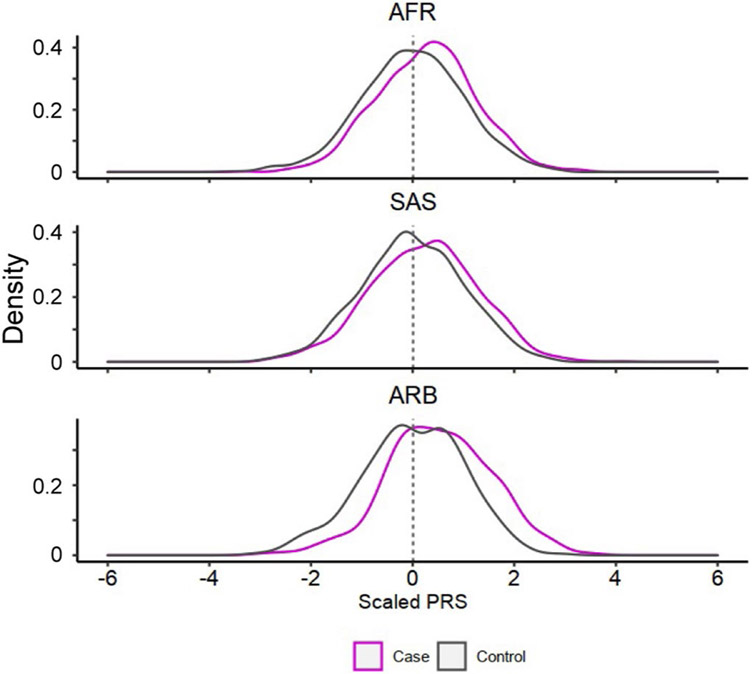
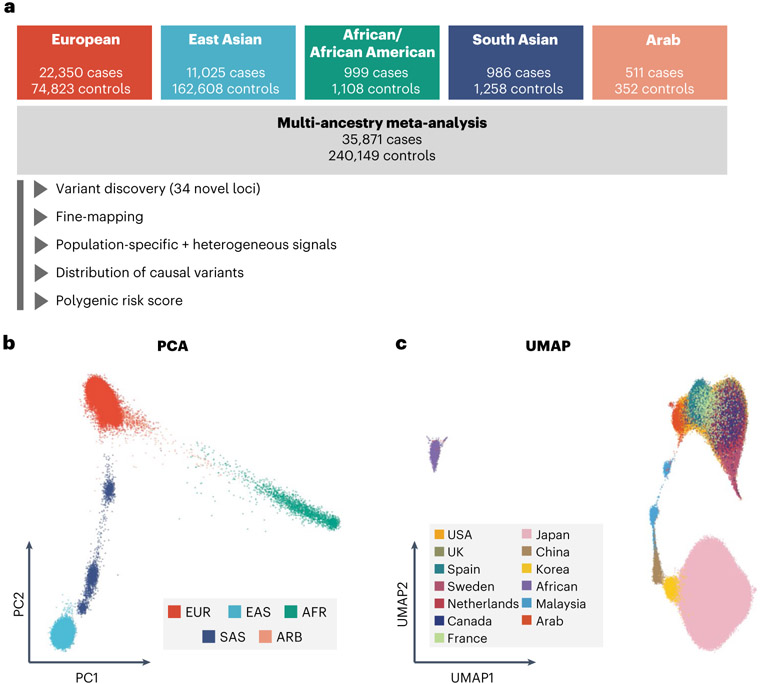
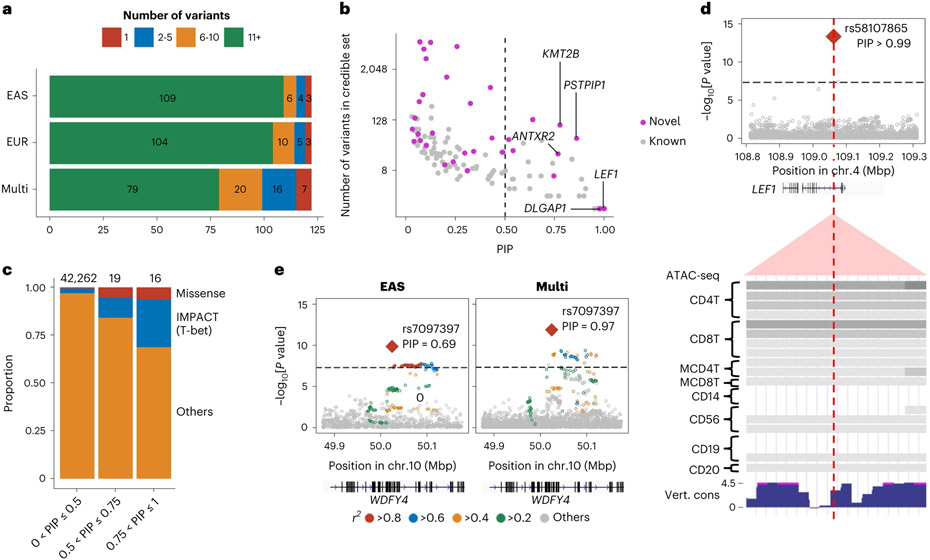
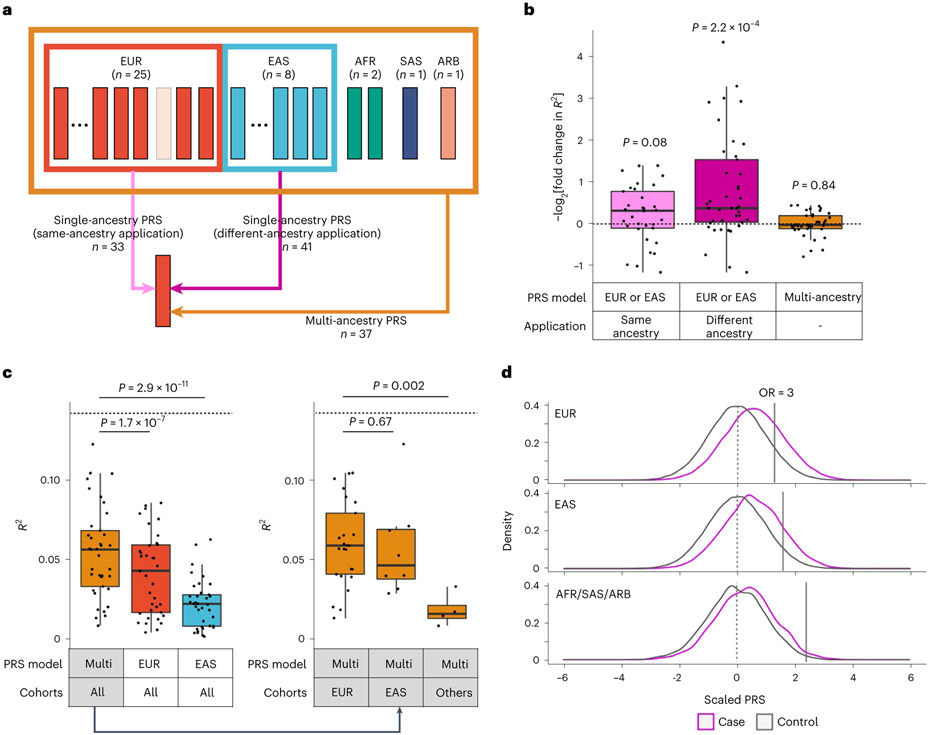
Rheumatoid arthritis (RA) is a highly heritable complex disease with unknown etiology. Multi-ancestry genetic research of RA promises to improve power to detect genetic signals, fine-mapping resolution and performances of polygenic risk scores (PRS). Here, we present a large-scale genome-wide association study (GWAS) of RA, which includes 276,020 samples from five ancestral groups. We conducted a multi-ancestry meta-analysis and identified 124 loci (P < 5 × 10⁻⁸), of which 34 are novel. Candidate genes at the novel loci suggest essential roles of the immune system (for example, TNIP2 and TNFRSF11A) and joint tissues (for example, WISP1) in RA etiology. Multi-ancestry fine-mapping identified putatively causal variants with biological insights (for example, LEF1). Moreover, PRS based on multi-ancestry GWAS outperformed PRS based on single-ancestry GWAS and had comparable performance between populations of European and East Asian ancestries. Our study provides several insights into the etiology of RA and improves the genetic predictability of RA.


Figures

Extended Data Fig. 1 ∣
Extended Data Fig. 1 ∣. PCA and UMAP plot of 1KG Phase 3.
a, We projected each individual’s imputed genotype into a PC space, which was calculated using all individuals in 1KG Phase 3. b, We further conducted UMAP analysis using the top 20 PC scores of all GWAS samples and all individuals in 1KG Phase 3. We plotted all samples in 1KG Phase 3 or plotted samples in each ancestry separately. UMAP plot of all GWAS samples is provided in Fig. 1c.
Extended Data Fig. 2 ∣
Extended Data Fig. 2 ∣. Effect size heterogeneity between seropositive and seronegative RA.
a, Odds ratio and its 95% confidence interval of seropositive and seronegative RA are plotted. Among the lead variants at 122 significant autosomal loci, we plotted 118 variants common in EUR of 1KG Phase 3 (MAF > 0.01). We present the results from multi-ancestry GWAS and EUR-GWAS. Effect size heterogeneity was assessed in the multi-ancestry GWAS results by Cochran’s Q test (Phet). Pearson’s correlation data are provided. b, Differences (delta) of effect size magnitude between seropositive and seronegative RA. A positive delta indicates a larger magnitude of effect size in seropositive RA than seronegative RA. We defined the standard error (s.e.) of delta by the following formula: S.E.seropositive2+S.E.seronegative2. We provided 2 × s.e. of delta as error bars. In seropositive RA GWAS, we had 27,448 cases and 240,149 controls; in seronegative RA GWAS, we had 4,515 cases and 240,149 controls.
Extended Data Fig. 3 ∣
Extended Data Fig. 3 ∣. Enrichment of high PIP variants within open chromatin regions of 18 blood cell populations.
Enrichment of high PIP variants within open chromatin regions of 18 blood cell populations was analyzed by gchromVAR software. The horizontal dashed line indicates Bonferroni corrected P value threshold (0.05/18 = 0.0027). P values were estimated by the enrichment test implemented in gchromVAR.
Extended Data Fig. 4 ∣
Extended Data Fig. 4 ∣. Conditional analysis results at the IL2RA and TNFAIP3 loci.
a,b, Conditional analysis was conducted in each cohort, and the results were meta-analyzed using the inverse-variance weighted fixed effect model (a, IL2RA locus; b, TNFAIP3 locus). We used multi-ancestry GWAS results. Results at the TYK2 locus are provided in Extended Data Fig. 6. Variants in LD with the lead variant (r2 > 0.6 both in EUR and EAS ancestries) in each round of conditional analysis are highlighted by different colors.
Extended Data Fig. 5 ∣
Extended Data Fig. 5 ∣. Haplotype-level association test at the IL6R locus.
Haplotype-level association results at the IL6R locus. We defined haplotypes as shown in the table, and we estimated the dosage of four haplotypes using phased imputed genotype data. We conducted multivariate logistic regression tests in each of EUR cohorts (n = 97,173 in total), and the results were meta-analyzed using the inverse-variance weighted fixed effect model. The effect size estimate and 2 x s.e. are shown in the right panel.
Extended Data Fig. 6 ∣
Extended Data Fig. 6 ∣. Three ancestry-specific signals at the TYK2 locus.
a,b, Conditional analysis was conducted in each cohort, and the results were meta-analyzed using the inverse-variance weighted fixed effect model (a, EUR-GWAS; b, EAS-GWAS). Variants in LD with the lead variant (r2 > 0.6 in EUR or EAS ancestries) in each round of conditional analysis are highlighted by different colors.
Extended Data Fig. 7 ∣
Extended Data Fig. 7 ∣. S-LDSC analysis using histone mark annotations.
a, The estimate and its 95% confidence interval of the heritability proportion explained by 396 histone mark annotations are provided. Confidence intervals and the P values indicating non-negative tau were estimated via block-jackknife implemented in the LDSC software (one-sided test). When a heritability enrichment is significant (P < 0.05/396 = 1.3 × 10⁻⁴), that annotation is colored by the type of GWAS. b, The best histone mark annotation (H3K4me1 in PMA-I stimulated primary CD4+ T cells) and the best IMPACT annotation (CD4+ T cell T-bet) were jointly modeled in S-LDSC analysis. Tau estimate (per variant heritability in each annotation) normalized by total per variant heritability are provided as the centre, and its 95% confidence interval are provided as error bars. EUR-GWAS results were used. c, P values were calculated by block-jackknife implemented in the LDSC software and indicate the significance of non-negative tau (per variant heritability) of each annotation (one-sided test). Each histone mark annotation is colored by its cell type category. Horizontal dashed line indicates Bonferroni-corrected P-value threshold (0.05/396 = 1.3 × 10⁻⁴). Top panel shows the results without controlling the effect of the best IMPACT annotation (CD4+ T cell T-bet), and the bottom panel shows the results with controlling for this effect.
Extended Data Fig. 8 ∣
Extended Data Fig. 8 ∣. PRS performance comparison between the previous RA GWAS and this GWAS.
The liability scale R2 in the 15 cohorts not included in the previous RA GWAS. We used the multi-ancestry GWAS results reported in Okada et al. and this GWAS to develop PRS models. We used the LOCO approach to evaluate the PRS model based on this GWAS. The differences were assessed by two-sided paired Wilcoxon text (n = 15). Within each boxplot, the horizontal lines reflect the median, the top and bottom of each box reflect the interquartile range (IQR), and the whiskers reflect the maximum and minimum values within each grouping no further than 1.5 × IQR from the hinge.
Extended Data Fig. 9 ∣
Extended Data Fig. 9 ∣. PRS performances in different ancestral groups.
PRS performances (liability scale R2) are shown for each combination of PRS models and cohort groups for which the PRS was applied (n = 25, 8, and 4, respectively, from the left). The differences between the group with the best performance and the second best were analyzed by two-sided paired Wilcoxon test. Within each boxplot, the horizontal lines reflect the median, the top and bottom of each box reflect the interquartile range (IQR), and the whiskers reflect the maximum and minimum values within each grouping no further than 1.5 × IQR from the hinge. We used the LOCO approach where applicable.
Extended Data Fig. 10 ∣
Extended Data Fig. 10 ∣. PRS distribution differences between cases and controls.
PRS distribution differences between cases and controls. Multi-ancestry PRS with CD4+ T cell T-bet IMPACT annotation was used. We used the LOCO approach. In each cohort, PRS was scaled using mean and s.d. of the control samples, and individual level data were merged across cohorts in an ancestry group.
Fig. 1 ∣
Fig. 1 ∣. Diverse ancestral backgrounds of GWAS participants.
a, GWAS study design. The total numbers of cases and controls are provided. b, PCA plot of all GWAS samples. We projected each individual’s imputed genotype into a PC space, which was calculated using all individuals in 1KG Phase 3. The color of each sample corresponds to its ancestry group. c, UMAP plots of all GWAS samples. We conducted UMAP analysis using the top 20 PC scores. The color of the samples in a cohort corresponds to the country or region-level group of that cohort (Supplementary Table 1). When a cohort recruited participants from several countries, we did not plot its samples.
Fig. 2 ∣
Fig. 2 ∣. Fine-mapping analysis identified candidate causal variants.
a, Among 122 autosomal loci analyzed, we counted the number of loci that had a 95% credible set size in a specified range. The results from EAS-GWAS, EUR-GWAS and multi-ancestry GWAS are provided. b, The PIP of the lead variant and the size of the 95% credible set at the 122 autosomal loci analyzed. The names of novel loci with a PIP greater than 0.75 are labeled. We used multi-ancestry GWAS results. c, In each range of PIP (the total numbers of variants are provided on top), we calculated the proportion of non-synonymous variants or variants with high IMPACT score (CD4+ T cell T-bet annotation > 0.5). d, A fine-mapped variant at the LEF1 locus within CD4+ T cell-specific open chromatin regions. P values of multi-ancestry GWAS are provided with a dense view of immune cell ATAC-seq data (density indicates the read coverage) and vertebrate conservation data from the UCSC Genome Browser (http://genome.ucsc.edu). e, P values in the WDFY4 locus in EAS-GWAS and multi-ancestry GWAS. r2 values between each variant and the lead variant (rs7097397) are shown using different colors. For multi-ancestry GWAS, we used intersection of LD variants in EUR and EAS ancestries. P values in the GWAS results (d and e) were calculated by a fixed effect meta-analysis of statistics from logistic regression tests in each cohort.
Fig. 3 ∣
Fig. 3 ∣. Splicing and total expression of IL6R jointly contribute to RA risk.
a, The first lead variant (rs12126142; magenta) and the second lead variant (rs4341355; blue) mutually attenuate each other’s signals (controlling the effect of the other increased their signals). Conditional analysis was conducted in each cohort, and the results were meta-analyzed using the inverse-variance weighted fixed effect model. We used multi-ancestry GWAS results. b, P values of sQTL signals for IL6R (phenotype ID: ENSG00000160712.8.17_154422457 in the Blueprint dataset) and eQTL signals for IL6R (total expression of IL6R). Linear regression tests were used to calculate P values. Variants in LD with the lead variant are highlighted in magenta or blue (r2 > 0.6 in both EUR and EAS ancestries). These statistics are also provided in Supplementary Table 9.
Fig. 4 ∣
Fig. 4 ∣. Splicing of PADI4 contributes to RA risk.
a, Conditional analyses identified two independent associations at the PADI4 locus: esv3585367 (magenta) and rs2076616 (blue). We used multi-ancestry GWAS results. Variants in LD with the lead variant are highlighted in magenta or blue (r2 > 0.6 in both EUR and EAS ancestries). These statistics are also provided in Supplementary Table 9. b, A novel PADI4 splice isoform confirmed by long-read sequencing datasets. PADI4-novel, a novel isoform that we identified; PADI4-201, a functional isoform. PADI4-novel has an elongation of exon 10 that leads to an early stop codon and a truncated PAD domain at the carboxy terminus. The PAD domain is an essential catalytic domain, and highly conserved across other PADI genes. c, The total expression and the expression of three isoforms of PADI4 were plotted with the imputed dosages of the risk allele (esv3585367-A). The isoform structures are shown in b. We analyzed RNA-seq data from 105 healthyJapanese individuals reported in a previous study. We used peripheral blood leukocytes (neutrophils are its main component) and monocytes; both have high PADI4 expression levels. P values from linear regression are provided. Within each boxplot, the horizontal lines denote the median, the top and bottom of each box denote the interquartile range (IQR), and the whiskers denote the maximum and minimum values within each grouping no further than 1.5 × IQR from the hinge.
Fig. 5 ∣
Fig. 5 ∣. S-LDSC analysis suggested similar causal variant distributions in EUR-GWAS and EAS-GWAS.
a, EUR-GWAS and EAS-GWAS results were analyzed by S-LDSC using 707 IMPACT annotations. P values were calculated by block-jackknife implemented in the LDSC software and indicate the significance of non-negative tau (per variant heritability) of each annotation (one-sided test). The color of each annotation indicates its cell-type category. The horizontal dashed line indicates the Bonferroni-corrected P value threshold (0.05/707 = 7.1 × 10⁻⁵). b, The estimate and its 95% confidence interval of the heritability proportion explained by the top 5% of IMPACT annotations. Confidence intervals and the P values indicating non-negative tau were estimated via block-jackknife implemented in the LDSC software (one-sided test). The color of each annotation indicates the type of GWAS when a heritability enrichment was significant (P < 0.05/707 = 7.1 × 10⁻⁵). ‘Both’ indicates that the annotation was significant in both EUR-GWAS and EAS-GWAS.
Fig. 6 ∣
Fig. 6 ∣. Fine-mapped variants with high IMPACT scores.
Among six loci with lead variants that exhibited high PIP and high IMPACT scores (both >0.5), we show three example loci with PIP > 0.99. P values in multi-ancestry GWAS are shown in the top panels and were calculated by a fixed effect meta-analysis of statistics from logistic regression tests. The track of CD4+ T cell T-bet IMPACT annotation is shown in the bottom panels.
Fig. 7
Fig. 7. Functional annotation and multi-ancestry GWAS improved PRS performances.
a, The strategy of our PRS analysis. We used PRS based on three GWAS settings: two single-ancestry PRS (EUR-PRS and EAS-PRS) and a multi-ancestry PRS. Single-ancestry PRS had two types of applications: same-ancestry application of PRS (EUR-PRS applied to EUR cohorts, or EAS-PRS applied to EAS cohorts) and different-ancestry application of PRS (EUR-PRS applied to non-EUR cohorts, or EAS-PRS applied to non-EAS cohorts). When we applied a PRS model to a cohort included in a GWAS setting, we reconducted the meta-analysis excluding that cohort to avoid overlapped samples (the LOCO approach). The numbers of each application are shown. b, The improvements in PRS performance (liability-scale R2) by CD4+ T cell T-bet IMPACT annotation. Fold change indicates R2 in functionally informed PRS divided by R2 in standard PRS. We compared three conditions: same-ancestry application of single-ancestry PRS (n = 33), different-ancestry application of single-ancestry PRS (n = 41), and multi-ancestry PRS (n = 37). One-sided sign test P values are shown. We used the LOCO approach where applicable. c, The performance (liability-scale R2) of three different PRS models. The results of three PRS models in all cohorts are shown in the left panel (n = 37). The results of multi-ancestry PRS in three cohort groups are shown in the right panel (n = 25, 8 and 4, respectively, from left to right). The differences in R2 were assessed by two-sided Wilcoxon test. In all conditions, CD4+ T cell T-bet IMPACT annotation was used to select variants. We used the LOCO approach where applicable. d, PRS distribution differences between case and control. Multi-ancestry PRS with CD4+ T cell T-bet IMPACT annotation was used. We used the LOCO approach. In each cohort, PRS was scaled using mean and s.d. of the control samples, and individual level data were merged across cohorts in an ancestral group. For a given PRS value at the right tail of PRS distribution, we compared the case–control ratios between individuals whose PRS was higher than that value and individuals whose PRS was lower than that value, and calculated the OR. The PRS values with OR = 3 are shown with solid vertical lines. Within each boxplot (b and c), the horizontal lines indicate the median, the top and bottom of each box indicate the IQR, and the whiskers indicate the maximum and minimum values within each grouping no further than 1.5 × IQR from the hinge.

References

    1. Ajeganova S & Huizinga TWJ Seronegative and seropositive RA: alike but different? Nat. Rev. Rheumatol 11, 8–9 (2015). - PubMed
    1. Okada Y et al. Genetics of rheumatoid arthritis contributes to biology and drug discovery. Nature 506, 376–381 (2014). - PMC - PubMed
    1. Ishigaki K et al. Large-scale genome-wide association study in a Japanese population identifies novel susceptibility loci across different diseases. Nat. Genet 52, 669–679 (2020). - PMC - PubMed
    1. MacGregor AJ et al. Characterizing the quantitative genetic contribution to rheumatoid arthritis using data from twins. Arthritis Rheum. 43, 30–37 (2000). - PubMed
    1. Ishigaki K et al. Polygenic burdens on cell-specific pathways underlie the risk of rheumatoid arthritis. Nat. Genet 49, 1120–1125 (2017). - PubMed

Publication types

MeSH terms

Substances