. 2022 Nov;54(11):1675-1689.
doi: 10.1038/s41588-022-01211-y. Epub 2022 Nov 4.

Whole-genome sequencing of chronic lymphocytic leukemia identifies subgroups with distinct biological and clinical features

Collaborators, Affiliations

Whole-genome sequencing of chronic lymphocytic leukemia identifies subgroups with distinct biological and clinical features

Pauline Robbe et al. Nat Genet. 2022 Nov.

Abstract

The value of genome-wide over targeted driver analyses for predicting clinical outcomes of cancer patients is debated. Here, we report the whole-genome sequencing of 485 chronic lymphocytic leukemia patients enrolled in clinical trials as part of the United Kingdom's 100,000 Genomes Project. We identify an extended catalog of recurrent coding and noncoding genetic mutations that represents a source for future studies and provide the most complete high-resolution map of structural variants, copy number changes and global genome features including telomere length, mutational signatures and genomic complexity. We demonstrate the relationship of these features with clinical outcome and show that integration of 186 distinct recurrent genomic alterations defines five genomic subgroups that associate with response to therapy, refining conventional outcome prediction. While requiring independent validation, our findings highlight the potential of whole-genome sequencing to inform future risk stratification in chronic lymphocytic leukemia.


Conflict of interest statement

In the past five years, A.S. has received in-kind contributions from Illumina and Oxford Nanopore Technology and is a shareholder of Illumina. She is a company director and shareholder of SERENOx Ltd. A.S. has received honoraria from Exact Sciences, Janssen, Astra Zeneca, Abbvie and Beigene, non-restricted research grants from Janssen and Astra Zeneca and an educational grant from Abbvie. A.R.P. receives research funding from Celgene/BMS, Gilead, Napp and Roche. N.A. received speaker fees from Gilead. P.A., T.J., U.M., M.R. and D.B. are employees of Illumina, a public company that develops and markets systems for genetic analysis. The remaining authors declare no competing interests.

Figures
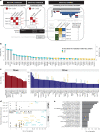
Fig. 1
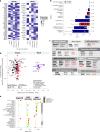
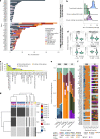
Fig. 1. Identification of coding mutations and structural variants.
a, Methodology used for the discovery of candidate coding drivers. Discovery method 1A selected genes with a FDR below significance threshold for two out of four algorithms. Discovery method 1B combined the P values of four algorithms using weighted Stouffer and weighted Harmonic mean. Genes with FDR below significance threshold for at least one result were selected. With discovery method 2, CNAs were used to define minimally affected regions (by copy number loss or gain). Then, genes included in these genomic regions were selected as candidate drivers if they presented at least five SNVs/indels impacting the coding sequence focality and recurrence scores greater than threshold and mechanism of action of gene in agreement with the type with CNAs (loss for TSG and gain for oncogenes). An additional list, not considered as candidate drivers, included genes fulfilling all requirements except the SNVs/indels count threshold. (Permissive list; see Methods for more details). b, Number of SNVs/indels (left axis) and proportion in the cohort (right axis) of the 58 candidate drivers. Other CLL cohorts used as comparators are described in (Supplementary Table 5; Methods). c, The 76 regions recurrently affected by CNAs. The y axis is shown in log10 scale. Known CLL drivers are indicated in blue and putative driver genes identified as hotspots are indicated in yellow. d, Candidate drivers found by integrating both CNAs and SNVs/indels. The score represents combined focality and recurrence scores derived from MutComFocal, integrating SNVs/indels data with CNA data (Discovery method 2; Methods); NS, not significant. Known CLL drivers are indicated in blue and putative driver genes identified as hotspots are indicated in yellow. e, All translocation breakpoint pairs found in more than three samples (out of 495), including those occurring in coding and noncoding regions. Source data
Fig. 2
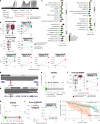
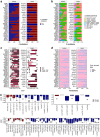
Fig. 2. Biological features of coding mutations and CNAs.
a, Annotations of genes. CNAs, presence/absence of CNAs affecting the gene; COSMIC, proportion of variants reported in the COSMIC database; High impact, proportion of nonsense variants, Median CCF, median cancer cell fraction of variants; Prot domain: proportion of variants occurring in a protein domain from the Prot2HG database. b, Distribution of cancer cell fractions in selected recurrent regions of CNAs (all regions in Extended Data Fig. 3e). The boxplot shows the minimum and maximum values and the interquartile range. c, Candidate drivers classified in ten main pathways described in CLL,. Genes in bold are present in more than 3% and genes in red font are candidate drivers. Other drivers are absent because not involved in these ten main pathways. d, Detection of variants of interest (n = 118) by RNA-seq (with minimum depth of five) in selected 73 samples. Difference of variant allele frequency (VAF) between RNA-seq methods and WGS methods shows allelic skew of variants. Ratio of expression in transcript per million (TPM) in sample with variant against all other samples reflects change in gene expression. Selected variants annotated with gene names, all data in Supplementary Table 13. DP, depth. e, Enrichment of genomic features in different CLL subgroups using two-sided Fisher’s exact test (plot showing the median, minimum and maximum values). The groups were (1) stage: relapsed/refractory (R/R), versus frontline (N = 443 frontline versus 30 R/R), (2) TP53: altered versus WT (N = 420 WT versus 65 disrupted), (3) IGHV mutational status: unmutated versus hypermutated (N = 197 hypermutated versus 288 unmutated), where an enrichment for the former is indicated by an odds ratio greater than one. Adjusted P values (FDR) are shown. Source data
Fig. 3
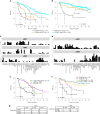
Fig. 3. Associations of coding mutations and CNAs with disease progression.
a, Three cohorts used for studying the presence of variants during disease evolution. Unpaired samples are taken from different patients; cohort (1) were samples from treatment-naïve patients and R/R patients; cohort (2) were paired samples of CLL and RS phase of the same patient; cohort (3) were paired samples taken at two different timepoints before treatment and at relapse. b, Distribution of cancer cell fractions in the three cohorts studied for selected genes. For cohort (1), figures are not shown if no R/R sample carried a mutation. Other genes are presented in Extended Data Fig. 4e,f. Boxplots showing results for unpaired samples and connected datapoints show results for paired samples (corresponding variants are connected by a dotted line). An asterisk indicates a candidate driver. c, Genomic features linked to patients’ PFS (left panel) and OS (right panel). Hazard ratio and FDR of each genomic feature tested against PFS using a Cox proportional-hazards model on the subset of patients for which clinical outcomes data were available (n = 243). Adjusted P values (FDR) are shown in different colors. (See Supplementary Table 14 for the full detailed list of genomic features tested and Supplementary Table 15 and 16 for full results of the statistical tests). df, candidate driver IRF2BP2 was recurrently affected by CN losses (d) and SNVs/indels, especially truncating ones (e), and was associated with increased CCF in variants for more advanced disease stage (f). Coloured rectangle in (e) represents protein domains. gj, candidate driver SMCHD1 was recurrently affected by CN losses (g) SNVs/indels, especially truncating ones (h), presented evidence of increased CCFs in more advanced CLL in cohort (2) (no data available in R/R of cohort (1)) (1), and associated with more adverse overall survival as shown in the Kaplan–Meier plot where shaded areas show the 95% confidence intervals and P values were derived from a log-rank test (j). Coloured rectangle in e represent protein domains. Boxplots show the minimum and maximum values and interquartile range and each individual variant is represented with an individual datapoint. Source data
Fig. 4
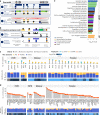
Fig. 4. Significantly mutated noncoding REs.
a, Methodology to localize noncoding REs in CLL primary cells. These REs were defined across the whole genome based on chromatin state data from CLL primary cells. We intersected H3K27ac peaks and open chromatin regions defined by ATAC-seq (derived from 104 and 106 primary CLL, respectively). Next, these regions were annotated using genome-wide segmentations of seven CLL samples (five mutated and two unmutated IGHV cases) with available chromatin immunoprecipitation followed by sequencing (ChIP–seq) data of six histone marks including H3K4me3, H3K4me1, H3K27ac, H3K36me3, H3K27me3 and H3K9me3. As our annotations of noncoding variants were based on CLL samples from different cohorts, chromatin states defined by ChIP–seq were considered only for regions that were seen in at least two samples. Common regions based on shared overlaps were used to define these REs. REs active exclusively in samples with m-IGHV and u-IGHV mutational status were also defined. REs were linked to target genes by correlating RNA expression (gene) and H3k27ac (REs) (Pearson correlation 0.3, FDR ≤ 0.05), within topologically associated domains of GM12878 defined by Hi-C. For additional annotations and more details, see Methods. b, Candidate noncoding drivers including UTRs, promoters and enhancers affected by SNVs/indels, were revealed using several discovery algorithms and regions with FDR below the significance threshold were selected. The presence of single-site hotspots, and regions with high mutational density/kataegis were reported and regions with FDR below the significance threshold were selected. Annotations and postfiltering of somatic noncoding hits were including immunoglobulin loci and known false positive exclusion, AID and APOBEC signature annotations, and additional genomic and functional annotations from the literature. c,d, Significantly mutated REs for which target genes are CLL drivers or in the COSMIC database (c) or other genes (d). Upper panel, number of samples mutated; middle panel, proportion of variants with signature attributed to AID, APOBEC or other processes; lower panel, FDR of the likelihood these regions as mutated more frequently than expected. e, Gene set enrichment analysis based on the target genes of all noncoding candidate drivers for gene ontology terms biological process (GO:BP) and human phenotype ontology (HP). We applied a hypergeometric test and multiple testing correction of P value using the g:SCS algorithm. Source data
Fig. 5
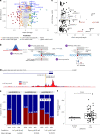
Fig. 5. Noncoding mutations impacting BCL genes.
a, Genome view of BCL2 5′ UTR. The significantly mutated region is indicated by a black rectangle. Individual somatic mutations are shown in blue. b, Gene expression of BCL2 in TPM determined by RNA-seq in samples with BCL2 5′ UTR mutations versus WT. Black dots are marks as outliers. P value was derived from a two-sided Welch’s t-test. c, Gene expression in TPM determined by RNA-seq of BCL6 in samples with BCL6 enhancer mutations versus WT. Expression levels were split in low (less than median expression; green), medium (between median expression and 100; orange) and high (≥100 TPM; purple). P value was derived from a two-sided Wilcoxon test. d, Genome view of the BCL6 gene and enhancers. Enhancers within these regions are annotated in blue font. eBCL6_2, which was the target of several variants is indicated in red. Annotation tracks of ATAC-seq and ChIP–seq are from publicly available RE annotation detailed above (references containing detailed of datasets and figure legends). The lower panel shows the individual mutations color coded as defined in c. All boxplots show the minimum and maximum values and interquartile range. Source data
Fig. 6
Fig. 6. Mutations in the promoter of BACH2 associated with reduction of chromatin accessibility and RNA expression.
a, Prediction of the impact of noncoding mutations in promoters on transcription factor binding from cell- and tissue-specific DNase footprints. Mutations in BACH2 promoters are annotated (blue), specific BACH2 promoters detailed later are in red. GoF/LoF, gain/loss of function; B cell type specific, prediction observed in dataset examined; multi-B cell type, prediction observed in several dataset examined (robust); open multi-B cell, open chromatin region predicted; none, no prediction. b, Methodology to explore the effect of BACH2 promoter mutations. (1) We compared VAF of WGS data and ATAC-seq data to find allelic skew, that is, a preference for accessibility on the reference or the mutant allele. TSS, transcription start site. (2) We examined the change in chromatin accessibility in regions of interest in mutated compared with WT samples. (3) We compared VAF of WGS data and RNA-seq data to find allelic skew, that is, a preference for RNA expression on the reference or the mutant allele. (4) We compared the gene expression in mutated versus WT samples by RNA-seq. c, Prioritization of noncoding variants based on sequencing depth at the loci in the ATAC-seq data and allelic skew between the ATAC-seq and WGS data. Datapoints with difference less then –0.1 or greater than 0.1 and sequencing depth of at least ten times are annotated in black font. The BACH2 promoter is indicated in red font. d, ATAC-seq signal at the promoter of BACH2. The blue track shows the combined signal from all 24 patient samples; overlaid is the signal from a sample (pink) with a variant in the center of the RE. The location of variants in the same RE from three other patients are highlighted. e, Fraction of mutant and WT read in three BACH2 promoter variants showing allelic skew in ATAC-seq and RNA-seq compared with WGS. Prediction and mean damage scores were calculated with DeepHaem. f, Gene expression distribution (the minimum and maximum values and interquartile range) of BACH2 in TPM determined by RNA-seq in samples with promoter mutations versus sample WT. The statistical test used was a two-sided Welch’s t-test. Source data
Fig. 7
Fig. 7. Data integration and genome-wide global lesions.
a, Distribution of the type of alterations in CLL coding drivers affected only by coding mutations (top panel) and affected by coding, CNAs and/or mutations in their REs (bottom panels). b, Distribution of the number of mutations per sample when considering all functional mutations (blue shading), SNVs/indels in coding drivers (green shading) and coding and noncoding drivers and CNAs (purple shading). c, Proportion of samples with mutated pathways, when considering coding drivers only (green), coding drivers and other genes with high impact mutations (involving frameshift and stop coding mutations (yellow)) and all coding as well as noncoding drivers (red). d, Telomere lengths distribution (showing the minimum and maximum values and interquartile range) in normal samples and matched CLL samples. Lines link matched tumor-normal datapoints. Significance level shows two-sided paired Wilcoxon test of P value <0.001. e, Fraction of each mutational signature detected in different genomic scopes: the 58 coding drivers; exonic regions; promoters, enhancers and UTRs; and whole genome. f, Fraction of each mutational signature detected in each coding driver. DBS not shown as data were too scarce. g, Distribution of the eight GC groups, based on presence (dark gray) or absence (light gray) of the three variables selected as best predictor by MCA: CN losses (Loss), CN gains (Gain) and trisomy (Tri). TP53 alteration status and conventional GC status are indicated in the top panel. Source data
Fig. 8
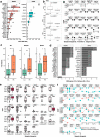
Fig. 8. Relationship between genomic features and patient outcome.
a,b, Kaplan–Meier curve on PFS (a) and OS (b) of TP53 altered/WT in combination with GC7/8. The P value was derived from a log-rank test comparing the most two extreme curves (additional data in Extended Data Fig. 10). The dotted lines indicate the median survival for each subgroup. c,d, Genomic factors comprising the GS (cut-off 0.5) derived using non-negative matrix factorization, hypermutated subset (u-GS) (a), unmutated subset (m-GS) (b). The plot only shows features that split the data. e,f, Kaplan–Meier curves of PFS of samples divided by GS. Only samples with PFS data were included (n = 243). In e, the unmutated subset, del17p/TP53 mutated samples are plotted separately (black curve), all u-GS1 cluster 1 samples fell into this grouping; In f, the hypermutated samples, del17p/TP53 mutated samples are plotted separately (black curve). The P value was derived from a log-rank test comparing the most two extreme curves. The dotted lines indicate the median survival for each subgroup g, Confusion matrix showing agreement between true and predicted subgroup assignment. The true subgroup assignment was determined by applying the previously described NMF approach (Methods) to the whole set of genomic data. The predicted subgroup assignment was determined by first using 80% of the genomic data for subgroup assignment (training phase) followed by predicting the subgroup assignment in the remaining 20% of the data (testing). In all cases, sex and age were included to inform the model (Methods).
Extended Data Fig. 1
Extended Data Fig. 1. Recurrent CNAs contributing to the identification of candidate drivers.
a, Number of samples with copy number gains (upper track, red) and losses (lower track, blue) (y axis) according to the genomic coordinates of the full chromosome from 5’ to 3’ (x axis), for each chromosome (panels). b-c, MutComFocal scores for genes affected by CN losses and mutations (b) and gene significantly affected by CN gains and mutations (c) Genes classified as tier 1 and 2 were selected for further investigations. Source data
Extended Data Fig. 2
Extended Data Fig. 2. Recurrent inversions and translocations.
a, Number of samples with inversions (y axis) according to the genomic coordinates of the full chromosome from 5’ to 3’ on each chromosome (x axis), for each chromosome (panels). b-c, Distance between all inversion (b) and translocation (c) (breakpoints across all 485 samples on each chromosome highlighting hotspot breakpoints (named kataegis, in red). Source data
Extended Data Fig. 3
Extended Data Fig. 3. Characterization of candidate genes and regions of CNAs.
a, Number of variants previously reported in the COSMIC database. b, Number of variants for each consequence. c, Distribution of cancer cell fractions binned in four groups [1-0.75],]0.75-0.5],]0.5-0.25],]0.25-]. The number of variants represented in each boxplot is detailed in Supplementary Table 12. d, Number of variants occurring in protein domains including two types of protein domains: sites and regions, as defined in by Prot2HG.e, Distribution of cancer cell fractions of recurrent CN gains (red) and CN losses (blue). All boxplots show the minimum and maximum values and interquartile range. The number of CNAs represented in each boxplot is detailed in Supplementary Table 6. Source data
Extended Data Fig. 4
Extended Data Fig. 4. Integration of RNA-seq and timeseries to investigate candidate drivers.
a, Distribution of variant allele fraction calculated from the RNA-seq data of variants detected by WGS. The number of variants represented in each boxplot is detailed in Supplementary Table 13. b, RNA-seq defined transcripts per million (TPM) of selected genes TP53 (n = 7 mutated vs. 66 WT), ATM (n = 6 mutated vs. 67 WT), and SETD2 (n = 7 mutated vs. 68 WT), according to the presence of a genomic alterations (ALT) or an absence of alteration (WT). p-values were calculated using a two-sided Welch’s t-test. c, Number of driver genes per sample for CLL samples and paired Richter’s’ syndrome (RS) samples (n = 16 vs. 16) for all 58 drivers (left panel) p = 2.4 ×10⁻³, the 36 known genes (central panel) p = 5.8 ×10⁻³ and 22 candidate genes (right panel) p = 2.1 ×10⁻³ (two-sided Welch’s t-test). d, Difference of number of mutated samples in Richter Syndrome (RS) samples vs paired CLL samples. Each bar indicates the absolute number of mutated samples per group. e-f, Distribution of cancer cell fractions (CCFs) in frontline samples vs. relapsed/refractory (R/R) samples (cohort 1, unpaired samples) (e), and CLL vs RS as well as frontline vs. relapsed (cohort 2 and 3, paired samples) (f). Corresponding variants are connected by a dotted line. Panels are ordered based on the direction of evolution: high stable CCFs and increasing CCFs, mixed increasing/decreasing CCFs, low/decreasing CCFs. Figures are not shown if no R/R / T2 sample carried a mutation. * indicates candidate drivers. g, Distribution of cancer cell fractions in frontline vs. relapsed (paired samples). Corresponding variants are connected by a dotted line. Panels are ordered based on the direction of evolution: high stable CCFs and increasing CCFs, mixed increasing/decreasing CCFs, low/decreasing CCFs. All boxplots show the minimum and maximum values and interquartile range and all datapoints are represented. Source data
Extended Data Fig. 5
Extended Data Fig. 5. Annotations of non-coding candidate CLL drivers in regulatory elements.
a, Genomic map of non-coding drivers per chromosome (panels) according the genomic coordinates of the full chromosome from 5’ to 3’ (x axis). Methods of detection were discovery algorithms (disc. algorithms), mutational hotspot analysis (mut. hotspots). b, Number of mutations in non-coding genomic elements (top panel) and proportion of variants with signature attributed to AID, APOBEC or other processes (bottom panel) for regulatory elements exclusively active in samples with u-IGHV. c, Distribution (showing the minimum and maximum values and interquartile range) of CCFs in significantly mutated UTRs. The number of variants represented in each boxplot is detailed in Supplementary Table 17. Source data
Extended Data Fig. 6
Extended Data Fig. 6. Investigation of significantly mutated promoters by ATAC-seq and RNA-seq.
a, Prioritization of significantly mutated promoters using DeepHaem prediction results. BACH2 showed the highest number of loss-of-function variant compared to the total number of variants in its promoter. b, allelic skew of mutations in the promoter BACH2 (n = 3). c, Distribution of allelic skew in ATAC-seq and RNA-seq data compared to WGS data in all variants located in significantly mutated promoters. The RNA enrichment was calculated by the difference of expression in the mutated sample with the mean expression across the cohort. Variants in promoter of interest were located in the top right corner (increase of allelic fraction of mutant in ATAC-seq and RNA-seq) and bottom left corner (decrease of allelic fraction of mutant in ATAC-seq and RNA-seq). d, Fraction of mutant and WT reads in one ATAD1 promoter variants showing allelic skew in ATAC-seq and RNA-seq compared to WGS. e, Allelic skew of mutations in the promoter ATAD1 (n = 2). All boxplots show the minimum and maximum values and interquartile range. f, Gene expression of ATAD1 in transcript per million (TPM) determined by RNA-seq in samples with BCL2 5’UTR mutations vs. WT. Black dots are marks as outliers. P-value was derived from a two-sided t-test. Source data
Extended Data Fig. 7
Extended Data Fig. 7. Mutational burden influenced patients’ survival.
a-b, Kaplan-Meier curves on number of drivers defined as (a) number of mutated coding drivers (SNVs/indels), and (b) number of mutated coding drivers (SNVs/indels + CNAs). High denotes > median and low denotes < = median. P-values were derived from a log-rank test. Shading denotes confidence intervals and dotted lines median survival for each group.
Extended Data Fig. 8
Extended Data Fig. 8. Telomere and mutational signatures associated with adverse outcome.
a, Pearson correlation between telomere content (assessed by Telomere Hunter v1.1.0) and telomere length (assessed by Telomerecat v1.0). b, Comparison of telomere content distribution (showing the minimum and maximum values and interquartile range) (Telomere Hunter) between normal samples and CLL samples. Lines link match tumor-normal datapoints. Significance was showing two-sided paired Wilcoxon test of p-value <0.001 (n = 485 tumor samples vs. 485 germline samples). c-g, Kaplan-Meier curves of genomic features with lowest false discovery rate (FDR) when tested against progression-free survival (PFS) using a Cox proportional-hazards model (univariate analysis). P-values were derived from a log-rank test. Shading denotes 95% confidence intervals (additional data in Supplementary Table 15). Source data
Extended Data Fig. 9
Extended Data Fig. 9. Genomic complexity sub-groups.
a, Multiple correspondence analysis (MCA) plot showing the top two dimensions: dimension 1 (44% of variance) and dimension 2 (21% of variance). Each datapoint represents one sample. b, MCA variable representation according to the top two dimensions. Variables are represented as binary: “no” is “absence” and “yes” is “presence”. c, Number of samples and description of the 8 groups defining genomic complexity (GC): each group is presented with a different color (matching other figures). Dark grey squares denote the presence of the alteration and white squares denote the absence of alteration. d, MCA plot showing the 8 GC groups. Colours keys are provided in c. e, Enrichment of genomic features for each group according to the Fisher’s exact test for count data (FDR < 0.05 and estimate > 1), CNA: recurrent copy number alterations, coding: coding drivers, Global: genome-wide global lesions. f, Proportion of samples reported with GC (the conventional definition of > = 4 CNAs) in each GC group. g, Enrichment of GC groups for stereotyped subsets. No significant results were found using a two-sided Fisher’s Exact test. Group #5 was not tested as sample size was lower than threshold. Source data
Extended Data Fig. 10
Extended Data Fig. 10. Genomic complexity and survival.
a-b, Kaplan-Meier curve on (a) progression-free survival (PFS) and (b) overall survival (OS) of all 8 genomic complexity (GC) groups. c-d, Kaplan-Meier curve on (c) PFS and (d) OS of all 8 GC groups independently from TP53 alterations. Group 5 is not presented due to small sample size. Groups were further combined to increase power, by focusing on presence / absence of CN gains and losses and omitting trisomy data. P-values were derived from a log-rank test. Shading denotes confidence intervals. e, Penalised Cox Regression performed on 186 genomic features identified independent predictors for progression-free survival. Each panel shows the hazard ratios for those genomic features that jointly minimise the out-of-sample prediction error (estimated through leave-one-out cross-validation). The full list and details of each genomic feature is presented in Supplementary Table 21.

References

    1. Puente XS, et al. Whole-genome sequencing identifies recurrent mutations in chronic lymphocytic leukaemia. Nature. 2011;475:101–105. - PMC - PubMed
    1. Schuh A, et al. Monitoring chronic lymphocytic leukemia progression by whole genome sequencing reveals heterogeneous clonal evolution patterns. Blood. 2012;120:4191–4196. - PubMed
    1. Puente XS, et al. Non-coding recurrent mutations in chronic lymphocytic leukaemia. Nature. 2015;526:519–524. - PubMed
    1. Kasar S, et al. Whole-genome sequencing reveals activation-induced cytidine deaminase signatures during indolent chronic lymphocytic leukaemia evolution. Nat. Commun. 2015;6:8866. - PMC - PubMed
    1. Zhao Z, et al. Evolution of multiple cell clones over a 29-year period of a CLL patient. Nat. Commun. 2016;7:13765. - PMC - PubMed

Publication types