. 2022 Nov 4;5(1):1181.
doi: 10.1038/s42003-022-04102-4.

Reprogramming of pancreatic adenocarcinoma immunosurveillance by a microbial probiotic siderophore

Affiliations

Reprogramming of pancreatic adenocarcinoma immunosurveillance by a microbial probiotic siderophore

Mehdi Chaib et al. Commun Biol. .

Abstract

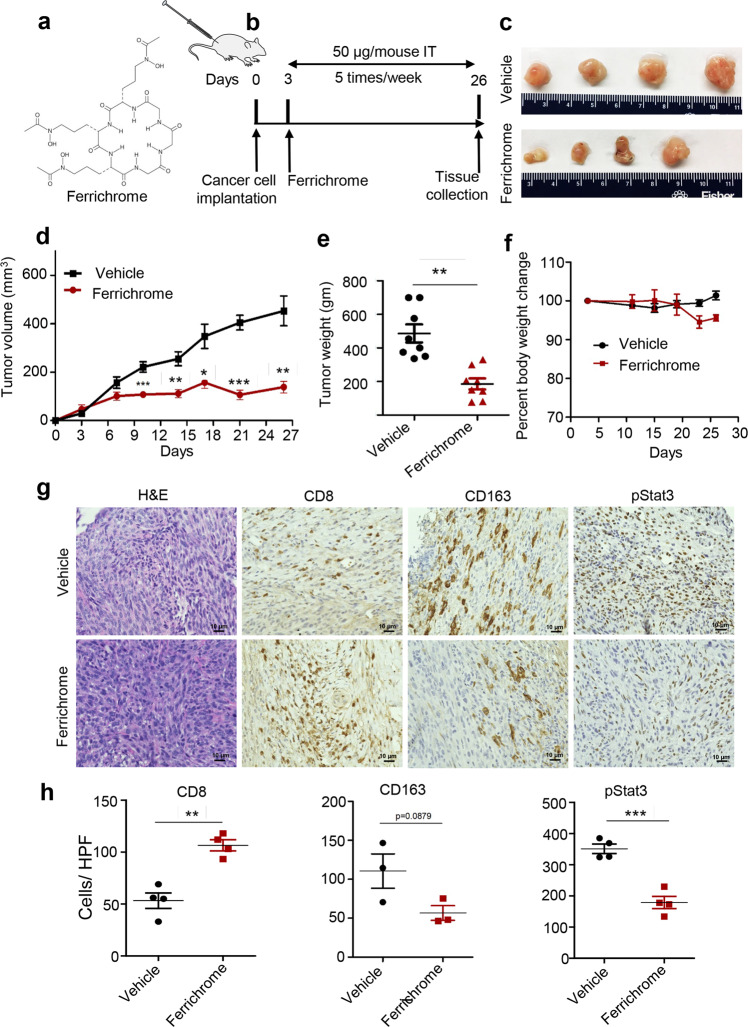
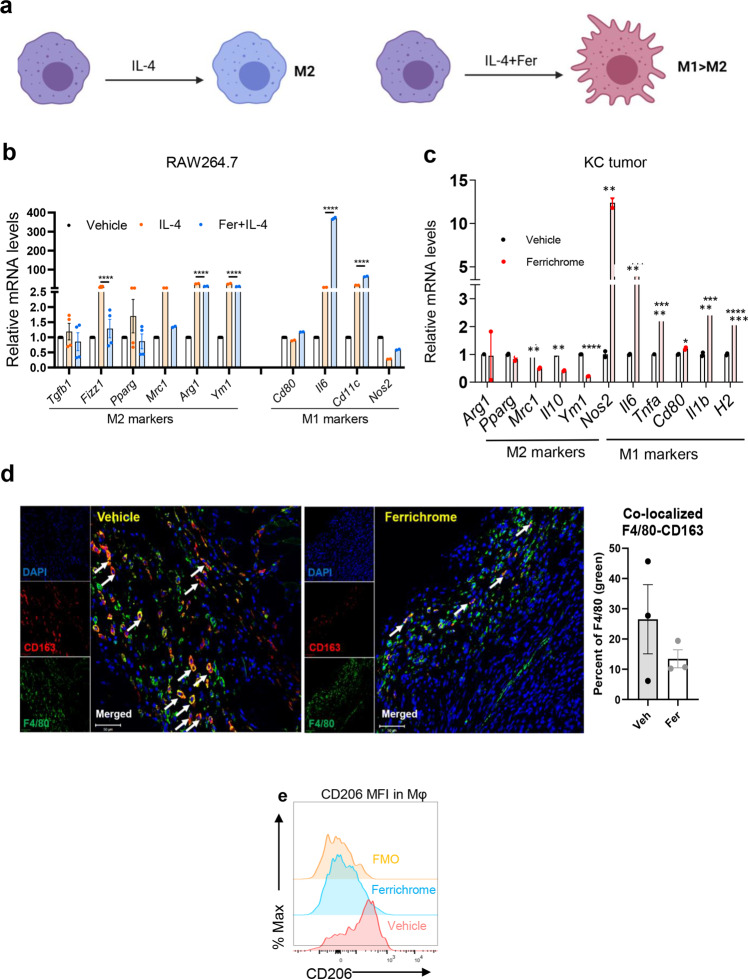
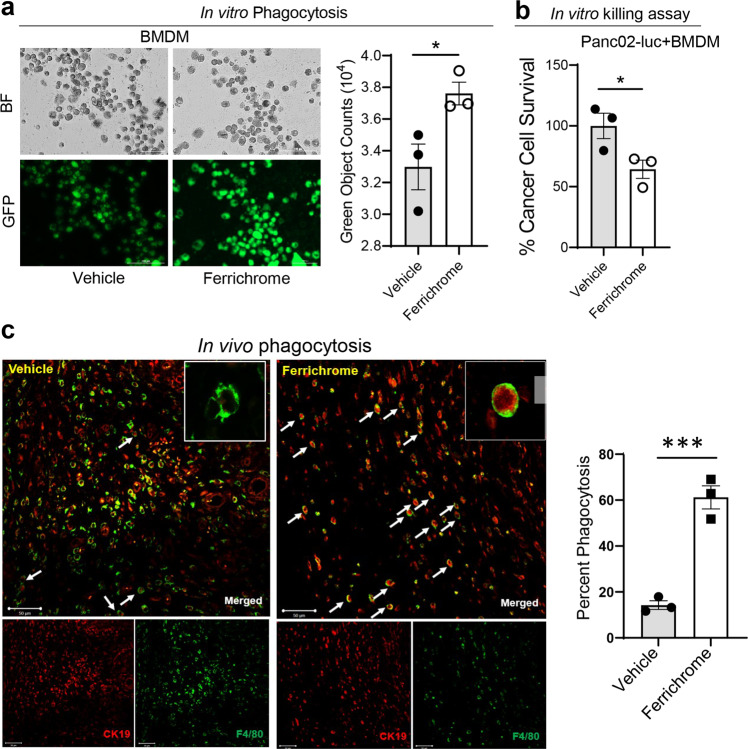
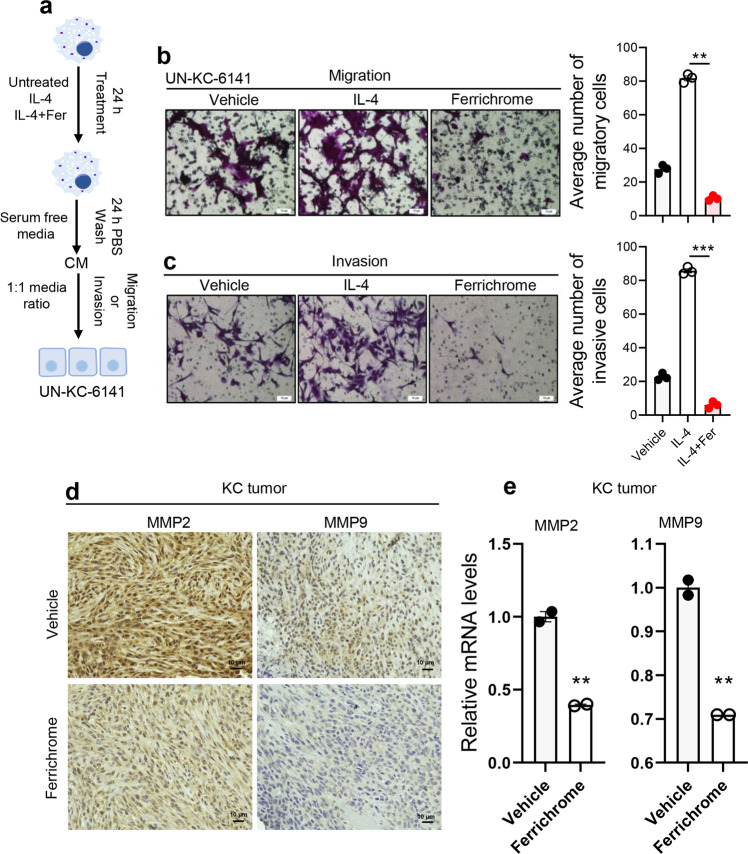
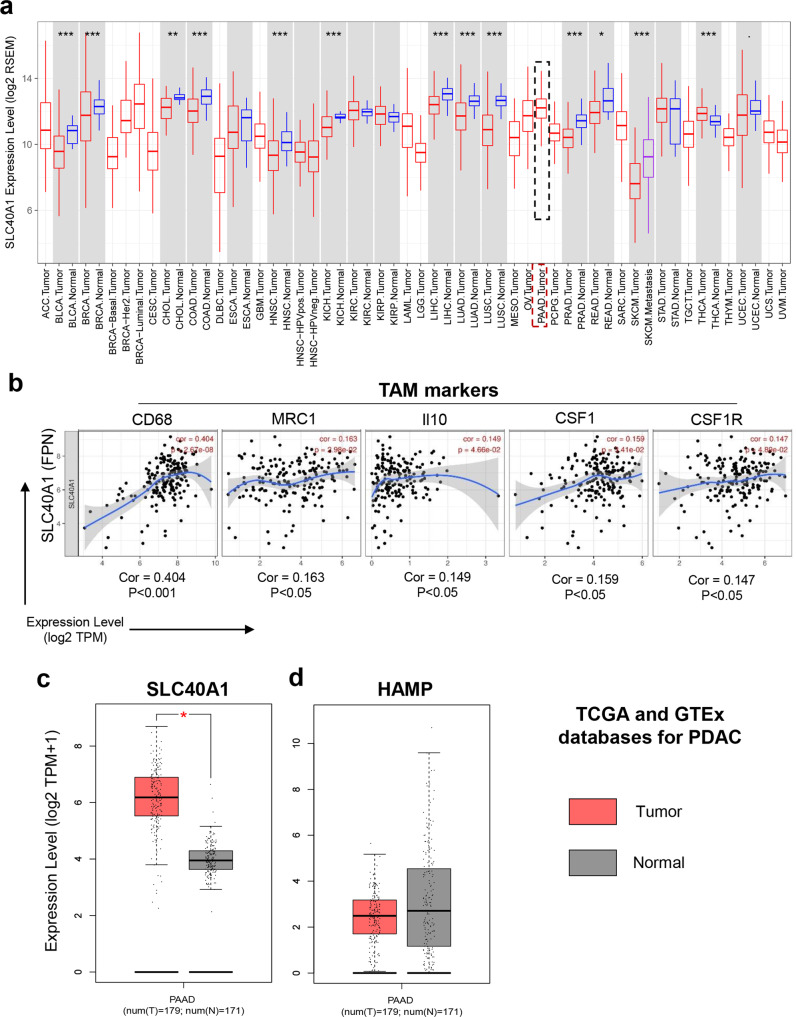
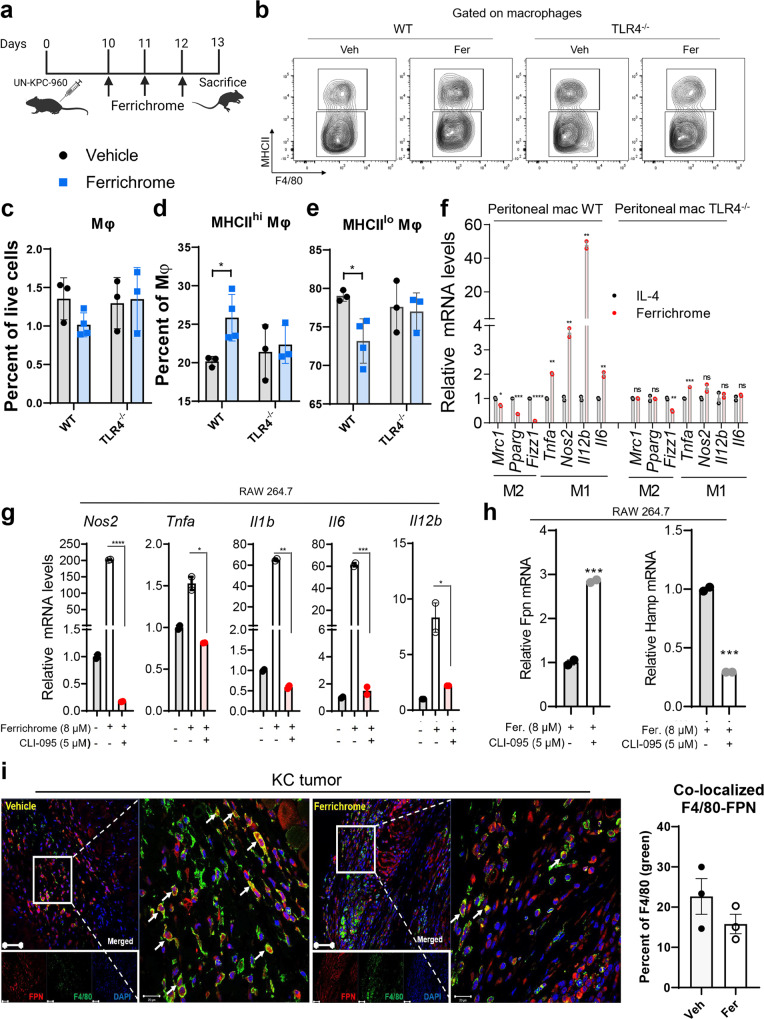
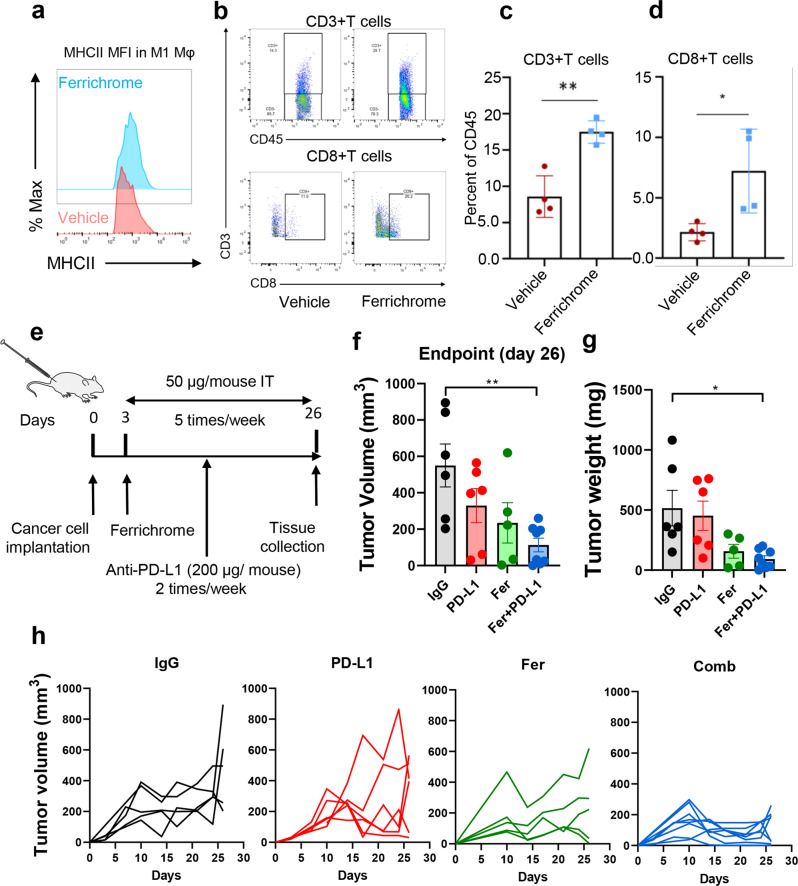
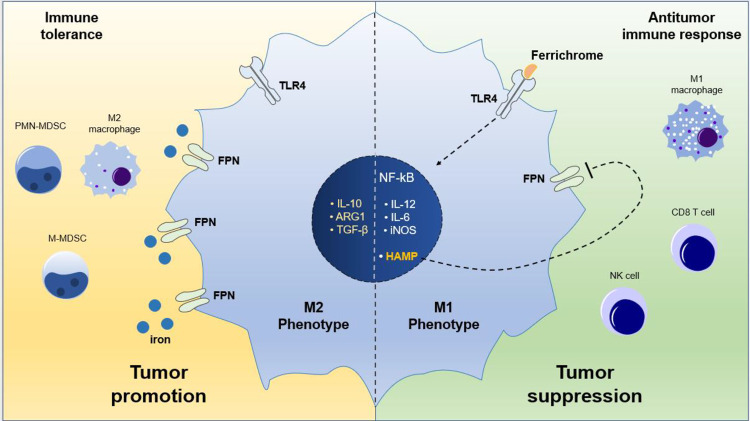
There is increasing evidence suggesting the role of microbiome alterations in relation to pancreatic adenocarcinoma and tumor immune functionality. However, molecular mechanisms of the interplay between microbiome signatures and/or their metabolites in pancreatic tumor immunosurveillance are not well understood. We have identified that a probiotic strain (Lactobacillus casei) derived siderophore (ferrichrome) efficiently reprograms tumor-associated macrophages (TAMs) and increases CD8 + T cell infiltration into tumors that paralleled a marked reduction in tumor burden in a syngeneic mouse model of pancreatic cancer. Interestingly, this altered immune response improved anti-PD-L1 therapy that suggests promise of a novel combination (ferrichrome and immune checkpoint inhibitors) therapy for pancreatic cancer treatment. Mechanistically, ferrichrome induced TAMs polarization via activation of the TLR4 pathway that represses the expression of iron export protein ferroportin (FPN1) in macrophages. This study describes a novel probiotic based molecular mechanism that can effectively induce anti-tumor immunosurveillance and improve immune checkpoint inhibitors therapy response in pancreatic cancer.


Conflict of interest statement

The authors declare no competing interests.

Figures

Fig. 1
Fig. 1. Ferrichrome suppresses tumor growth and promotes antitumor immunity in a pancreatic cancer syngeneic mouse model.
a Chemical structure of ferrichrome (iron free) (deferrichrome). b Schematic representation of ferrichrome treatment regimen of UN-KC-6141 cells derived syngeneic mouse model of pancreatic cancer. One million syngenetic UN-KC-6141 pancreatic cancer cells were subcutaneously injected into the right flank of C57BL/6 J mice (n = 8). Ferrichrome was given five times per week intratumorally (50 µM) until day 25. Vehicle consisted of equivalent volume of 1X PBS. Mice were sacrificed at day 26. c Representative pictures of tumors resected at day 26 from ferrichrome or vehicle-treated mice. d The volumes of ferrichrome- and vehicle-treated tumors (n = 8). e Wet weights of UN-KC-6141 tumors treated with ferrichrome or vehicle (n = 8). f Body weights of mice treated with ferrichrome or vehicle (n = 5–8). g Representative H&E and immunohistochemistry images of, CD8, CD163 and pStat3 staining (n = 3–4), Original Magnifications ×400 (h) Quantification of CD8, CD163 and pStat3 positive cells per high power field in ferrichrome (maroon) or vehicle-treated tumors (black) (n = 3–4). Mean ± SEM shown. *p < 0.05, **p < 0.01, *** and p < 0.001, as determined by Student’s t test.
Fig. 2
Fig. 2. Ferrichrome abrogates M2 polarization of macrophages and promotes M1-like phenotype in vitro and in vivo.
a Representative scheme of in vitro polarization of RAW264.7 macrophages. M2 polarization of RAW264.7 cells were induced by culture with IL-4 (20 ng/mL) in the presence of ferrichrome or vehicle control (1× PBS) for 24 h. Control consisted of vehicle treated RAW264.7 cells. RNA was collected for qPCR analysis. b Differential gene expression of M1 and M2 biomarkers between IL-4-treated and ferrichrome (8 μM) + IL-4-treated RAW264.7 cells after 24 h of culture as evaluated by qPCR analysis. Graph is representative of two or more independent experiments with N = 2–4. c Differential gene expression of M1 and M2 markers in UN-KC-6141 tumors treated with vehicle or ferrichrome (pooled from n = 3 biological replicates). d Representative images and quantification of dual staining of macrophage markers F4/80 (green) and CD163 (red) in tumors treated with ferrichrome or vehicle as evaluated via immunofluorescence and imaged using confocal microscopy. Quantification was evaluated using ImageJ (n = 4). Nucleus was stained with DAPI (blue). Bar on micrographs indicates 50 µm. e Representative histogram of M2 marker CD206 Mean Fluorescence Intensity (MFI) in gated macrophages (CD45 + CD11b + Ly6C− Ly6G− F4/80+) of ferrichrome (blue) or vehicle-treated (red) tumor single cell suspensions as evaluated by flow cytometry analysis (n = 4 experiments). Fluorescence Minus One (FMO) (orange) was used as a negative control. Mean ± SEM shown **p < 0.05, ***p < 0.01, and ****p < 0.001, as determined by Student’s t test or two-way ANOVA.
Fig. 3
Fig. 3. Ferrichrome promotes phagocytosis and cancer cell killing capacity in macrophages in vitro and in vivo.
a Representative image and quantification of phagocytosis of fluorescent E. coli bioparticles by BMDMs with the presence of ferrichrome (20 µM) or vehicle (control) as evaluated by fluorescent microscopy imaging on the FITC channel (n = 3 experiments). b Antitumor activity of BMDMs against luciferase-expressing pancreatic cancer cells Panc02 in the presence of ferrichrome or vehicle control. Cancer cells were co-cultured with BMDMs at a macrophage: cancer cell density of 1:1 for 48 h. Tumor cell survival was determined by normalizing luminescence to tumor-only controls (n = 3). c Representative images of evidence of phagocytosis of cancer cells by macrophages in ferrichrome-treated tumors (right panel) or vehicle-treated tumors (left panel). Images were quantified using ImageJ software. A phagocytic event is defined by the presence of cancer cell marker Cytokeratin 19 (CK19) (red) within the macrophage markers F4/80 (green) as evaluated by dual-immunofluorescence analysis (n = 4 mice). Bar on micrographs indicates 50 µm. Mean ± SEM shown. *p < 0.05, and ***p < 0.001 as determined by Student’s t test.
Fig. 4
Fig. 4. Ferrichrome abrogates macrophage-mediated cancer cell migration and invasion.
a Representative scheme of in vitro experimental design to evaluate the effect of ferrichrome on macrophage-mediated cancer cell migration and invasion. RAW264.7 macrophages were treated with vehicle, IL-4 (20 ng/mL), or ferrichrome + IL-4 for 24 h. Conditioned media (CM) was collected by culturing RAW264.7 cells for an additional 24 h in serum-free RPMI 1640 media. UN-KC-6141 pancreatic cancer cells were treated with CM at a ratio of 1:1 cancer cell media: CM for 24 H, then migration and invasion of cancer cells was evaluated via Boyden Chamber migration and invasion assays. b Representative images and quantification of migratory cells in # high power fields. c Representative image and quantification of invasive cells in # high power fields. d Representative immunohistochemistry images of MMP2 and MMP9 protein expression in tumors treated with either ferrichrome or vehicle (n = 4 mice). Original Magnifications ×400. e Relative gene expression analysis of MMP2 and MMP9 in tumors treated with ferrichrome or vehicle as evaluated by qPCR analysis (n = 3 experiments). Mean ± SEM shown. **p < 0.01, and ***p < 0.001 as determined by Student’s t test.
Fig. 5
Fig. 5. SLC40A1 expression is upregulated in pancreatic cancer tumor tissues compared to normal pancreas.
SLC40A1 also correlates positively with TAMs signature in pancreatic tumors. a Differential expression of SLC40A1(in blue rectangle) across different normal tissue (blue) and cancer (red) types as determined using online resource TIMER for TCGA data. b Correlation of SLC40A1 gene expression with TAMs gene signature in pancreatic tumors as determined using TIMER. Differential gene expression levels between normal pancreas and pancreatic tumors for (c) SLC40A1 and (d) HAMP as determined by GEPIA2 online database.
Fig. 6
Fig. 6. Ferrichrome polarizes macrophages to an M1-like phenotype via down-regulation of ferroportin in a TLR4-dependent manner.
a Schematic representation of ferrichrome treatment regimen of UN-KPC-960 tumor-bearing WT and TLR4−/− mice. b Flow cytometry analysis of (c) total splenic macrophage content,(d) MHCIIhi (M1-like) and (e) MHClo (M2-like) splenic macrophage frequencies in WT and TLR4−/− mice treated with ferrichrome (blue) or vehicle control (black) (n = 3–4 mice per treatment group). f qPCR analysis of M1 and M2 markers in peritoneal macrophages isolated from wild-type or TLR4 knockout mice and treated with IL-4 alone (20 ng/mL) or ferrichrome + IL-4 for 24 h (n = 2–3). g PCR analysis of M1 markers in RAW264.7 cells treated with vehicle, ferrichrome, or ferrichrome + CLI-095 (TLR4 inhibitor) for 24 h. h qPCR analysis of Fpn and hepcidin mRNA levels in RAW264.7 cells pre-treated with CLI-095 in the presence or absence of ferrichrome for 24 h. Graphs are representative of at least two independent experiments with similar results. i Representative image and quantification of dual immunostaining of tumors treated with ferrichrome or vehicle for the macrophage marker F4/80 (green) and Fpn (red). Quantification was evaluated using ImageJ (n = 3 mice). Bar on micrographs indicates 50 µm. Mean ± SEM shown. **p < 0.01, and ***p < 0.001 as determined by Student’s t test.
Fig. 7
Fig. 7. Ferrichrome promotes CD8 + T cell infiltration in pancreatic tumors and improves anti-PD-L1 therapy.
a Representative histogram comparing MHCII MFIs in M1-like macrophages (gated CD45 + CD11b + Ly6C− Ly6G- F4/80+ MHCII-high) of tumors treated with ferrichrome (cyan) or vehicle (red) as determined by flow cytometry analysis (n = 3 mice). b Flow cytometry analysis of the frequency of (c) total T cells (CD3+) and (d) CD8 + T cells in tumors treated with ferrichrome (blue) or vehicle (maroon) (n = 4 mice). e Schematic representation of combination treatment regimen of ferrichrome and anti-PD-L1 of UN-KC-6141 syngeneic mouse model. Ferrichrome was given five times per week starting at day 3 while anti-PD-L1 (200 µg/mouse) was given twice per week starting at day 5. Tumors were resected at day 26 (n = 5–8). Graph representing mean values of (f) tumor volume at endpoint, (g) tumor weight and (h) tumor volume of individual mice per treatment group. Mean ± SEM shown. *p < 0.05, and **p < 0.01, and ***p < 0.001 as determined by Student’s t test for T cell analysis and one-way ANOVA for combination analysis.
Fig. 8
Fig. 8. Schematic representation illustrating summarized findings.
Ferrichrome polarizes macrophages to an M1-like phenotype via TLR4 activation which results in production of proinflammatory signals. TLR4 activation by ferrichrome modulates iron metabolism via downregulation of iron export protein Fpn via endogenous production of hepcidin. Activation of M1-like macrophages drives an antitumor immune response against pancreatic tumor cells via increase infiltration of CD8 + T cell.

References

    1. Sethi V, Vitiello GA, Saxena D, Miller G, Dudeja V. The Role of the Microbiome in Immunologic Development and its Implication For Pancreatic Cancer Immunotherapy. Gastroenterology. 2019;156:2097–2115.e2092. - PubMed
    1. Royal RE, et al. Phase 2 trial of single agent Ipilimumab (anti-CTLA-4) for locally advanced or metastatic pancreatic adenocarcinoma. J. Immunother. 2010;33:828–833. - PMC - PubMed
    1. Rahib L, et al. Projecting cancer incidence and deaths to 2030: the unexpected burden of thyroid, liver, and pancreas cancers in the United States. Cancer Res. 2014;74:2913–2921. - PubMed
    1. Siegel RL, Miller KD, Jemal A. Cancer statistics, 2020. CA: Cancer J. Clin. 2020;70:7–30. - PubMed
    1. Conroy T, et al. FOLFIRINOX or Gemcitabine as Adjuvant Therapy for Pancreatic Cancer. N. Engl. J. Med. 2018;379:2395–2406. - PubMed

Publication types