. 2022 Dec;36(12):2863-2874.
doi: 10.1038/s41375-022-01726-7. Epub 2022 Nov 4.

In vivo PDX CRISPR/Cas9 screens reveal mutual therapeutic targets to overcome heterogeneous acquired chemo-resistance

Affiliations

In vivo PDX CRISPR/Cas9 screens reveal mutual therapeutic targets to overcome heterogeneous acquired chemo-resistance

Anna-Katharina Wirth et al. Leukemia. 2022 Dec.

Abstract

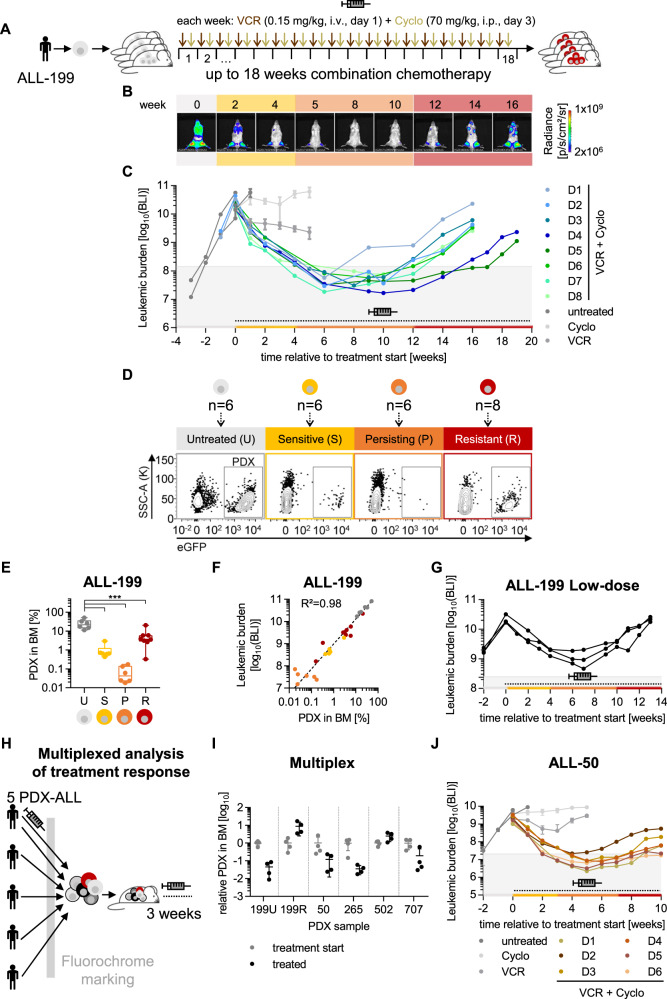
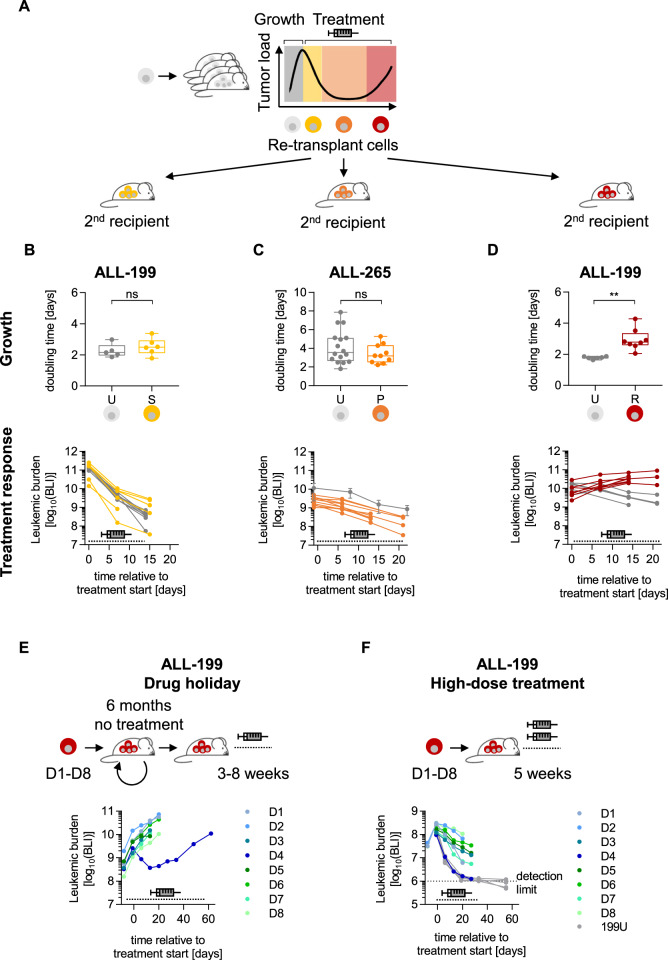
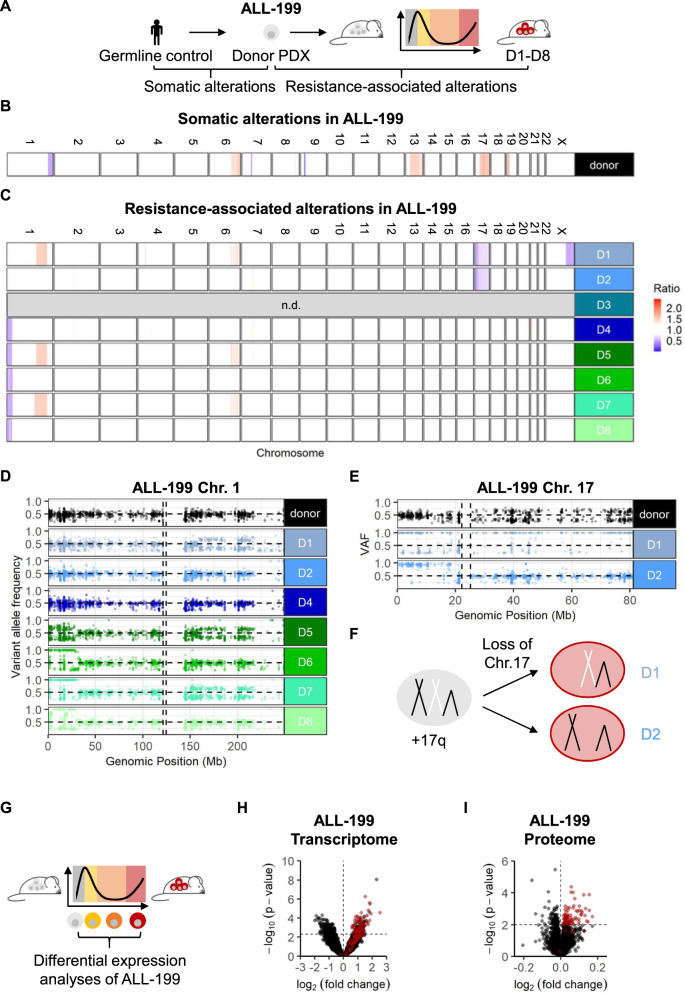
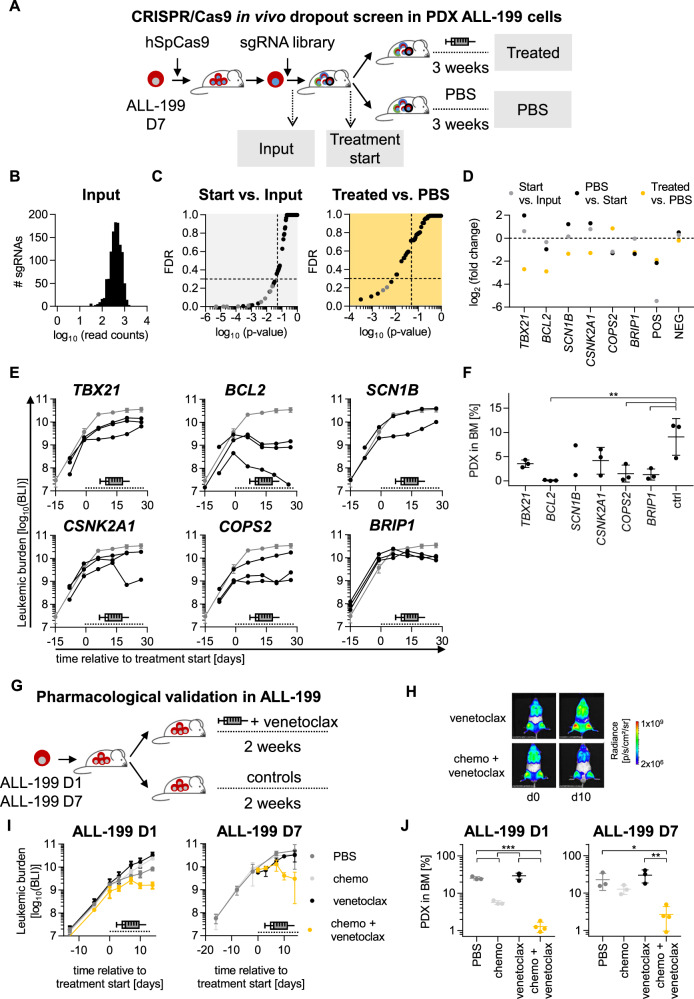
Resistance towards cancer treatment represents a major clinical obstacle, preventing cure of cancer patients. To gain mechanistic insights, we developed a model for acquired resistance to chemotherapy by treating mice carrying patient derived xenografts (PDX) of acute lymphoblastic leukemia with widely-used cytotoxic drugs for 18 consecutive weeks. In two distinct PDX samples, tumors initially responded to treatment, until stable disease and eventually tumor re-growth evolved under therapy, at highly similar kinetics between replicate mice. Notably, replicate tumors developed different mutations in TP53 and individual sets of chromosomal alterations, suggesting independent parallel clonal evolution rather than selection, driven by a combination of stochastic and deterministic processes. Transcriptome and proteome showed shared dysregulations between replicate tumors providing putative targets to overcome resistance. In vivo CRISPR/Cas9 dropout screens in PDX revealed broad dependency on BCL2, BRIP1 and COPS2. Accordingly, venetoclax re-sensitized derivative tumors towards chemotherapy, despite genomic heterogeneity, demonstrating direct translatability of the approach. Hence, despite the presence of multiple resistance-associated genomic alterations, effective rescue treatment for polychemotherapy-resistant tumors can be identified using functional testing in preclinical models.


Conflict of interest statement

The authors declare no competing interests.

Figures

Fig. 1
Fig. 1. An in vivo model of acquired resistance in PDX ALL.
ALL-199 PDX acquire resistance during long-term treatment in vivo. A Experimental procedure; PDX ALL-199 cells expressing luciferase were engrafted into 40 mice and in vivo bioluminescence imaging was performed repetitively in each mouse. At high leukemic burden, n = 6 mice were sacrificed (time point untreated (U), grey). Remaining mice received weekly injections of either VCR (0.15 mg/kg, i.v.) or Cyclo (70 mg/kg, i.p.) alone (n = 3 for Cyclo or VCR, respectively) or in combination (n = 28, VCR on day 1 and Cyclo on day 3) for a period of up to 18 weeks. Mice were sacrificed and PDX cells isolated from BM at defined time points: 3 weeks after start of treatment (sensitive (S), yellow, n = 6), at minimal residual disease around 10 weeks after start of treatment (persisting (P), orange, n = 3 each week, n = 6 in total) and at the end of the experiment (resistant (R), red, n = 8 in total). Remaining mice (n = 8) were sacrificed due to toxicity/illness throughout the experiment. B Representative imaging pictures of one mouse (D3) monitored over the course of the experiment. Weeks relative to treatment start are shown. Background colours indicate the disease stage as defined in A. C Quantification of bioluminescence imaging (BLI) signals. Mice treated with the combination regimen for up to 18 weeks (n = 8) were classified as resistant derivatives D1-D8, marked by individual colors. For D1-D8, each dot represents one measurement and each line represents one mouse; for untreated (n = 6), Cyclo (n = 3) and VCR (n = 3) groups mean+/− SD is shown, and individual mice are shown in Fig. S1B. Dashed line and the syringe symbol indicate treatment period; grey area indicates tumor burden below 1% relative to start of treatment. D Flow cytometric analysis of PDX cells isolated from BM from one representative mouse at each time point; eGFP marks transgenic ALL-199 cells. E Quantification of PDX cells in BM from all mice was measured as in Fig. 1D and is depicted as a boxplot with median, 25th, and 75th percentile, and min/max indicated by whiskers; each dot represents one mouse. ***p < 0.001 by one-way ANOVA followed by Tukey’s multiple comparisons test. F Correlation of imaging signals of Figs. 1C and S1B and PDX proportions from Fig. 1E; each dot represents one mouse. Correlation curve and R² were calculated using non-linear regression. G Low dose treatment of ALL-199. Experiment was performed as in Fig. 1A except that lower doses of chemotherapy were used (0.1 mg/kg VCR, 50 mg/kg Cyclo). Imaging signals were quantified and are depicted as in Fig. 1C (n = 3). Multiplexed analysis of treatment response of 5 PDX ALL models transplanted into the same mouse. H Experimental procedure. 4 untreated PDX ALL samples (ALL-50, ALL-265, ALL-502, ALL-707) together with untreated ALL-199U and resistant ALL-199R (from Fig. 1D) expressing individual fluorochrome markers were mixed and injected into groups of mice. After 4 weeks of in vivo growth, control mice were sacrificed (treatment start, n = 4), and remaining mice received either the combination chemotherapy applied in Fig. 1A–F (treated, n = 4, 0.15 mg/kg VCR and 70 mg/kg Cyclo) or solvent (PBS, n = 4) for 3 weeks. I Fluorochrome expression was analyzed for each mouse by flow cytometry. Individual PDX samples were identified and quantified based on the recombinant molecular markers. Proportion of each PDX sample at the end of treatment was normalized to the mean proportion of the respective sample within the mix at treatment start. Values below 100 upon treatment indicate that the sample responds to treatment; one dot represents the PDX population of one PDX ALL sample within one mouse. J ALL-50 PDX acquire resistance during long-term treatment in vivo. Experiment was performed as in Fig. 1A and depicted as in Fig. 1C, except that ALL-50 transgenic for luciferase/mCherry and a genetic barcode were used and mice were treated with adjusted dosing of 0.25 mg/kg VCR and 70 mg/kg Cyclo. Mice were treated with PBS (n = 6), VCR (n = 3), Cyclo (n = 3) or the combination (n = 20). Each color marks 1 resistant derivative D1-D6; for D1-D6, each dot represents one measurement and each line represents one mouse; additional data are shown in Fig. S1F–H.
Fig. 2
Fig. 2. Acquired resistance is leukemia cell-intrinsic and stable.
Resistance phenotype is preserved upon re-transplantation A Cells isolated at disease stages untreated (grey), sensitive (yellow), persisting (orange), and resistant (red) were re-transplanted into secondary recipient mice. Tumors were allowed to grow for 30–40 days in vivo before treatment was initiated at the same dose, route, and schedule as in the previous passage for 2–3 weeks. Leukemic growth and treatment response was monitored by repetitive imaging. B ALL-199S (n = 6) from Fig. S2B that were previously treated with combination chemotherapy (0.5 mg/kg VCR; 100 mg/kg Cyclo) for 2 weeks and untreated ALL-199 (n = 5) were used. Data is also shown in the middle panel of S2B. C ALL-265P (n = 10) from Fig. S1I that were previously treated with combination chemotherapy (0.3 mg/kg VCR; 70 mg/kg Cyclo) for at least 7 weeks were used. Untreated ALL-265U (n = 16) shown in Fig. S1I were used as control (depicted in grey). D ALL-199R (n = 8) from Fig. 1A–F previously treated with combination chemotherapy for up to 18 weeks (0.15 mg/kg VCR, 70 mg/kg Cyclo) and ALL-199U untreated controls (n = 6) were used. B-D: Upper panels: doubling time was calculated based on imaging values. Box indicates median, 25th, and 75th percentile; whiskers indicate min/max; each dot represents one mouse. **p < 0.01 by unpaired t-test. ns: not significant. Lower panels: treatment response was monitored by repetitive imaging; each dot represents one measurement and each line represents one mouse except for ALL-265U in C, where mean+/− SD is shown. E Resistance remains stable after drug holiday. Resistant derivatives D1-D8 were each transplanted into one mouse, grown to high tumor burden, and each re-transplanted into one next recipient mouse for 3 passages, resulting in a total of 6 months in the absence of treatment. At 4th passage and upon advanced tumor load, mice were treated with combination chemotherapy (0.15 mg/kg VCR, 70 mg/kg Cyclo) used in Fig. 1A–F for 3–8 weeks; data are depicted as in Fig. 1C; each dot represents one measurement and each line represents one mouse. F Partial resistance upon high-dose treatment. Resistant ALL-199 derivatives D1-D8 (n = 1 each) and untreated control cells (ALL-199U; n = 5) were each transplanted into mice; upon advanced tumor load, mice were treated with high-dose combination chemotherapy (0.6 mg/kg VCR, 100 mg/kg Cyclo) for 5 weeks and treatment response was monitored by repetitive imaging; mice engrafted with previously untreated cells were monitored for 5 more weeks to assess putative leukemia re-growth; data are depicted as in Fig. 1C, each dot represents one measurement and each line represents one mouse.
Fig. 3
Fig. 3. Heterogeneous genomic alterations, but shared expression features upon acquired resistance in ALL-199.
Genomic characterization of resistant ALL-199 derivatives A Whole exome sequencing was performed on ALL-199 germ line control obtained from healthy BM cells of the patient, donor PDX model, untreated cells and the eight resistant derivatives (D1-D8). Comparison between donor ALL-199 PDX and germline control to identify somatic alterations of the PDX leukemia (B); comparison between resistant D1-D8 and donor PDX to identify resistance-associated alterations (C); losses are depicted in blue and gains in red. Each row depicts one chromosome and each line depicts one sample. D3 was excluded due to poor sequencing quality. Magnification into chr. 1 (D) and chr. 17 (E); each dot represents a SNV as determined using hg19 as reference; homozygous SNV (VAF > 0.8) present in the donor sample and SNV with VAF < 0.2 were excluded. Horizontal dashed line represents VAF = 0.5, vertical dashed lines represent centromere positions. F Schematic representation of chr. 17 in donor PDX ALL-199 (light grey), where one allele of chr. 17q is duplicated, and in resistant derivatives D1 and D2 (red), where one of two whole chr. 17 alleles were lost. G-I Transcriptomic and proteomic profiling G Experimental layout: Transcriptomes were determined from ALL-199U (n = 5), ALL-199S (n = 6), ALL-199P (n = 5) and ALL-199R (n = 24, combined samples shown in Figs. 1C, 2D, S2I). Proteomes of ALL-199U (n = 4) and ALL-199R (n = 8) were analyzed. H Volcano plot representing genes differentially expressed between ALL-199U and ALL-199R; each dot represents one transcript; dashed lines indicate cut-offs for significant up- or downregulation (p < 0.005 and log2 fold-change >0 or <0, respectively). Red dots indicate candidates, which were chosen for further analysis. I Volcano plot of all differentially expressed proteins between ALL-199U and ALL-199R is shown and depicted as in Fig. 3H; dashed lines indicate cut-offs for significant up- or downregulation (p < 0.01 and log2 fold-change >0 or <0, respectively).
Fig. 4
Fig. 4. CRISPR/Cas9 induced knockout of BCL2 or treatment with venetoclax re-sensitize resistant PDX models to treatment.
CRISPR/Cas9 in vivo dropout screen in ALL-199 PDX cells reveals candidates relevant for acquired resistance A Resistant D7 cells were lentivirally transduced to express hSpCas9 followed by transduction with the sgRNA library (Table S11); after 3 days of in vitro cultivation and magnetic cell enrichment, the input sample was collected, and remaining cells transplanted into mice (n = 9). After 4 weeks of in vivo growth, control mice were sacrificed (treatment start, n = 2) and remaining mice were treated for 3 weeks with the combination chemotherapy (treated, n = 4, VCR 0.15 mg/kg, Cyclo 70 mg/kg) as in Fig. 1A–F or PBS (n = 3). PDX cells were re-isolated from murine BM of all mice, genomic DNA isolated, sgRNA library amplified, and sequenced by NGS, followed by data analysis using the MAGeCK algorithm. B sgRNA distribution of the input sample. C MAGeCK results comparing start vs. input (left panel) or treated vs. PBS (right panel); one dot represents one gene (pooled analysis of 5 sgRNAs per gene); grey dots indicate positive controls with p < 0.05; dashed lines indicate cut-off of p = 0.05 and false discovery rate (FDR) = 0.3. D Top dropouts from the screen plus controls as defined by either p < 0.05 and FDR < 0.3 in screen on D7 (TBX21, BCL2, SCN1B, CSNK2A1, and BRIP1) or by consistent depletion in the two screens on D7 and D5 (COPS2). Single validation of targets identified by CRISPR/Cas9 screen. E Experiments were performed identically as described for Fig. 4A, except that a single sgRNA was transduced per sample and mouse, targeting one of the six candidates depicted in Fig. 4D or non-targeting controls (19 different sgRNAs in total, i.e., 3 sgRNAs per target gene and 1 non-targeting control sgRNA). Cells were transplanted into 21 mice (n = 1 per target sgRNA, n = 3 per target gene or control). At high leukemic burden, all mice were treated with combination therapy used in Fig. 1A–F (0.15 mg/kg VCR, 70 mg/kg Cyclo) for 3 weeks and treatment response was monitored by repetitive imaging; each black line represents a single mouse, the grey line shows mean+/− SD of the 3 mice harboring non-targeting control sgRNA; the dashed line indicates the treatment period. F At the end of the experiment, PDX ALL-199 cells were isolated from the murine BM and leukemic burden quantified using flow cytometry and proportion of PDX was calculated. Mean+/− SD for each group is shown. One dot represents one mouse. **p < 0.01 by one-way ANOVA followed by Tukey’s multiple comparisons test. G-J Venetoclax re-sensitized resistant ALL-199 PDX derivatives to treatment. G Experimental design: ALL-199 D1 or D7 cells were engrafted into groups of NSG mice. At high leukemic burden, mice were treated for 2 weeks with PBS alone (n = 3) or venetoclax alone (n = 4, 100 mg/kg p.o. days 1–5) or the combination chemotherapy plus PBS (n = 3) or the combination chemotherapy plus venetoclax (n = 4, venetoclax 100 mg/kg p.o. days 1–5, 0.15 mg/kg VCR i.v. day 3 and 70 mg/kg Cyclo i.p. day 5). H Treatment response was monitored by imaging; One representative mouse per group is shown at d0 and d10 of treatment, respectively. I Quantification of imaging signals from all mice analyzed; mean+/− SD per group is shown; dashed line indicates treatment period; for D7, data of PBS and treated group was derived from previous experiment for comparison (Fig. S8E). J At the end of the experiment, PDX ALL-199 cells were isolated from the murine BM and quantified using flow cytometry and proportion of PDX was calculated. Mean+/− SD for each group is shown. One dot represents one mouse (n = 3 for PBS and treated, n = 4 for venetoclax and treated + venetoclax). *p < 0.05, **p < 0.01, ***p < 0.001 by one-way ANOVA followed by Tukey´s multiple comparisons test.

References

    1. Bukowski K, Kciuk M, Kontek R. Mechanisms of multidrug resistance in cancer chemotherapy. Int J Mol Sci. 2020;21. 10.3390/ijms21093233. - DOI - PMC - PubMed
    1. Vasan N, Baselga J, Hyman DM. A view on drug resistance in cancer. Nature. 2019;575:299–309. doi: 10.1038/s41586-019-1730-1. - DOI - PMC - PubMed
    1. Hata AN, Niederst MJ, Archibald HL, Gomez-Caraballo M, Siddiqui FM, Mulvey HE, et al. Tumor cells can follow distinct evolutionary paths to become resistant to epidermal growth factor receptor inhibition. Nat Med. 2016;22:262–9. doi: 10.1038/nm.4040. - DOI - PMC - PubMed
    1. Ramirez M, Rajaram S, Steininger RJ, Osipchuk D, Roth MA, Morinishi LS, et al. Diverse drug-resistance mechanisms can emerge from drug-tolerant cancer persister cells. Nat Commun. 2016;7:10690. doi: 10.1038/ncomms10690. - DOI - PMC - PubMed
    1. Turati VA, Guerra-Assunção JA, Potter NE, Gupta R, Ecker S, Daneviciute A, et al. Chemotherapy induces canalization of cell state in childhood B-cell precursor acute lymphoblastic leukemia. Nat Cancer. 2021;2:835–52. doi: 10.1038/s43018-021-00219-3. - DOI - PMC - PubMed

Publication types

Substances