. 2022 Nov 4;19(1):269.
doi: 10.1186/s12974-022-02633-5.

Fetuin-A alleviates neuroinflammation against traumatic brain injury-induced microglial necroptosis by regulating Nrf-2/HO-1 pathway

Affiliations

Fetuin-A alleviates neuroinflammation against traumatic brain injury-induced microglial necroptosis by regulating Nrf-2/HO-1 pathway

Pengzhan Zhao et al. J Neuroinflammation. .

Abstract

Background: The microglia-mediated inflammatory response is a vital mechanism of secondary damage following traumatic brain injury (TBI), but the underlying mechanism of microglial activation is unclear.

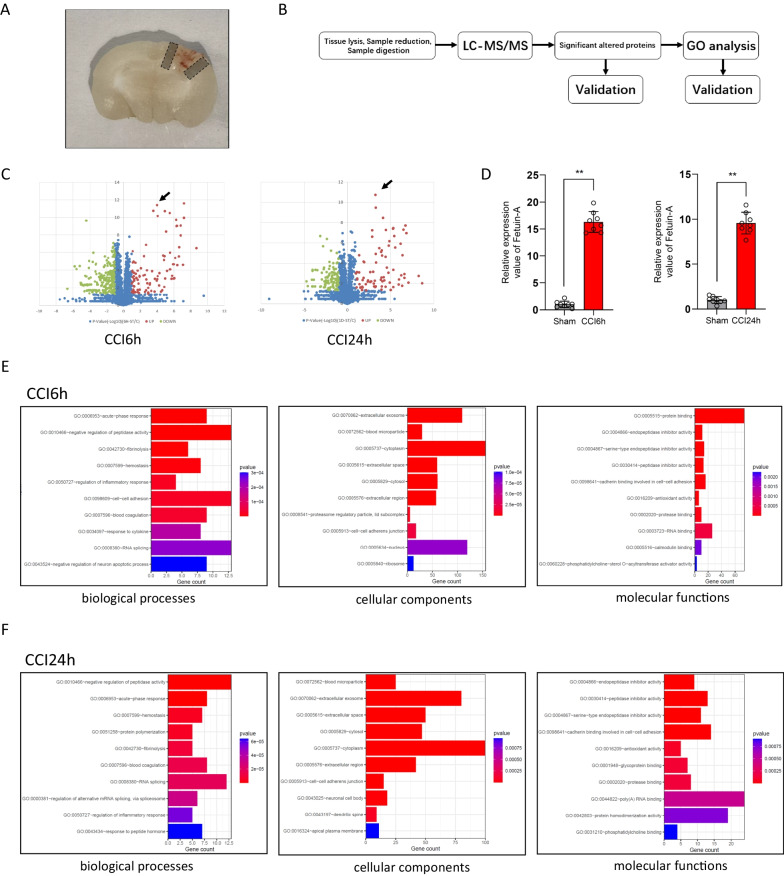
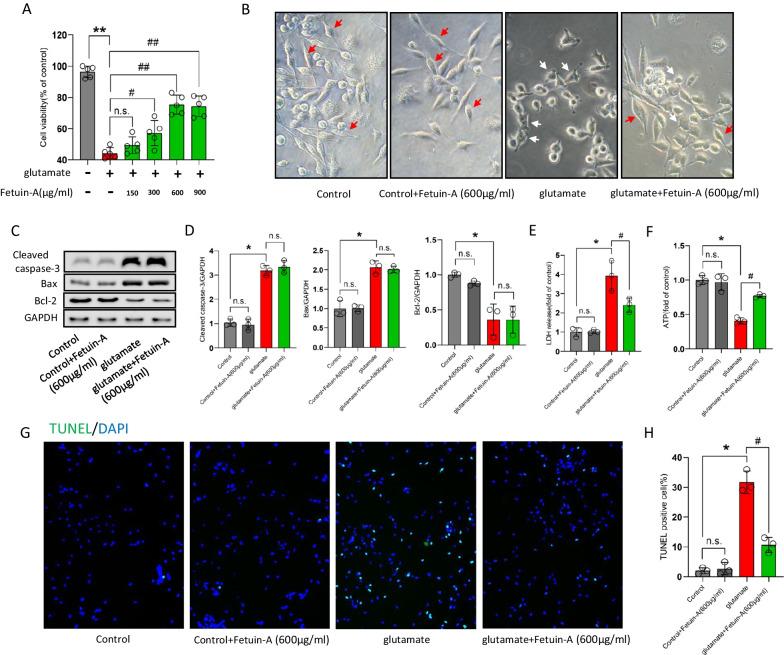
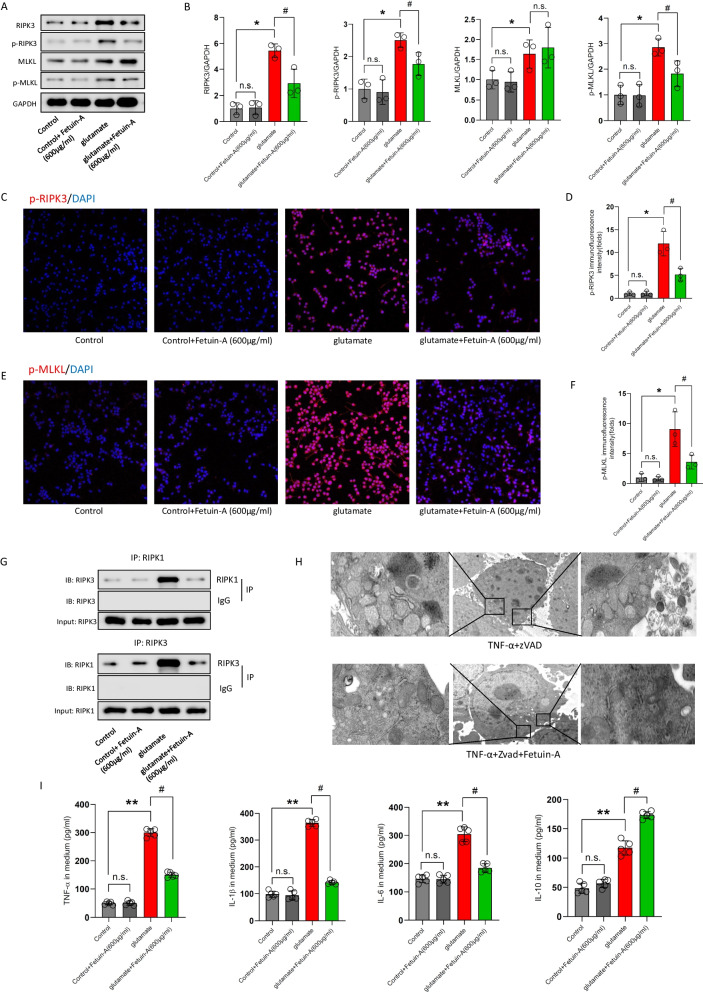
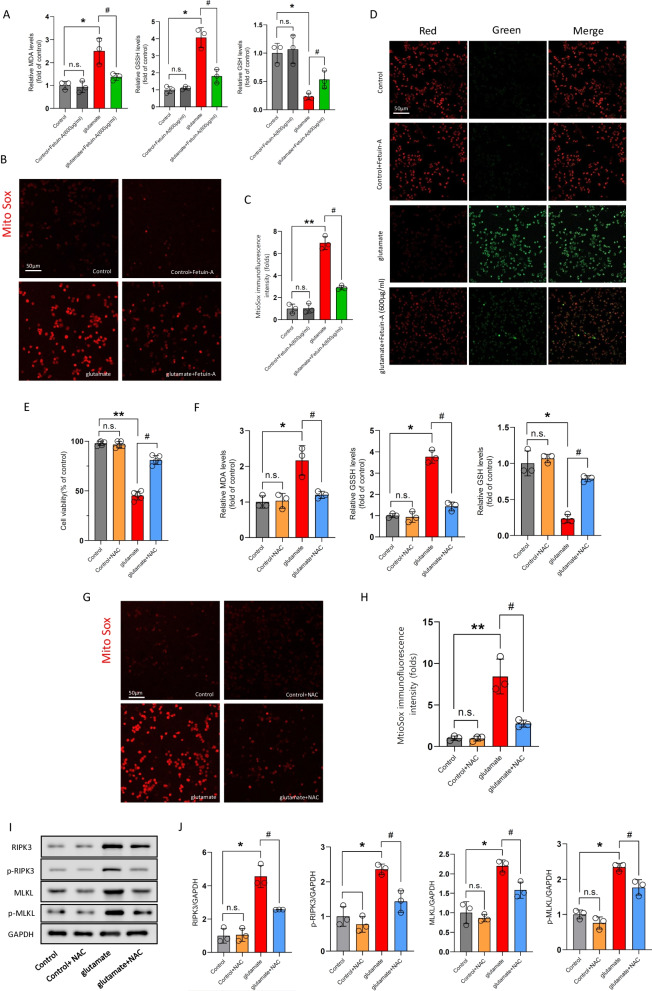
Methods: Controlled cortical impact (CCI) was induced in adult male C57BL/6J mice, and glutamate was used to construct a classical in vitro injury model in the primary microglia. Microglial activation was determined by western blot and immunostaining. The inflammatory factors were measured by enzyme-linked immunosorbent assay. The oxidative stress marker and mitochondrial reactive oxygen species (ROS) were measured by immunoblotting and MitoSox Red staining. Transmission electron microscopy was used to observe the typical morphology of necroptotic cells.

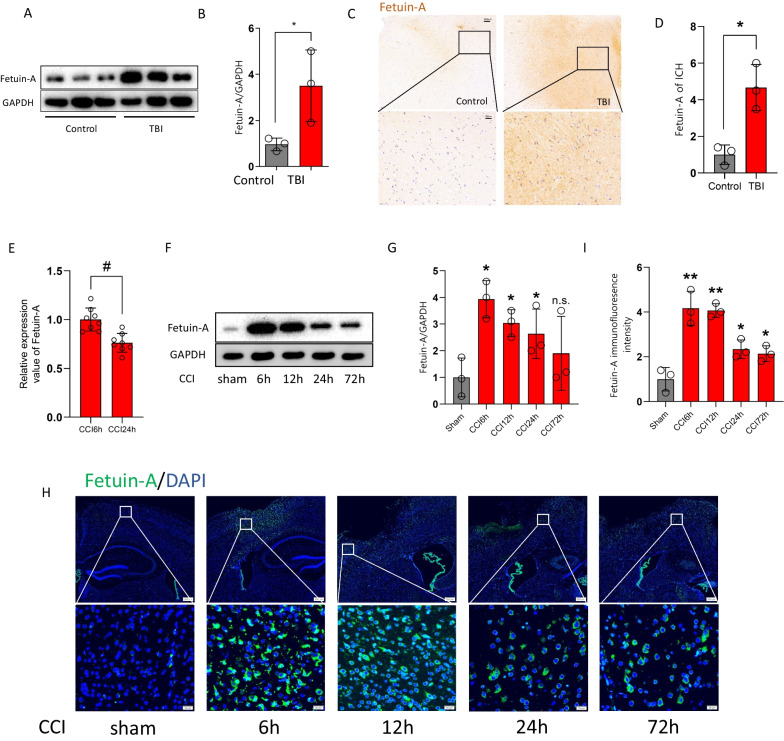
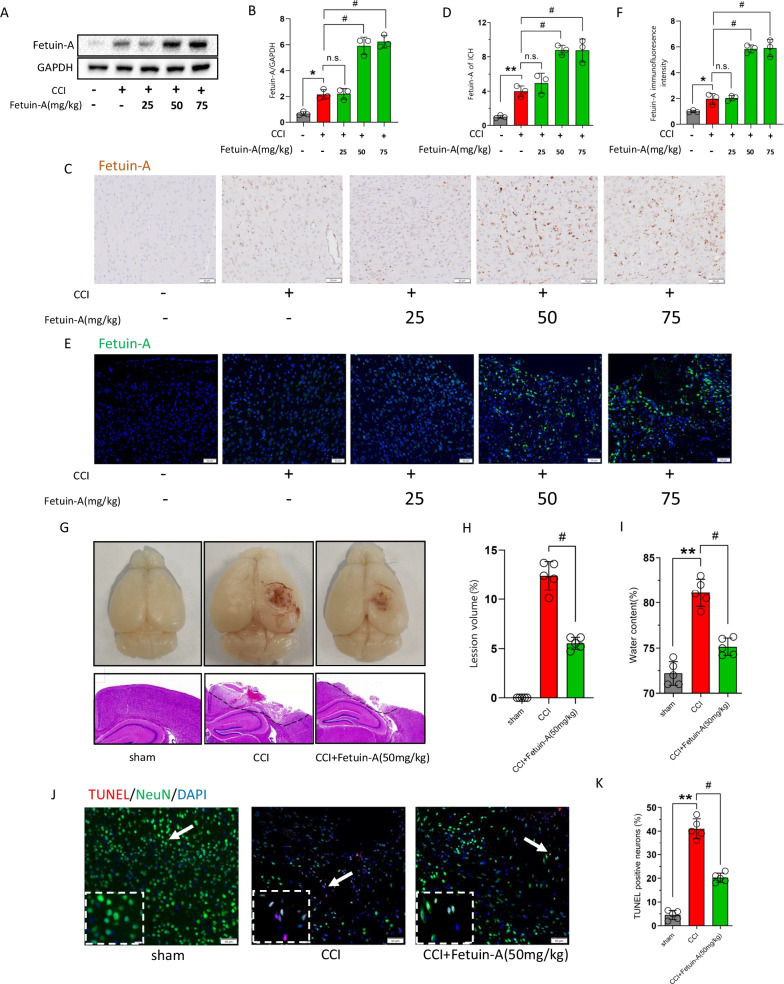
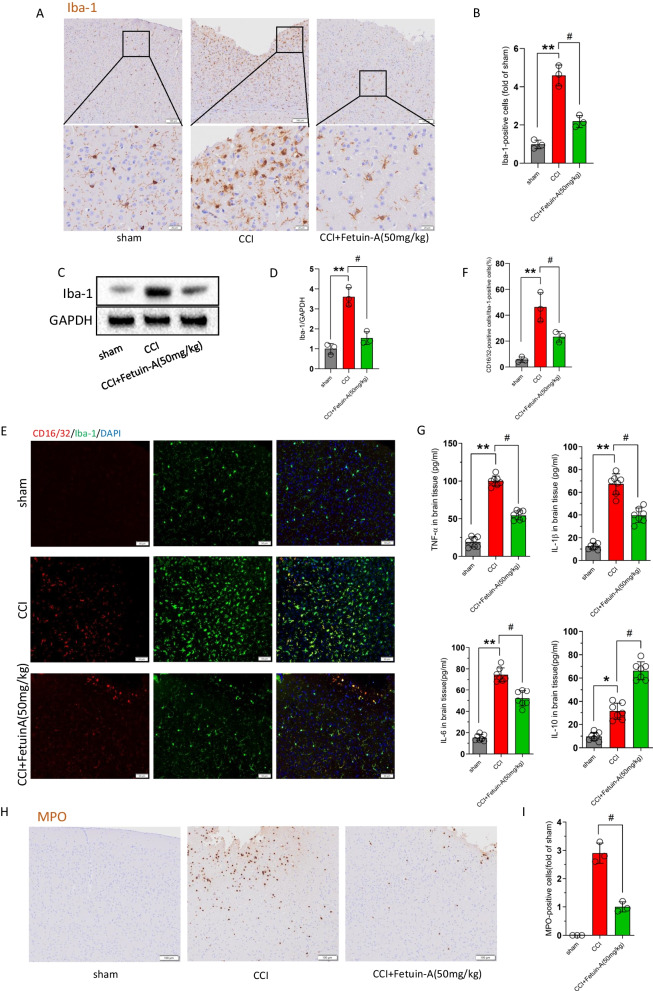
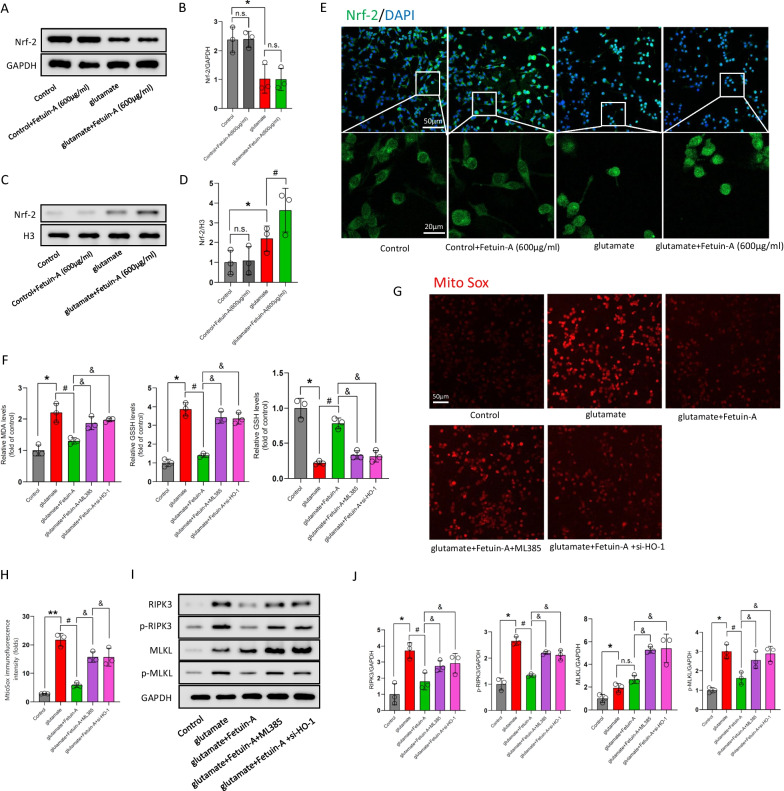
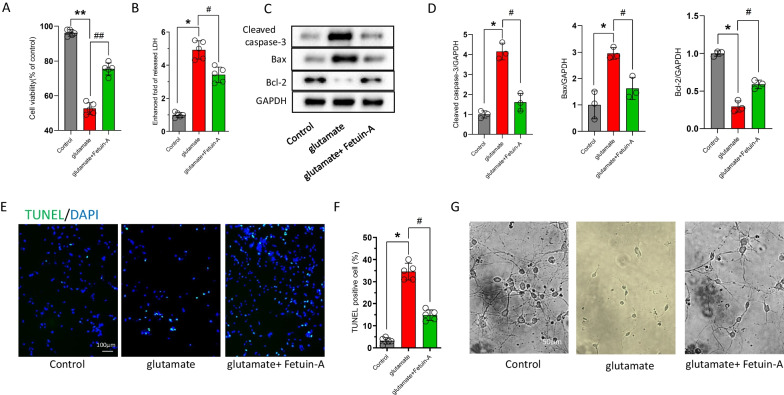
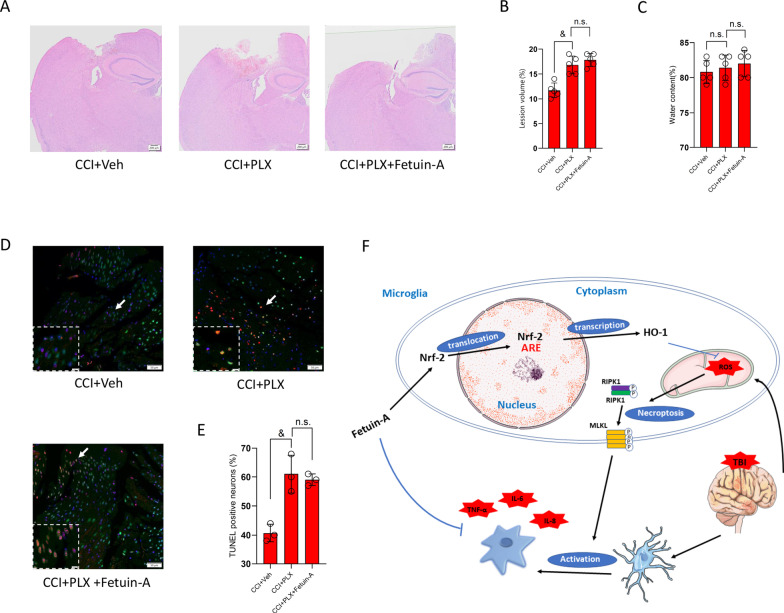
Results: Our quantitative proteomics identified 2499 proteins; 157 were significantly differentially expressed in brain tissue between the 6 h after CCI (CCI6h) group and sham group, and 109 were significantly differentially expressed between the CCI24h and sham groups. Moreover, compared with the sham group, the terms "acute-phase response", "inflammation", and "protein binding" were significantly enriched in CCI groups. Fetuin-A, a liver-secreted acute-phase glycoprotein, was involved in these biological processes. Using an experimental TBI model, we found that the Fetuin-A level peaked at 6 h and then decreased gradually. Importantly, we showed that administration of Fetuin-A reduced the cortical lesion volume and edema area and inhibited the inflammatory response, which was associated with suppressing microglial necroptosis, thus decreasing microglial activation. Furthermore, administration of Fetuin-A attenuated mitochondrial oxidative stress in glutamate-treated microglial cells, which is a critical mechanism of necroptosis suppression. In addition, we demonstrated that Fetuin-A treatment promoted translocation of nuclear factor erythroid 2-related factor 2 (Nrf-2) from the cytoplasm to the nucleus in vivo; however, the Nrf-2 inhibitor ML385 and si-heme oxygenase-1 (si-HO-1) disrupted the regulation of oxidative stress by Fetuin-A and induced increased ROS levels and necroptosis in glutamate-treated microglial cells. Fetuin-A also protected neurons from adverse factors in vivo and in vitro.

Conclusions: Our results demonstrated that Fetuin-A activated Nrf-2/HO-1, suppressed oxidative stress and necroptosis levels, and thereby attenuates the abnormal inflammatory response following TBI. The findings suggest a potential therapeutic strategy for TBI treatment.

Keywords: Fetuin-A; Microglia; Necroptosis; Neuroinflammation; Nrf-2/HO-1 pathway; Oxidative stress; Traumatic brain injury (TBI).


Conflict of interest statement

The authors declare that the research was conducted in the absence of any commercial or financial relationships that could be construed as a potential conflict of interest.

Figures

Fig. 1
Fig. 1
Protein identification and quantification by label-free LC–MS/MS. Quantitative proteomics analysis of the sham mice and TBI mice, and validation of differentially expressed Fetuin-A in different groups. And the animals in the sham group underwent all surgical procedures for TBI induction except the traumatic step. A Location of collected tissues was labeled. Collected cortical tissues were marked by gray frame. B Experimental design for proteomic analysis in the mice brain tissues by label-free LC–MS. C Volcano plot graph of 2499 nonredundant proteins. The − log10 (P-value) was plotted against the log2 (ratio TBI/Sham). The upregulated proteins in TBI tissues were marked with red dots (black arrow: Fetuin-A), and the downregulated proteins in TBI tissues with green dots. Blue plots represented the rest of genes with no significant expression change. D The relative protein level of Fetuin-A in CCI (n = 8 samples) vs. sham (n = 8 samples). E, F Classification of proteins identified through proteomics into their molecular biological processes (BP), cellular components (CC), and molecular functions (MF). The top 10 Gene Ontology (GO) enrichment analysis were listed. Data are presented as the means ± SD; **P < 0.01 vs. sham group
Fig. 2
Fig. 2
Fetuin-A is overexpressed after brain injury. A, B Western blot analysis and densitometric quantification of Fetuin-A expression by ImageJ in brain tissue of control (n = 3 samples) and TBI (n = 3 samples) patients. C, D Immunohistochemistry assessment of Fetuin-A expression in brain tissue from control and TBI patients. Scale bar is 20 or 100 μm. The relative intensity of Fetuin-A was detected with Image-J software. E The relative protein level of Fetuin-A in CCI6h vs. CCI24h (n = 8 samples) from quantitative proteomics analysis. F, G Protein levels of Fetuin-A obtained from sham mice and CCI mouse brain tissue. GAPDH is used as the loading control. And bar graphs show the results of analysis (by band density analysis) of Fetuin-A (sham = 3, CCI = 3). H, I Immunofluorescence assessment of Fetuin-A (green). Scale bar is 20 or 200 μm. The relative immunofluorescence intensity of Fetuin-A was detected with Image-J software. Data presented as mean ± SD (n = 5). *P < 0.05 vs. control group or sham group, **P < 0.01 vs. control group or sham group, and #P < 0.05 vs. CCI6h group
Fig. 3
Fig. 3
Peripheral administration of Fetuin-A exerted protective effects after CCI. The mice were treated with Fetuin-A at indicated concentrations after CCI. A, B Protein levels of Fetuin-A obtained from sham mice and CCI mice at 6 h. GAPDH was used as the loading control. And bar graphs show the results of analysis (by band density analysis) of Fetuin-A (sham = 3, CCI = 3). C, D Immunohistochemistry assessment of Fetuin-A in sham and CCI at 6 h (scale bar = 50 μm, n = 3). The relative intensity of Fetuin-A was detected with Image-J software. E, F Immunofluorescence assessment of Fetuin-A. Scale bar is 50 μm. The relative immunofluorescence intensity of Fetuin-A was detected with Image-J software (n = 3). G Representative photographs of whole brains and H&E staining of hemicerebrum sections (n = 3). H, I Lesion volume (n = 5) and water content% (n = 5) were analyzed by statistical. J, K Neuron death measured by TUNEL staining. Scale bar is 50 μm (n = 5). Data are presented as the means ± SD; *P < 0.05 vs. sham group, **P < 0.01 vs. sham group, and #P < 0.05 vs. CCI group
Fig. 4
Fig. 4
Fetuin-A treatment inhibits microglial activation and ameliorates inflammatory response after CCI. The mice were treated with Fetuin-A at indicated concentrations after TBI. A, B Immunohistochemistry assessment of Iba-1 in sham or CCI at 6 h and statistical analysis of Iba-1. Reduced process length, branch endpoint and swollen soma were observed in CCI-induced microglial cells (scale bar = 50 μm, n = 3). C, D Western blot analysis of Iba-1 expression from peri-contusional area. GAPDH was used as the loading control. And bar graphs show the results of analysis (by band density analysis) of these proteins (n = 3). E, F The co-localization of CD16/32 with Iba-1 by immunofluorescence assay with representative imaging and statistical analysis. Scale bar is 50 μm (n = 3). G IL-6, IL-1β, TNF-α, and IL-10 secretion was measured using ELISA (n = 7). H, I Immunofluorescence for MPO in the peri-contusional area and statistical analysis of MPO (scale bar is 100 μm, n = 3). Data are presented as the means ± SD; *P < 0.05 vs. sham group, **P < 0.01 vs. sham group, #P < 0.05 vs. CCI group
Fig. 5
Fig. 5
Fetuin-A failure to inhibit apoptosis in vitro. The microglial cells were treated with 100 μm glutamate (Glu) for 24 h to induce cellular injury. Meanwhile, Fetuin-A was treated into medium at indicated concentrations. A Cell viability was measured by Cell Counting Kit-8 assay (n = 5). B Representative photomicrographs of microglial cells in different groups (red arrows represent microglia in normal state and white arrows represent microglia in the activated state). Scale bar is 20 μm. C, D Expression of cleaved caspase-3, Bax, and Bcl-2 in microglial cells under various treatment conditions. GAPDH was used as the loading control. And bar graphs show the results of analysis (by band density analysis) of these proteins (n = 3). E LDH release assay (n = 3). F ATP production was measured by CellTiter-Glo ATP-based luminescence assays (n = 3). G, H Microglial death measured by TUNEL staining. Scale bar is 50 μm (n = 7). Data are presented as the means ± SD; *P < 0.05 vs. control, **P < 0.01 vs. control, #P < 0.05 vs. Glu group, ##P < 0.01 vs. Glu group and n.s.: no significant difference
Fig. 6
Fig. 6
The anti-inflammatory effect of Fetuin-A is by inhibiting necroptosis in glutamate-exposed microglial cells. The microglial cells were treated with 100 μm glutamate (Glu) for 24 h to induce cellular injury. Meanwhile, Fetuin-A was treated into medium at indicated concentrations. A, B Expression of RIPK3, MLKL, p-RIPK3 and p-MLKL in microglial cells under various treatment conditions. GAPDH was used as the loading control. And bar graphs show the results of analysis (by band density analysis) of these proteins (n = 3). CF Immunofluorescence assessment of p-RIPK3 and p-MLKL expression. Scale bar is 50 μm. The relative immunofluorescence intensity of Fetuin-A was detected with Image-J software (n = 3). G RIPK1 was immunoprecipitated with its antibody and resulted in co-immunoprecipitation of RIPK3. Immunoprecipitation of RIPK3 with its antibody caused co-immunoprecipitation of RIPK1 in microglial cells (n = 3). H Transmission electron microscopy (TEM) images of tissues. Translucent cytoplasm, mitochondrial swelling and destruction of membrane integrity were observed in TNF-α + zVAD-treated microglial cells (scale bar = 5 or 1 μm, n = 3). I IL-6, IL-1β, TNF-α, and IL-10 secretion was measured using ELISA (n = 5). Data are presented as the means ± SD; *P < 0.05 vs. control, **P < 0.01 vs. control, #P < 0.05 vs. Glu group, and n.s.: no significant difference
Fig. 7
Fig. 7
Inhibition of oxidative stress is a key pathway for Fetuin-A to repress necroptosis. The microglial cells were treated with 100 μm glutamate (Glu) for 24 ho to induce cellular injury. A, F The oxidative stress of microglial cells were analyzed by detecting the levels of MDA, GSSG, and GSH (n = 3). B, C, G, H Mitochondrial superoxide was detected by immunofluorescence using MitoSox Red staining. Scale bar is 50 μm. The relative immunofluorescence intensity of Fetuin-A was detected with Image-J software (n = 3). D Mitochondrial membrane potential was detected by the JC-1 fluorescence ratio. Scale bar is 50 μm (n = 5). E Cell viability was measured by Cell Counting Kit-8 assay (n = 5). I, J Expression of RIPK3, MLKL, p-RIPK3 and p-MLKL in microglial cells under various treatment conditions. GAPDH was used as the loading control. And bar graphs show the results of analysis (by band density analysis) of these proteins (n = 3). Data are presented as the means ± SD; *P < 0.05 vs. control, **P < 0.01 vs. control, #P < 0.05 vs. Glu group, and n.s.: no significant difference
Fig. 8
Fig. 8
Nrf-2/HO-1 pathway is involved in the protection mechanism of Fetuin-A in glutamate-treated microglial cells. AD Western blot analysis of Nrf-2 expression in cytosolic or nuclear. GAPDH and Histone H3 were used as the loading control. And bar graphs show the results of analysis (by band density analysis) of these proteins (n = 3). E The intracellular localization of Nrf-2 was visualized by confocal microscopy. Scale bar is 20 or 50 μm (n = 5). F Oxidative stress of microglial cells were analyzed by detecting the levels of MDA, GSSG, and GSH (n = 3). G, H Mitochondrial superoxide was detected by immunofluorescence using MitoSox Red staining. Scale bar is 50 μm. The relative immunofluorescence intensity of Fetuin-A was detected with Image-J software (n = 3). I, J Detection of RIPK3, MLKL, p-RIPK3 and p-MLKL was done by immunoblot analysis (n = 3). Data are presented as the means ± SD; *P < 0.05 vs. control, **P < 0.01 vs. control, #P < 0.05 vs. Glu group, &P < 0.05 vs Glu + Fetuin-A group, and n.s.: no significant difference
Fig. 9
Fig. 9
Fetuin-A suppressed neuronal damage in vitro. The primary cortical neurons were cultured in neurobasal medium with 2% B27 and 0.5 mM glutamate. Then, the neurons were treated with the microglia-conditioned medium. A Cell viability was measured by Cell Counting Kit-8 assay (n = 5). B LDH release assay (n = 5). C, D Western blot analysis of the apoptosis-related proteins expression. GAPDH was used as the loading control. And bar graphs show the results of analysis (by band density analysis) of these proteins (n = 3). E, F Cell death measured by TUNEL staining of primary neurons. Scale bar is 100 μm (n = 5). G Representative images of neurons growth 1 week after different treatments. Scale bar is 50 μm (n = 5). Data are presented as the means ± SD; *P < 0.05 vs. control, **P < 0.01 vs. control, #P < 0.05 vs. Glu group
Fig. 10
Fig. 10
PLX5622-mediated microglia depletion attenuates the effect of Fetuin-A in TBI mice. A H&E staining of hemispheres sections (n = 3). B, C Lesion volume (n = 5) and water content% (n = 5) were analyzed by statistical. D, E Neuron death measured by TUNEL staining. Scale bar is 50 μm (n = 3). F A schematic diagram showing the neuroprotective and anti-inflammation effects of Fetuin-A. Data are presented as the means ± SD; &P < 0.05 vs. CCI + Veh group, and n.s.: no significant difference

References

    1. Ghajar J. Traumatic brain injury. Lancet. 2000;356:923–929. - PubMed
    1. Ji J, Kline AE, Amoscato A, Samhan-Arias AK, Sparvero LJ, Tyurin VA, Tyurina YY, Fink B, Manole MD, Puccio AM, et al. Lipidomics identifies cardiolipin oxidation as a mitochondrial target for redox therapy of brain injury. Nat Neurosci. 2012;15:1407–1413. - PMC - PubMed
    1. Shafi S, Barnes SA, Millar D, Sobrino J, Kudyakov R, Berryman C, Rayan N, Dubiel R, Coimbra R, Magnotti LJ, et al. Suboptimal compliance with evidence-based guidelines in patients with traumatic brain injuries. J Neurosurg. 2014;120:773–777. - PubMed
    1. Hutchinson PJ, Kolias AG, Timofeev IS, Corteen EA, Czosnyka M, Timothy J, Anderson I, Bulters DO, Belli A, Eynon CA, et al. Trial of decompressive craniectomy for traumatic intracranial hypertension. N Engl J Med. 2016;375:1119–1130. - PubMed
    1. Chao H, Anthonymuthu TS, Kenny EM, Amoscato AA, Cole LK, Hatch GM, Ji J, Kagan VE, Bayir H. Disentangling oxidation/hydrolysis reactions of brain mitochondrial cardiolipins in pathogenesis of traumatic injury. JCI Insight. 2018;3:e97677. - PMC - PubMed