. 2022 Nov 3;39(11):msac242.
doi: 10.1093/molbev/msac242.

The Dynamics of Adaptation to Stress from Standing Genetic Variation and de novo Mutations

Affiliations

The Dynamics of Adaptation to Stress from Standing Genetic Variation and de novo Mutations

Sandra Lorena Ament-Velásquez et al. Mol Biol Evol. .

Abstract

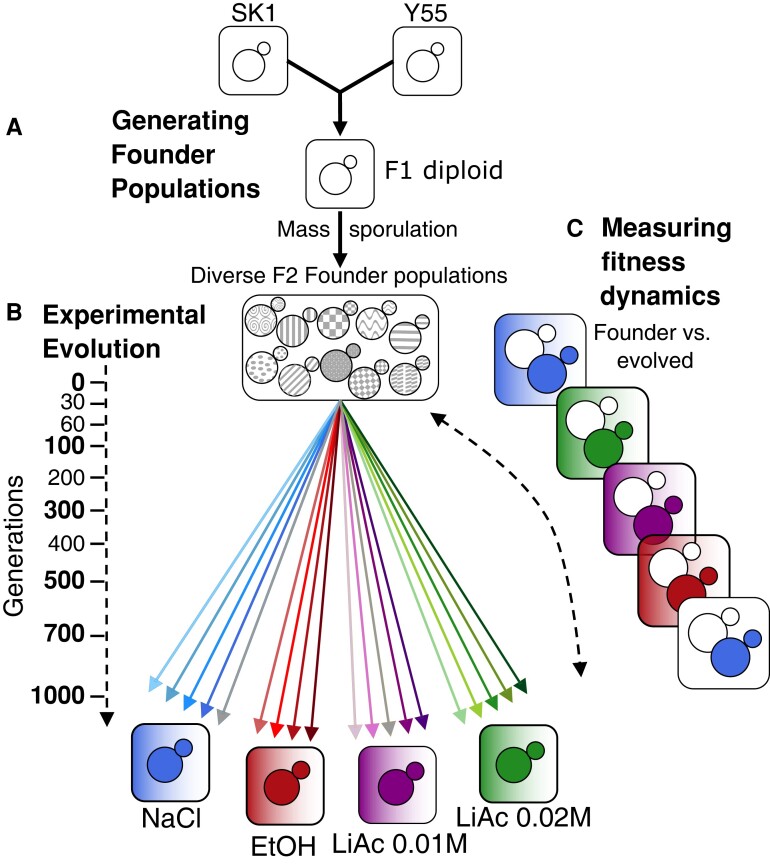
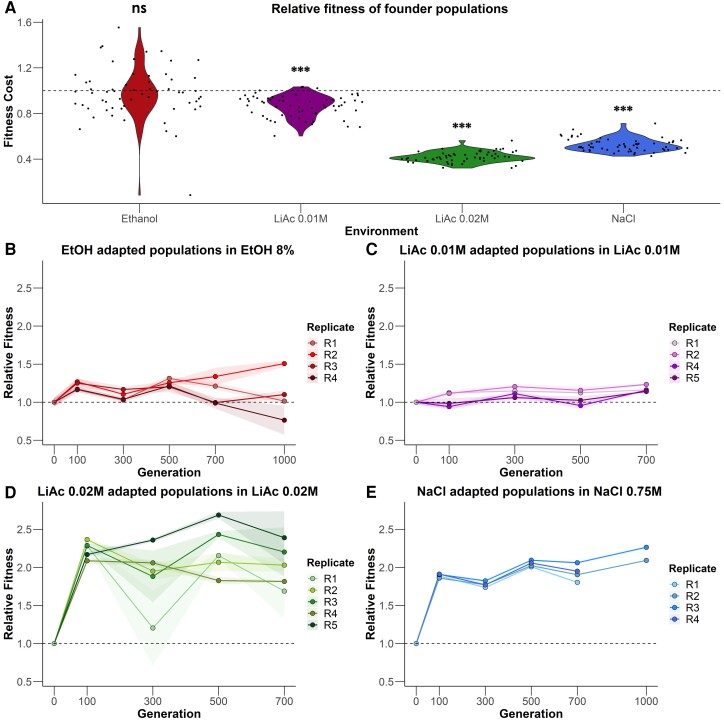
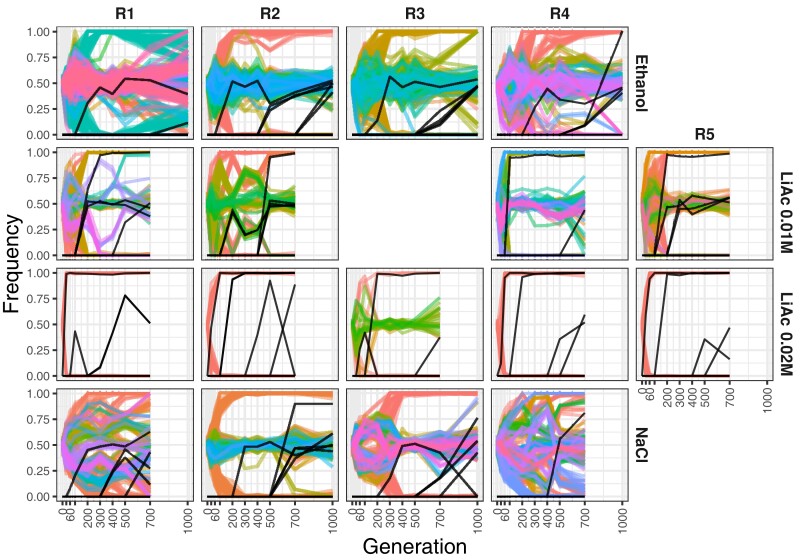
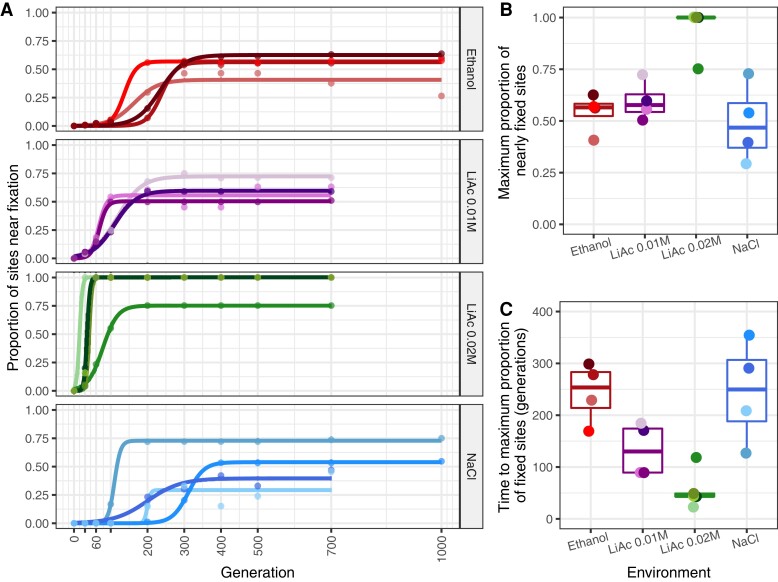
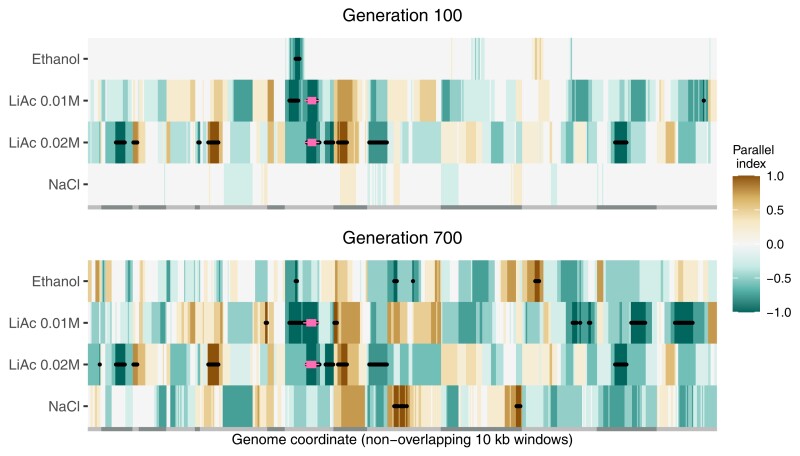
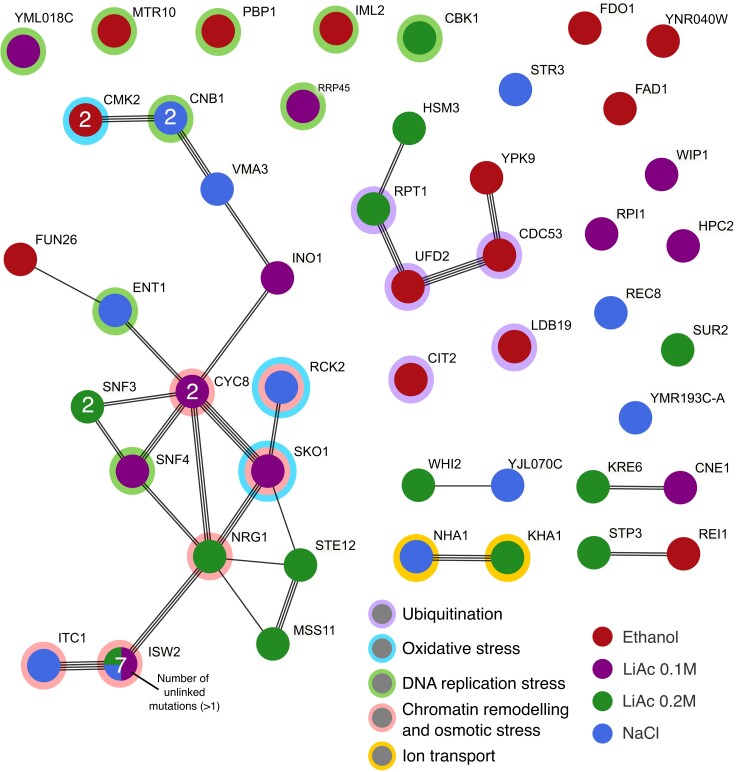
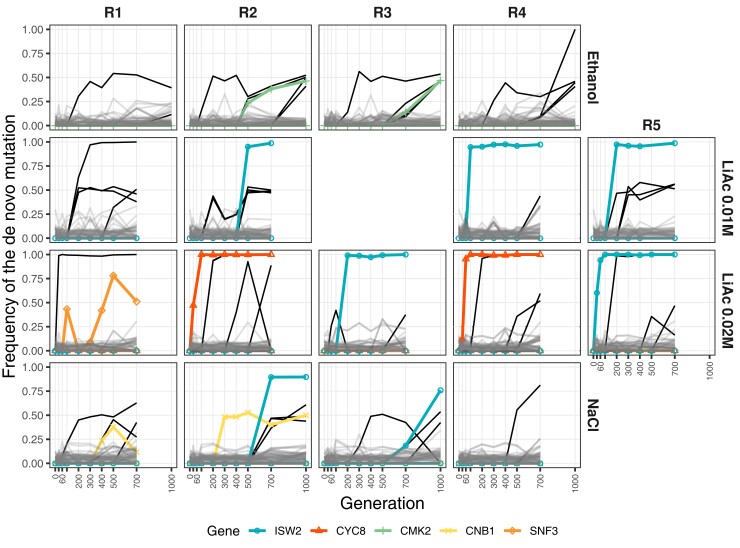
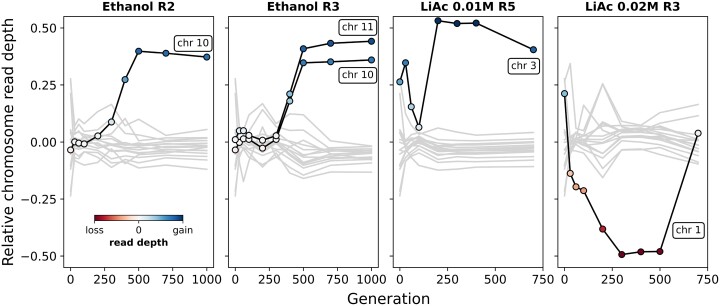
Adaptation from standing genetic variation is an important process underlying evolution in natural populations, but we rarely get the opportunity to observe the dynamics of fitness and genomic changes in real time. Here, we used experimental evolution and Pool-Seq to track the phenotypic and genomic changes of genetically diverse asexual populations of the yeast Saccharomyces cerevisiae in four environments with different fitness costs. We found that populations rapidly and in parallel increased in fitness in stressful environments. In contrast, allele frequencies showed a range of trajectories, with some populations fixing all their ancestral variation in <30 generations and others maintaining diversity across hundreds of generations. We detected parallelism at the genomic level (involving genes, pathways, and aneuploidies) within and between environments, with idiosyncratic changes recurring in the environments with higher stress. In particular, we observed a tendency of becoming haploid-like in one environment, whereas the populations of another environment showed low overall parallelism driven by standing genetic variation despite high selective pressure. This work highlights the interplay between standing genetic variation and the influx of de novo mutations in populations adapting to a range of selective pressures with different underlying trait architectures, advancing our understanding of the constraints and drivers of adaptation.

Keywords: Pool-Seq; adaptation dynamics; environmental stress; microbial experimental evolution; parallelism; time series; yeast.


Figures

<sc>Fig</sc>. 1.
Fig. 1.
Experimental design. (A) Diverse founder populations were generated by mass sporulation of a cross between strains Y55 and SK1. (B) Asexual yeast populations were evolved for 1,000 generations in four environments: NaCl 0.75 M, EtOH 8%, LiAc 0.01 M, and LiAc 0.02 M. Shaded squares indicate selective media; white squares are the ancestral medium (SC). Replicate populations are indicated as separate arrows. Sampling time points for sequencing are indicated on the dotted arrow. One population of NaCl and LiAc 0.01 M, as well as the generation 1,000 of both LiAc treatments and of two populations of NaCl, were lost due to contamination. (C) Fitness assays using OD600 after 24 h of growth were used to compare founders and evolved populations at six time points of evolution in selective and ancestral environments. Only a subset of all pairwise comparisons is shown. Assays were carried out at six time points (marked in bold on the left).
<sc>Fig</sc>. 2.
Fig. 2.
Fitness dynamics. (A) Founder population fitness (OD600 after 24 h of growth) in selective environments compared with growth in ancestral conditions (SC medium). Values of 1 (dashed horizontal line) indicate no change compared with ancestral conditions. Values below 1 indicate lower fitness in selective media, that is a fitness cost. Each black point represents a single measurement. (BE) Mean relative fitness of replicate populations in the four selective environments. Shaded areas represent the 95% confidence intervals for each replicate population. One EtOH population went extinct in the first 100 generations. Type II ANOVA and Tukey HSD tests; n = 118 for NaCl, 236 for other environments, ***P < 0.001; ns = not significant.
<sc>Fig</sc>. 3.
Fig. 3.
Frequency trajectories of variation during evolution. Haplotype clusters of standing genetic variation (in color) and high-frequency de novo mutations (black) across environments (rows) and replicates (columns). The allele frequency of the haplotype clusters is based on the SK1 allele. Note that a given haplotype might include multiple chromosomes.
<sc>Fig</sc>. 4.
Fig. 4.
Differences in the proportion of nearly fixed sites (MAF ≤ 0.1) across environments. (A) The raw proportion of nearly fixed sites through time (points) were fitted to a sigmoidal model for each replicate, (B) each with their respective maximum proportion of nearly fixed sites, and (C) the time at which each replicate reaches this maximum. There are significant differences between environments with respect to the maximum proportion of nearly fixed sites (Kruskal–Wallis H3 = 10.549, P = 0.014, n = 17) and time to the maximum proportion of nearly fixed sites (Kruskal–Wallis H3 = 11.325, P = 0.010, n = 17), but pairwise Wilcoxon tests were not significant after Bonferroni correction.
<sc>Fig</sc>. 5.
Fig. 5.
Heatmaps of genetic parallelism along the genome in the different environments. The genome was divided into non-overlapping 10 kb windows with at least four SNPs and the median allele frequencies were used to calculate a parallelism index. The index is a scaled count of how many replicates are fixed (MAF ≤ 0.1) for the SK1 parental allele (+1) or the Y55 parental allele (−1). Chromosome limits are defined by alternating light and dark gray bars at the bottom of the heatmaps. Black points mark windows where either parental allele was fixed in four or more replicates (LiAc 0.02 M has five replicates, all other environments had four). Pink crosses mark windows that were completely fixed in all the LiAc replicates (both LiAc 0.01 M and LiAc 0.02 M).
<sc>Fig</sc>. 6.
Fig. 6.
Protein–protein interaction network of all genes affected by de novo mutations that reached a frequency of at least 35% at some point during the experiment. Each node is a pie chart of the proportion of mutations per gene that occurred in each environment (all present in a single environment, except for ISW2). The number of unlinked independent mutations is indicated within each node if a gene was hit by more than one mutation (two mutations in the genes SUR2 and SNF3 have linked allele frequency trajectories and were counted as one). The links represent different sources of interaction evidence detected by the STRING database. Main functional categories are depicted by rings around the nodes.
<sc>Fig</sc>. 7.
Fig. 7.
Genes with parallel independent de novo mutations. Of the de novo mutations that reached a frequency >35% at some time point (black lines), some hit the same gene independently (in colors). Mutations that stayed below 35% frequency are presented in gray.
<sc>Fig</sc>. 8.
Fig. 8.
Chromosome copy number changes. A subset of chromosome copy number changes in four replicate populations. Lines show the relative read depth of each chromosome (read depth vs. the mean read depth across all chromosomes). Lines in black indicate chromosomes with potential aneuploidies. The points within indicate a gain (blue) or loss (red) of chromosome, with the shade indicating the magnitude of relative read depth change.

References

    1. Andrews S. 2010. FASTQC. A quality control tool for high throughput sequence data. https://www.bioinformatics.babraham.ac.uk/projects/fastqc/
    1. Auguie B. 2017. gridExtra: Miscellaneous Functions for “Grid” Graphics.
    1. Bailey SF, Blanquart F, Bataillon T, Kassen R. 2017. What drives parallel evolution?: how population size and mutational variation contribute to repeated evolution. BioEssays 39(1):e201600176. - PubMed
    1. Bailey SF, Rodrigue N, Kassen R. 2015. The effect of selection environment on the probability of parallel evolution. Mol Biol Evol. 32(6):1436–1448. - PubMed
    1. Barghi N, Hermisson J, Schlötterer C. 2020. Polygenic adaptation: a unifying framework to understand positive selection. Nat Rev Genet. 21(12):769–781. - PubMed

Publication types