The anterior nucleus of the thalamus plays a role in the epileptic network
- PMID: 36334281
- PMCID: PMC9735375
- DOI: 10.1002/acn3.51693
The anterior nucleus of the thalamus plays a role in the epileptic network
Abstract
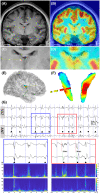
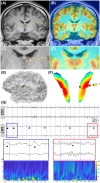
Objectives: We investigated both the metabolic differences and interictal/ictal discharges of the anterior nucleus of the thalamus (ANT) in patients with epilepsy to clarify the relationship between the ANT and the epileptic network.
Methods: Nineteen patients with drug-resistant epilepsy who underwent stereoelectroencephalography were studied. Metabolic differences in ANT were analyzed using [18F] fluorodeoxyglucose-positron emission tomography with three-dimensional (3D) visual and quantitative analyses. Interictal and ictal discharges in the ANT were analyzed using visual and time-frequency analyses. The relationship between interictal discharge and metabolic differences was analyzed.
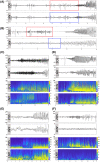
Results: We found that patients with temporal lobe epilepsy (TLE) showed significant metabolic differences in bilateral ANT compared with extratemporal lobe epilepsy in 3D visual and quantitative analyses. Four types of interictal activities were recorded from the ANT: spike, high-frequency oscillation (HFO), slow-wave, and α-rhythmic activity. Spike and HFO waveforms were recorded mainly in patients with TLE. Two spike patterns were recorded: synchronous and independent. In 83.3% of patients, ANT was involved during seizures. Three seizure onset types of ANT were recorded: low-voltage fast activity, rhythmic spikes, and theta band discharge. The time interval of seizure onset between the seizure onset zone and ANT showed two patterns: immediate and delayed.
Interpretation: ANT can receive either interictal discharges or ictal discharges which propagate from the epileptogenic zones. Independent epileptic discharges can also be recorded from the ANT in some patients. Metabolic anomalies and epileptic discharges in the ANT indicate that the ANT plays a role in the epileptic network in most patients with epilepsy, especially TLE.
© 2022 The Authors. Annals of Clinical and Translational Neurology published by Wiley Periodicals LLC on behalf of American Neurological Association.
Conflict of interest statement
The authors declared no conflict of interest.
Figures


Similar articles
-
Factors affecting interictal unilateral and bilateral discharges and ictal diffusion patterns of scalp electroencephalogram in temporal lobe epilepsy.Neurol Sci. 2022 Jan;43(1):507-515. doi: 10.1007/s10072-021-05293-0. Epub 2021 May 4. Neurol Sci. 2022. PMID: 33942172
-
Spectral organization of focal seizures within the thalamotemporal network.Ann Clin Transl Neurol. 2019 Sep;6(9):1836-1848. doi: 10.1002/acn3.50880. Epub 2019 Aug 30. Ann Clin Transl Neurol. 2019. PMID: 31468745 Free PMC article.
-
It's All About the Networks.Epilepsy Curr. 2019 May-Jun;19(3):165-167. doi: 10.1177/1535759719843301. Epub 2019 Apr 29. Epilepsy Curr. 2019. PMID: 31032667 Free PMC article.
-
Interictal-ictal interactions and limbic seizure generation.Rev Neurol (Paris). 1999 Jul;155(6-7):468-71. Rev Neurol (Paris). 1999. PMID: 10472661 Review.
-
Evolution of interictal activity in models of mesial temporal lobe epilepsy.Neurobiol Dis. 2023 May;180:106065. doi: 10.1016/j.nbd.2023.106065. Epub 2023 Mar 11. Neurobiol Dis. 2023. PMID: 36907521 Review.
Cited by
-
Deep brain stimulation for patients with refractory epilepsy: nuclei selection and surgical outcome.Front Neurol. 2023 May 12;14:1169105. doi: 10.3389/fneur.2023.1169105. eCollection 2023. Front Neurol. 2023. PMID: 37251216 Free PMC article.
-
Thalamic spindles and Up states coordinate cortical and hippocampal co-ripples in humans.PLoS Biol. 2024 Nov 19;22(11):e3002855. doi: 10.1371/journal.pbio.3002855. eCollection 2024 Nov. PLoS Biol. 2024. PMID: 39561183 Free PMC article.
-
The comparison of DBS and RNS for adult drug-resistant epilepsy: a systematic review and meta-analysis.Front Hum Neurosci. 2024 Jun 19;18:1429223. doi: 10.3389/fnhum.2024.1429223. eCollection 2024. Front Hum Neurosci. 2024. PMID: 38962148 Free PMC article.
-
Inter-seizure variability in thalamic recruitment and its implications for precision thalamic neuromodulation.Commun Med (Lond). 2025 May 22;5(1):190. doi: 10.1038/s43856-025-00920-9. Commun Med (Lond). 2025. PMID: 40404918 Free PMC article.
References
-
- Theodore WH, Fisher RS. Brain stimulation for epilepsy. Lancet Neurol. 2004;3(2):111‐118. - PubMed
-
- Fisher RS, Velasco AL. Electrical brain stimulation for epilepsy. Nat Rev Neurol. 2014;10(5):261‐270. - PubMed
-
- He X, Doucet GE, Pustina D, Sperling MR, Sharan AD, Tracy JI. Presurgical thalamic "hubness" predicts surgical outcome in temporal lobe epilepsy. Neurology. 2017;88(24):2285‐2293. - PubMed
MeSH terms
Grants and funding
LinkOut - more resources
Full Text Sources
Medical
