. 2022 Dec:58:102524.
doi: 10.1016/j.redox.2022.102524. Epub 2022 Oct 28.

Nanoparticle endothelial delivery of PGC-1α attenuates hypoxia-induced pulmonary hypertension by attenuating EndoMT-caused vascular wall remodeling

Affiliations

Nanoparticle endothelial delivery of PGC-1α attenuates hypoxia-induced pulmonary hypertension by attenuating EndoMT-caused vascular wall remodeling

Dunpeng Cai et al. Redox Biol. 2022 Dec.

Abstract

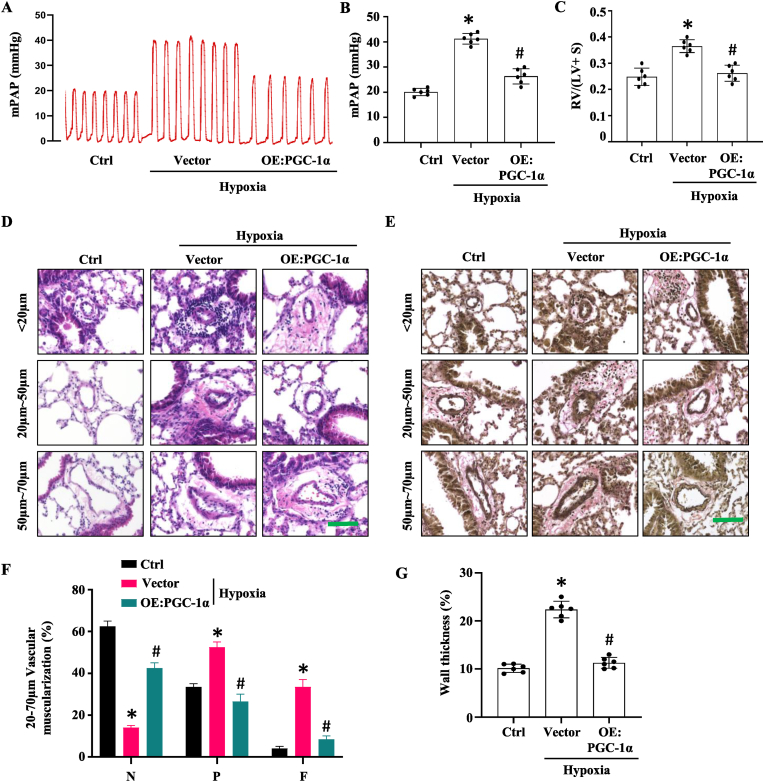
Pulmonary hypertension (PH) induced by chronic hypoxia is characterized by thickening of pulmonary artery walls, elevated pulmonary vascular resistance, and right-heart failure. Dysfunction of endothelial cells is the hallmark event in the progression of PH. Among various mechanisms, endothelial to mesenchymal transition (EndoMT) has emerged as an important source of endothelial cell dysfunction in PH. However, the mechanisms underlying the EndoMT in PH remain largely unknown. Our results showed that peroxisome proliferator-activated receptor gamma coactivator 1-alpha (PGC-1α) expression was decreased in pulmonary arterial endothelial cells (PAECs) in PH patients and hypoxia-induced PH mouse model compared to the normal controls. Endothelial-specific overexpression of PGC-1α using nanoparticle delivery significantly attenuated the progression of PH, as shown by the significantly decreased right ventricular systolic pressure and diminished artery thickness as well as reduced vascular muscularization. Moreover, Endothelial-specific overexpression of PGC-1α blocked the EndoMT of PAECs during PH, indicating that loss of PGC-1α promotes PH development by mediating EndoMT, which damages the integrity of endothelium. Intriguingly, we found that PGC-1α overexpression rescued the expression of endothelial nitric oxide synthase in mouse lung tissues that was deceased by hypoxia treatment in vivo and in endothelial cells treated with TGF-β in vitro. Consistently, PAECs and vascular smooth muscle co-culture showed that overexpression of PGC-1α in PAECs increases nitric oxide release, which would likely diffuse to smooth muscle cells, where it activates specific protein kinases, and initiates SMC relaxation by diminishing the calcium flux. Endothelial-specific overexpression of PGC-1α also attenuated hypoxia-induced pulmonary artery stiffness which appeared to be caused by both the decreased endothelial nitric oxide production and increased vascular remodeling. Taken together, these results demonstrated that endothelial-specific delivery of PGC-1α prevents PH development by inhibiting EndoMT of PAECs and thus restoring endothelial function and reducing vascular remodeling.

Keywords: Endothelial to mesenchymal transition; Nitric oxide; Peroxisome proliferator-activated receptor gamma coactivator-1α; Pulmonary hypertension.


Conflict of interest statement

Declaration of competing interest None.

Figures

Image 1
Graphical abstract
Fig. 1
Fig. 1
PGC-1α expression was decreased in pulmonary artery endothelial cells in hypoxia-induced PAH mouse model. Wild-type (WT) mice were exposed to normoxia (n = 6) or hypoxia (10% O2, n = 6) for 4 weeks. A, Representative images of immunohistochemistry staining of PGC-1α in pulmonary arteries. Scale Bar: 100 μm. B–C, PGC-1α protein expression in the lung tissues, as detected by Western blot (B) and quantified by normalizing to GAPDH level. *p < 0.01 compared with the Control (Ctrl) group. D, PGC-1α expression in endothelial cells of normoxia (Ctrl) and hypoxia-treated lungs. Co-immunostaining of CD31 (red) with PGC-1α (green) was performed in mouse pulmonary arteries. Scale Bar: 100 μm. E, The percentage of PGC-1α + CD31+ cells relative to the total CD31+ cells as quantified from 10 sections of each artery. *p < 0.01 compared to the Ctrl group, n = 6. (For interpretation of the references to colour in this figure legend, the reader is referred to the Web version of this article.)
Fig. 2
Fig. 2
PGC-1α overexpression in pulmonary artery endothelial cells via nanoparticle delivery in hypoxia-induced PAH mice. Nanoparticles containing empty vector or PGC-1α overexpression plasmid (OE: PGC-1α) was injected to mice via tail vein. After 7 days, mice were exposed to normoxia or hypoxia (10% O2) for 4 weeks. A, Immunohistochemistry (IHC) staining for PGC-1α (upper panel) and co-immunostaining of PGC-1α with CD31 (lower panels) of lung tissues. PGC-1α was downregulated in PAECs after hypoxia treatment. However, nanoparticle delivery of PGC-1α plasmid restored the PGC-1α expression. Scale bar: 100 μm. B, Relative PGC-1α levels in IHC staining as shown in A, as quantified by normalizing to the PGC-1α signal intensity in the normoxia group (Ctrl), which was set as 1. *P < 0.01 vs. Ctrl; #P < 0.01 vs. Vector group; n = 6. C, The percentage of PGC-1α+CD31+ cells relative to the total CD31+ cells, as quantified from 10 sections of each animals. D-E, Flow cytometry analyses. Lung tissues were digested, and PAECs were isolated by CD31 magnetic beads. Flow cytometry was performed to quantify PGC-1α+ PACEs (D), and the percentage of PGC-1α+ CD31+ cells relative to the total CD31+ cells was shown (E). *P < 0.01 vs. Ctrl; #P < 0.01 vs. Vector group; n = 6.
Fig. 3
Fig. 3
Overexpression of PGC-1α in pulmonary artery endothelial cells ameliorated hypoxia-induced PAH and vascular remodeling in lungs. Nanoparticles containing control vector or PGC1-a overexpression plasmid (OE:PGC-1α) was injected to mice via tail vein. Mice were exposed to normoxia or hypoxia (10% O2) for 4 weeks. A-B, Assessment of mean pulmonary aorta pressure (mPAP). *P < 0.01 vs. Ctrl; #P < 0.01 vs. Vector group; n = 6. C, Ratio of right ventricle to left ventricle + septum weight [RV/(LV + S)]. *P < 0.01 vs. Ctrl; #P < 0.01 vs. Vector group; n = 6. D-E, H &E (D) and elastic van Gieson staining (E) of the pulmonary arteries. Artery wall thickening of pulmonary arteries with different diameters are shown. Scale Bar: 100 μm. F, Quantification of pulmonary arterial muscularization in arteries with diameters 20–70 μm. N = non-muscularized vessels; P = partially muscularized vessels. F = fully muscularized vessels. *P < 0.01 vs. Ctrl; #P < 0.01 vs. the vector group for each vessel type, respectively; n = 6. G, Quantitative assessment of the wall thickness of the pulmonary arteries as described in Methods. *P < 0.01 vs. Ctrl; #P < 0.01 vs. Vector group; n = 6.
Fig. 4
Fig. 4
PGC-1α overexpression attenuated hypoxia-induced endothelial-mesenchymal transition in vivo. Nanoparticles containing control vector (WT) or PGC-1α expression plasmid (OE:PGC1-a) were injected to mice via tail vein. Mice were exposed to normoxia (Ctrl) or hypoxia (10% O2) for 4 weeks. A, PGC-1α, mesenchymal markers N-Cadherin and vimentin, and endothelial cell markers VE-Cadherin and CD31 protein expression levels in the lung tissues, as detected by Western blotting. B–F, Quantification of PGC-1α (B), N-Cadherin (C), vimentin (D), VE-Cadherin (E) and CD31 (F) protein levels by normalizing to GAPDH, respectively. Shown are fold changes relative to the normoxia group. *P < 0.01 vs. Ctrl; #P < 0.01 vs. Vector group for each individual proteins, respectively; n = 6. G, Co-immunostaining of vWF with α-SMA or Vimentin in lung tissues. vWF co-localized with α-SMA and Vimentin in PAECs after hypoxia treatment (white arrowheads), which was diminished by nanoparticle delivery of PGC-1α. Scale bar: 40 μm. H–I, The percentage of vWF+ α-SMA + cells (H) and vWF + Vimentin + cells (I) relative to the total vWF + cells, as quantified from 10 sections of each lung arteries. *P < 0.01 vs. Ctrl; #P < 0.01 vs. Vector-treated group, n = 6.
Fig. 5
Fig. 5
Overexpression of PGC-1α reduced pulmonary artery stiffness. Nanoparticles containing empty vector and PGC-1α expression plasmid (OE:PGC1-a) were injected to mice via tail vein. Mice were exposed to normoxia (Ctrl) or hypoxia (10% O2) for 4 weeks. A, The pulse-wave Doppler recordings. The pulse wave velocity (PWV) was increased in hypoxia-treated mouse pulmonary arteries, which was attenuated by endothelial overexpression of PGC-1α. B, PWVs were shown as millimeter/millisecond. *P < 0.01 vs. Ctrl; #P < 0.01 vs. Vector group; n = 5. C, Picrosirius red staining of pulmonary arteries with various diameters as indicated. Scale Bar: 100 μm D, Artery distensibility measurement. The pulmonary arteries from the left lobe of 7-8-week old male mice were isolated, and third order branches (<200 μm) were selected for pressure myography. The diameter alterations under the indicated pressures were recorded. *P < 0.01 vs. Ctrl; #P < 0.01 vs. Vector group with each individual pressure; n = 6. (For interpretation of the references to colour in this figure legend, the reader is referred to the Web version of this article.)
Fig. 6
Fig. 6
Overexpression of PGC-1α attenuated TGF-β-induced EndoMT and disruption of endothelial monolayer integrity. Human pulmonary artery endothelial cells (PAECs) were transfected with empty vector (Ctrl) or PGC-1α expression plasmid and then treated with vehicle or TGF-β (5 ng/ml) for 3 days. A-B, PGC-1α, N-Cadherin, Vimentin, VE-Cadherin, CD31 protein expression, as detected by Western blotting (A) and quantified by normalizing to GAPDH (B), respectively. *P < 0.05 vs. vehicle-treated cells; #P < 0.01 vs. Ctrl vector-transfected cells with TGF-β for each individual proteins; n = 3. C,Trans-Endothelial Electrical Resistance (TEER) measurement. TEER was measured continuously in PAECs with or without TGF-β treatment. After baseline TEER was achieved, TGF-β were added. 3 days later, the resistance was measured at 4000 Hz in 20 min intervals and normalized to the baseline level. *P < 0.05 vs. vehicle-treated cells; #P < 0.05 vs. Ctrl vector-transfected cells with TGF-β; n = 3. D, PAEC permeability assay. PAECs were plated on Transwell inserts and cultured until confluence. Vehicle or PBS along with fluorescein isothiocyanate (FITC)-dextran was added to the bottom chamber and incubated for 3 days. FITC-dextran leaked to the upper chamber was quantified by measuring the green fluorescent signals in a fluorescence plate reader. *P < 0.05 vs. vehicle-treated cells; #P < 0.05 vs. Ctrl vector-transfected cells with TGF-β; n = 3. E, In vivo permeability assay. Nanoparticles containing control vector (Ctrl) or PGC-1α expression vector (PGC-1α) were injected to mice via tail vein. Mice were exposed to normoxia or hypoxia (10% O2) for 4 weeks, and were then injected i.v. with FITC-BSA. 3 h later, animals were sacrificed and perfused with 4% paraformaldehyde (PFA). PAEC permeability was assessed by imaging the green fluorescent signals from leaked FITC-BSA with a fluorescence microscope (E) and quantified by normalizing to the fluorescent signals in normoxia-treated group, which was set as 1 (F). Scale Bar: 100 μm *P < 0.01 vs. Ctrl; #P < 0.01 vs. Vector group; n = 6. (For interpretation of the references to colour in this figure legend, the reader is referred to the Web version of this article.)
Fig. 7
Fig. 7
Overexpression of PGC-1α improved PAEC function and inhibits calcium release in smooth muscle cells (SMCs). Nanoparticles containing control vector or PGC1-α expression plasmid (OE:PGC1-α) were injected to mice via tail vein. Mice were exposed to normoxia (Ctrl) or hypoxia (10% O2) for 4 weeks. A-B, Endothelial nitric oxide synthase (eNOS) expression in lung tissues, as detected by Western blotting (A) and normalized to GAPDH. *P < 0.01 vs. Ctrl; #P < 0.01 vs. Vector group; n = 6. C-D, eNOS protein expression. Human PAECs were transfected with empty vector (Ctrl) or PGC-1α expression plasmid and then treated with vehicle or TGF-β (5 ng/ml) for 3 days. eNOS expression was detected by Western blotting (C) and normalized to GAPDH (D). *P < 0.05 vs. vehicle-treated cells; #P < 0.01 vs. Ctrl vector-transfected cells with TGF-β; n = 6. E, Nitric oxide (NO) release assay. PAECs were treated with nanoparticles containing empty Vector (Ctrl) or PGC-1α expression plasmid (PGC-1α). One day later, cells were treated with vehicle or TGF-β for 20 min. NO generated by PAECs was measured using a Nitric Oxide Assay Kit (Abcam, ab65327). The relative NO levels were quantified by normalizing to the vehicle-treated cells, which was set as 1. *P < 0.01 vs. vehicle-treated cells; #P < 0.01 vs. Ctrl vector nanoparticle-treated cells with TGF-β; n = 6. F-G, Calcium flux assay. PAECs were transfected with empty vector (Ctrl) or PGC-1α expression plasmid and cocultured with SMCs in a transwell plate. PACEs in the upper chamber were treated with vehicle (Ctrl) or TGF-β (5 ng/ml) for 3 days. Then SMCs in the lower chamber were incubated with Fluo-4 AM at 37 °C and room temperature each for 45 min. Calcium flux signal (green) was detected with a Nikon fluorescence microscope using FITC channel (F) and normalized to control (G). *P < 0.05 vs. vehicle-treated cells; #P < 0.01 vs. Ctrl vector-transfected cells with TGF-β; n = 6. (For interpretation of the references to colour in this figure legend, the reader is referred to the Web version of this article.)
Fig. 8
Fig. 8
PGC-1α was decreased in pulmonary artery endothelial cells of patients with idiopathic pulmonary arterial hypertension (IPAH). A, Representative images of immunohistochemistry staining of PGC-1α in pulmonary arteries. Scale Bar: 200 μm. B–C, PGC-1α protein expression in healthy and IPAH lungs, as detected by Western blotting (B) and quantified by normalizing to GAPDH level (C). *P < 0.01 vs. Healthy lungs, n = 6. D, PGC-1α expression in human pulmonary artery endothelium, as detected by co-immunostaining of PGC-1α (green) with CD31 (red) in lung tissues. Scale Bar: 100 μm. E, The percentages of PGC-1α+ CD31+ cells relative to the total CD31+ cells, which was quantified from 10 sections of each patients. *P < 0.01 vs. Healthy lungs, n = 6. (For interpretation of the references to colour in this figure legend, the reader is referred to the Web version of this article.)

References

    1. Chang K.Y., Duval S., Badesch D.B., Bull T.M., Chakinala M.M., De Marco T., Frantz R.P., Hemnes A., Mathai S.C., Rosenzweig E.B., Ryan J.J., Thenappan T., * P.I. Mortality in pulmonary arterial hypertension in the modern era: early insights from the pulmonary hypertension association registry. J. Am. Heart Assoc. 2022;11 - PMC - PubMed
    1. Farber H.W., Loscalzo J. Pulmonary arterial hypertension. N. Engl. J. Med. 2004;351:1655–1665. - PubMed
    1. Tuder R.M., Stacher E., Robinson J., Kumar R., Graham B.B. Pathology of pulmonary hypertension. Clin. Chest Med. 2013;34:639–650. - PubMed
    1. Dorfmuller P. Pulmonary hypertension: pathology. Handb. Exp. Pharmacol. 2013;218:59–75. - PubMed
    1. Tuchscherer H.A., Webster E.B., Chesler N.C. Pulmonary vascular resistance and impedance in isolated mouse lungs: effects of pulmonary emboli. Ann. Biomed. Eng. 2006;34:660–668. - PubMed

Publication types

MeSH terms

Substances

LinkOut - more resources