. 2022 Nov 23;185(24):4654-4673.e28.
doi: 10.1016/j.cell.2022.10.003. Epub 2022 Nov 4.

Architecture of the outbred brown fat proteome defines regulators of metabolic physiology

Affiliations

Architecture of the outbred brown fat proteome defines regulators of metabolic physiology

Haopeng Xiao et al. Cell. .

Abstract

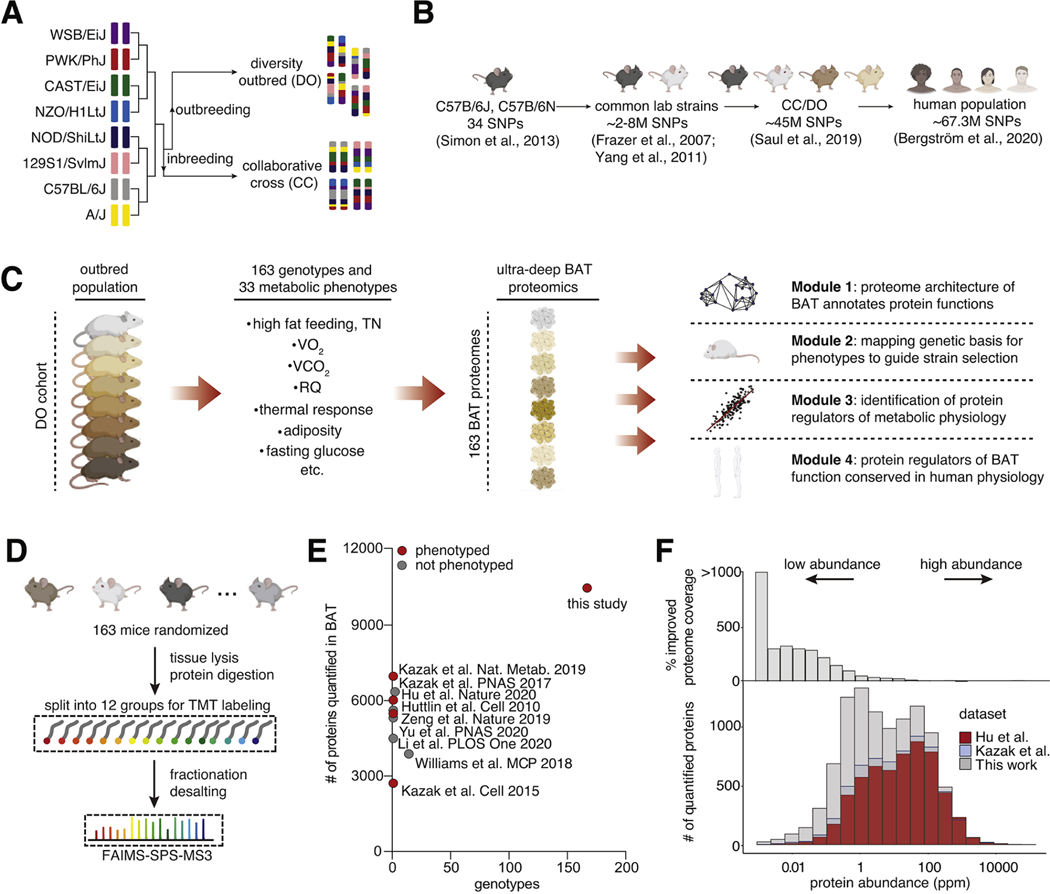
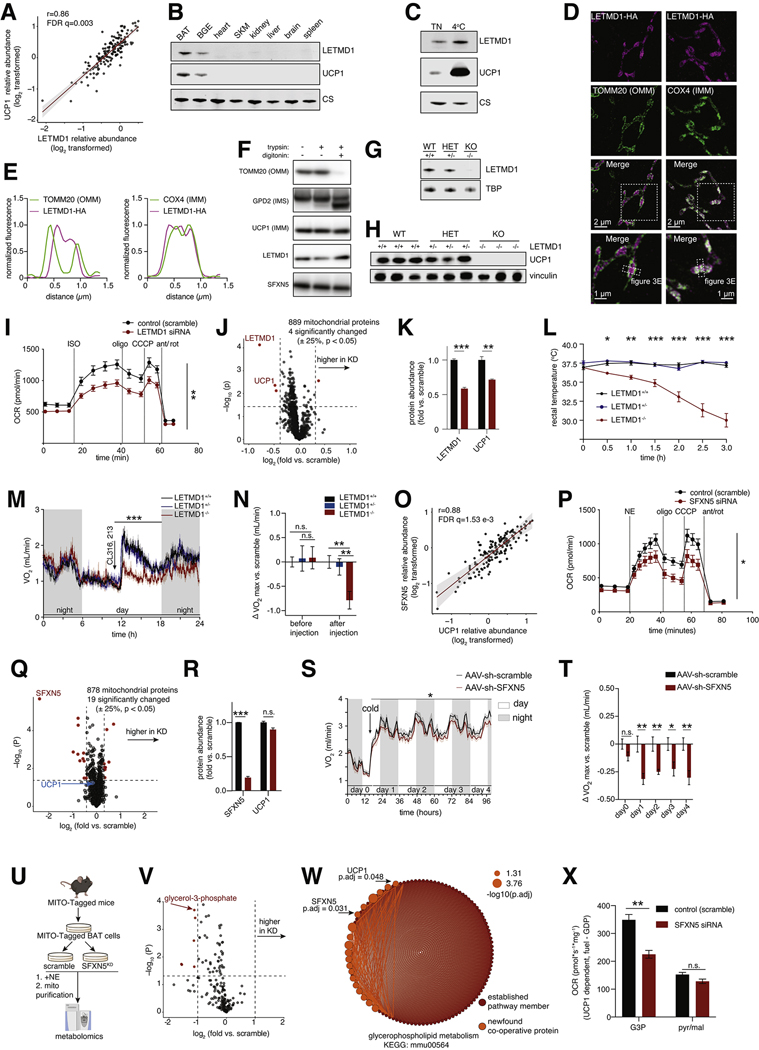
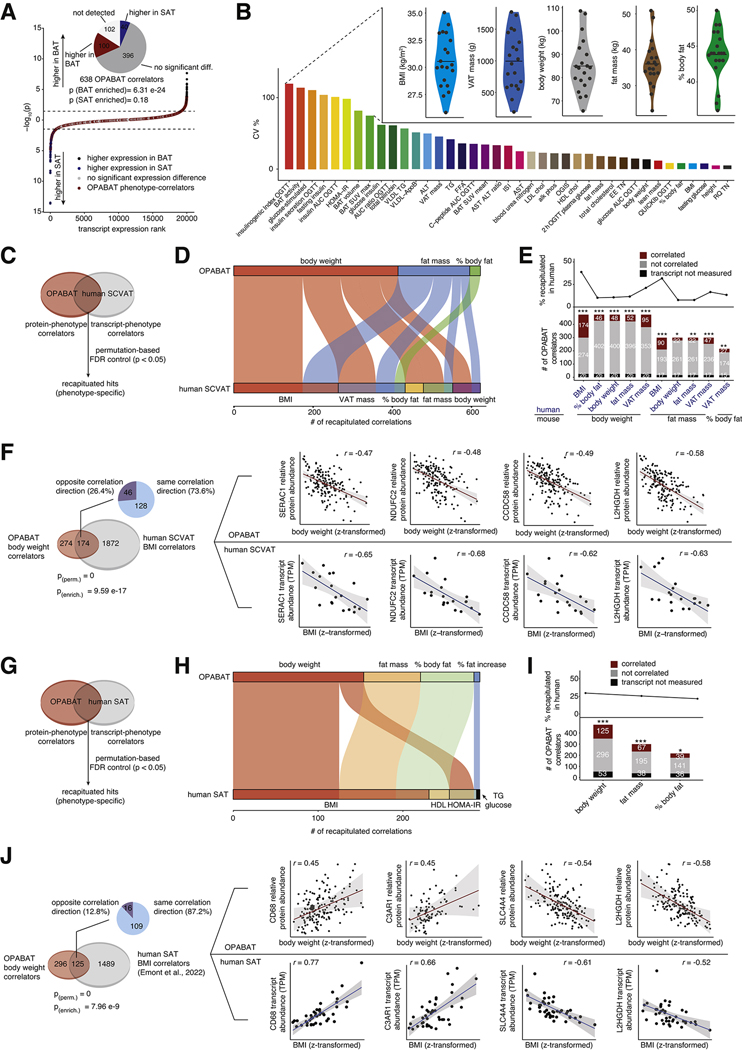
Brown adipose tissue (BAT) regulates metabolic physiology. However, nearly all mechanistic studies of BAT protein function occur in a single inbred mouse strain, which has limited the understanding of generalizable mechanisms of BAT regulation over physiology. Here, we perform deep quantitative proteomics of BAT across a cohort of 163 genetically defined diversity outbred mice, a model that parallels the genetic and phenotypic variation found in humans. We leverage this diversity to define the functional architecture of the outbred BAT proteome, comprising 10,479 proteins. We assign co-operative functions to 2,578 proteins, enabling systematic discovery of regulators of BAT. We also identify 638 proteins that correlate with protection from, or sensitivity to, at least one parameter of metabolic disease. We use these findings to uncover SFXN5, LETMD1, and ATP1A2 as modulators of BAT thermogenesis or adiposity, and provide OPABAT as a resource for understanding the conserved mechanisms of BAT regulation over metabolic physiology.


Conflict of interest statement

Declaration of interests F.E.M. and N.V.B. and are currently employees of Calico Life Sciences, LLC. T.B. is currently an employee of Roche Diagnostics. E.T.C. is a founder, equity holder, and consultant for Matchpoint Therapeutics and Aevum Therapeutics. B.M.S. is a founder, equity holder, and consultant for Aevum Therapeutics.

Figures

Figure 1:
Figure 1:. Measuring genotypes, phenotypes, and proteomes in the DO cohort
(A) Overview of the breeding scheme for the collaborative cross (CC) and diversity outbred (DO) strains. (B) Comparison of single nucleotide polymorphisms (SNPs) across various populations. (C) Experimental design of OPABAT. (D) TMT-based BAT protein quantification. (E) Genotype and proteome coverage of OPABAT compared to other studies. (F) OPABAT quantifies more low-abundance proteins than previous reports.
Figure 2:
Figure 2:. Co-variation analysis identifies co-operative proteins
(A) OPABAT co-expression network. (B) Co-operative edges in OPABAT explained by literature evidence. (C) Highly recapitulated CORUM complexes in OPABAT. Red nodes-recapitulated network members; gray nodes-missing network members (D) OPABAT edges recapitulated the TCA cycle. (E) Determining co-operative proteins of known protein complexes or pathways. Red nodes-known members of established networks; blue nodes-neighboring proteins; orange node-the protein to test co-operativity; gray nodes-all other proteins in OPABAT. (F) CORUM core complexes and co-operative proteins. (G) Exemplary co-operative proteins of established complexes. Red edges-interactions between complex subunits; orange edges-interactions involving co-operative proteins. (H) Co-operative proteins of established regulators of thermogenesis. (I) Co-operative partners of UCP1. Red edges- co-operative proteins with evidence in the literature; gray edges- no evidence in the literature; table-top 10 co-operative proteins of UCP1.
Figure 3:
Figure 3:. OPABAT identifies LETMD1 and SFXN5 as regulators of UCP1-dependent BAT thermogenesis
(A) LETMD1expression highly correlated with UCP1. (B) LETMD1 and UCP1 shared similar mitochondrial expression profiles in tissues. BGE- beige fat; SKM- skeletal muscle. (C) Cold-inducible LETMD1 and UCP1 expression in BAT. (D) Structured illumination microscopy (SIM) of LETMD1-HA (purple) with mitochondria outer membrane (OMM) marker TOMM20 (green) and inner outer membrane (IMM) COX4 (green). 60 X magnification. (E) LETMD1-HA fluorescence signal co-localized with COX4 but not TOM20. (F) Trypsin digestion assay of UCP1, LETMD1, and SFXN5 along with TOMM22 (OMM) and GPD2 (intermembrane space, IMS). (G) BAT LETMD1 expression in wildtype (WT, LETMD+/+), heterozygous (HET, LETMD+/−), and full knockout (KO, LETMD−/−) C57BL/6J mice. (H) BAT UCP1 expression in LETMD1 WT, HET, and KO mice. n = 3. (I) LETMD1 knockdown (KD) attenuated cellular respiration in differentiated brown adipocytes. OCR-oxygen consumption rate; ISO-isoproterenol; oligo-oligomycin; CCCP-carbonyl cyanide 3-chlorophenylhydrazone; ant/rot-antimycin/rotenone. n = 10. (J)-(K) LETMD1 KD specifically decreased UCP1 abundance. n=3. (L) LETMD−/− mice could not maintain body temperature when exposed to cold (4 oC). WT, n = 3; HET, n = 4; KO, n = 5. (M)-(N) LETMD−/− mice had blunted response in respiration to CL316, 213 injection. Baseline measured at thermoneutrality. WT, n = 8; HET, n = 6; KO, n = 5. (O) SFXN5-UCP1 abundance correlation. (P) SFXN5 KD attenuated cellular respiration in differentiated brown adipocytes. OCR-oxygen consumption rate; NE-norepinephrine; oligo-oligomycin; CCCP-carbonyl cyanide 3-chlorophenylhydrazone; ant/rot-antimycin/rotenone. n = 10. (Q)-(R) SFXN5 KD did not change UCP1 abundance. n=3. (S)-(T) SFXN5KD mice have blunted response in respiration to cold exposure. Baseline-room temperature. n=6. (U)-(V) MITO-Tag-based metabolomics identified G3P depletion in the mitochondria of SFXN5KD cells with NE treatment. WT, n=4; KD, n=6. (W) SFXN5 and UCP1 are newfound co-operative proteins of the KEGG glycerophospholipid metabolism pathway in OPABAT. Red nodes and edges- established pathway; orange nodes and edges- new co-operative proteins/edges. (X) UCP1-dependent respiration in WT and SFXN5KD mature brown adipocyte mitochondria using different fuel source, calculated by OCR of G3P (or pyruvate/malate) - OCR of GDP. n=3. Data presented as mean ± S.E.M. * p < 0.05, ** p< 0.01, *** p<0.001. (I), (L), (M), (P), and (S), two-way ANOVA test. (J), (K), (N), (Q), (R), (T), (V), and (X), two-tailed Student’s t test. (W), Fisher’s exact test.
Figure 4:
Figure 4:. Genetic basis for phenotypic variation
(A) Variability of metabolic parameters in the DO cohort. (B) Workflow of QTL mapping and mouse strain selection. (C) Phenotype QTLs with LOD score > 6 (the presence of a QTL is 106 times more probable than its absence). (D) Manhattan plot of the VO2 cold/day QTL. (E) Founder strain allelic contribution to VO2 cold/day (QTL- chromosome 17, 87.49Mbp). (F) Founder and CC strain selection for low (blue) or high (red) VO2 cold/day. (G) Manhattan plot of the % body fat QTL. (H) Founder strain allelic contribution to % body fat (QTL- chromosome 11, 63.08 Mbp). (I) Founder and CC strain selection for low (blue) or high (red) % body fat. (J) Manhattan plot of the UCP1 pQTL. (K) Founder strain allelic contribution to UCP1 protein abundance. (QTL- chromosome 11, 89.47 Mbp). P value obtained from permutation test with 10,000 iterations. (L) Founder and CC strain selection for low (blue) or high (red) UCP1 protein expression.
Figure 5:
Figure 5:. BAT protein determinants of whole-body metabolic physiology
(A) Number of significant positive and negative protein correlators of each parameter. (B) Jaccard similarity of protein correlators between metabolic parameters. (C)-(G) OPABAT protein correlators of adiposity parameters. (H) Correlation between LEP abundance and % body fat. (I) Correlation between NPR3 abundance and % body fat. (J) Correlation between ATP1A2 abundance and % body fat increase. (K) Correlation between UCP1 abundance and fat mass. (L) Correlation between all metabolic phenotypes and top protein correlators/major established BAT regulators of thermogenesis.
Figure 6:
Figure 6:. ATP1A2 inhibits BAT energy expenditure
(A) A model of ATP1A2 as a negative regulator of BAT energy expenditure. (B) Generation of ATP1A2 overexpression (ATP1A2OE) and ATP1A2 knockdown (ATP1A2KD) brown adipocytes with adenovirus or siRNA. n = 3. (C) Averaged Fluo-4 intensity trace (normalized to intensity at 0 min) of control and ATP1A2OE differentiated brown adipocytes. Intensity plotted as the relative change to baseline-F/F0. n = 209 cells. (D) Averaged Fluo-4 intensity trace (normalized to intensity at 0 min) of control and ATP1A2KD differentiated brown adipocytes. Intensity plotted as the relative change to baseline-F/F0. n = 209 cells. (E) Downregulation of PKA substrate phosphorylation in ATP1A2OE differentiated brown adipocytes compared to GFP control measured by phosphoproteomics. n = 4. (F) ATP1A2 OE attenuated lipolysis in differentiated brown adipocytes. n = 4. (G) ATP1A2 OE attenuated cellular respiration in differentiated brown adipocytes. OCR-Oxygen consumption rate; NE-norepinephrine; oligo-oligomycin; DNP- 2,4-Dinitrophenol; ant/rot-antimycin/rotenone. n = 4. (H) Body composition analysis of control and BAT-specific ATP1A2OE mice under HFD and TN. (I) qPCR analysis of ATP1A2 OE in BAT, SAT, and epididymal fat (epi) 2 weeks post injection. n=8. (J) % body fat of ATP1A2KD and control cohorts at the initiation of HFD. n = 7. (K) ATP1A2OE and control cohorts % body fat increase post HFD. n = 7. (L) ATP1A2OE and control cohorts food consumption under HFD. n = 7. (M) ATP1A2OE and control cohorts lean mass under HFD. n = 7. (N) ATP1A2OE and control cohorts epi mass post HFD. n = 7. (O) qPCR analysis of ATP1A2 KD in BAT, SAT, and epi. n=4. (P) BAT mass of ATP1A2KD and control cohorts post HFD. n = 15. (Q) BAT tissue appearance post HFD. (R) BAT histology with H&E staining. The ATP1A2KD BAT exhibited presence of many small lipid droplets and less whitening. n=3. Data presented as mean ± S.E.M. * p < 0.05, ** p< 0.01, *** p<0.001. (B), (E- fold change), (I), (J), (K), (M), (N), (O), (P), two-tailed Student’s t test; (E-association), Fisher’s exact test; (C), (D), (F), (G), (L), two-way ANOVA test.
Figure 7:
Figure 7:. Human relevance of OPABAT metabolic physiology correlators
(A) OPABAT correlators are enriched among transcripts with higher BAT expression than SAT in human. n=10. (B) Variability of metabolic parameters in a cohort of 20 female patients. (C) Comparing OPABAT protein-phenotype correlators to human SCVAT transcript-phenotype correlators. (D) Recapitulated correlators of adiposity between OPABAT and human SCVAT. (E) Number and percentage of adiposity correlators recapitulated in human SCVAT. (F) OPABAT correlators of body weight recapitulated as human SCVAT correlators of BMI. (G) Comparing OPABAT protein-phenotype correlators to human SAT transcript-phenotype correlators. (H) Recapitulated correlators of adiposity between OPABAT and human SAT. (I) Number and percentage of adiposity correlators recapitulated in human SAT. (J) OPABAT correlators of body weight recapitulated as human SAT correlators of BMI. * p < 0.05, ** p< 0.01, *** p<0.001. (E), (F), (I), and (J) permutation test. (A), (F and J-enrichment), Fisher’s exact test.

References

    1. Allan C, Burel JM, Moore J, Blackburn C, Linkert M, Loynton S, Macdonald D, Moore WJ, Neves C, Patterson A, et al. (2012). OMERO: flexible, model-driven data management for experimental biology. Nat Methods 9, 245–253. - PMC - PubMed
    1. Antonicka H, Lin ZY, Janer A, Aaltonen MJ, Weraarpachai W, Gingras AC, and Shoubridge EA (2020). A High-Density Human Mitochondrial Proximity Interaction Network. Cell Metab 32, 479–497 e479. - PubMed
    1. Aran D, Looney AP, Liu L, Wu E, Fong V, Hsu A, Chak S, Naikawadi RP, Wolters PJ, Abate AR, et al. (2019). Reference-based analysis of lung single-cell sequencing reveals a transitional profibrotic macrophage. Nat Immunol 20, 163–172. - PMC - PubMed
    1. Ashburner M, Ball CA, Blake JA, Botstein D, Butler H, Cherry JM, Davis AP, Dolinski K, Dwight SS, Eppig JT, et al. (2000). Gene ontology: tool for the unification of biology. The Gene Ontology Consortium. Nat Genet 25, 25–29. - PMC - PubMed
    1. Barroso I, and McCarthy MI (2019). The Genetic Basis of Metabolic Disease. Cell 177, 146–161. - PMC - PubMed

Publication types