. 2022 Nov 15;3(11):100804.
doi: 10.1016/j.xcrm.2022.100804. Epub 2022 Nov 4.

Enhanced TLR3 responsiveness in hepatitis C virus resistant women from the Irish anti-D cohort

Affiliations

Enhanced TLR3 responsiveness in hepatitis C virus resistant women from the Irish anti-D cohort

Jamie A Sugrue et al. Cell Rep Med. .

Abstract

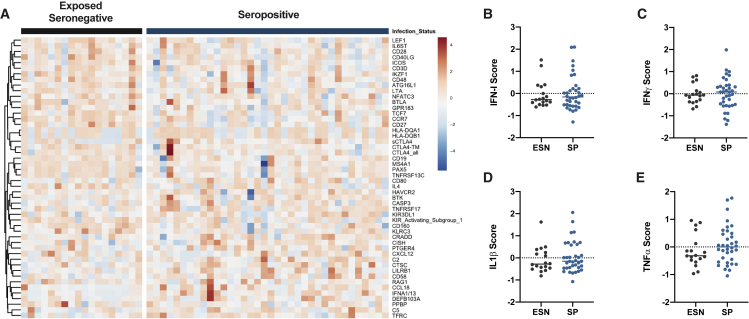
Natural resistance to infection is an overlooked outcome after hepatitis C virus (HCV) exposure. Between 1977 and 1979, 1,200 Rhesus D-negative Irish women were exposed to HCV-contaminated anti-D immunoglobulin. Here, we investigate why some individuals appear to resist infection despite exposure (exposed seronegative [ESN]). We screen HCV-resistant and -susceptible donors for anti-HCV adaptive immune responses using ELISpots and VirScan to profile antibodies against all know human viruses. We perform standardized ex vivo whole blood stimulation (TruCulture) assays with antiviral ligands and assess antiviral responses using NanoString transcriptomics and Luminex proteomics. We describe an enhanced TLR3-type I interferon response in ESNs compared with seropositive women. We also identify increased inflammatory cytokine production in response to polyIC in ESNs compared with seropositive women. These enhanced responses may have contributed to innate immune protection against HCV infection in our cohort.

Keywords: exposed seronegative; hepatitis C; immune variation; innate immunity; systems immunology; type I interferon; viral resistance.


Conflict of interest statement

Declarations of interests The authors declare no competing interests.

Figures

None
Graphical abstract
Figure 1
Figure 1
Infectivity rates of HCV contaminated anti-D from the IBTS (A) Table obtained from the IBTS showing the six high risk batches of contaminated anti-D. Figures in brackets are percentages. (B) Pie chart showing total numbers and percentages of ESNs, SRs, and SVRs who received a vial of HCV anti-D from a highly infectious batch.
Figure 2
Figure 2
Summary of recruitment process and overview of final cohort A national campaign was run to recruit women who received anti-D between 1977 and 1979 to our study. Seven hundred individuals contacted the group about the study. Four hundred fifty study packs were sent to eligible participants. Three hundred ninety-five study packs were returned and batch details were retrieved and matched for 234 women. One hundred two women who received an uncontaminated batch—34 ESN and 98 SP (48 SR and 50 SVR) with details of batch records were recruited.
Figure 3
Figure 3
Adaptive immunity in the recruited cohort (A) Overview of the workflow for VirScan. (B) Heatmap showing the top 30 virus hits in samples from our cohort. Red indicates high expression, while blue represents low expression. Comparisons between ESNs, SRs, SVRs, and UCs were made using Kruskal-Wallis tests followed by FDR correction (q > 0.01; n = 18 ESN, n = 19 SR, n = 17 SVR, and n = 29 UC). (C and D) IFN-γ-producing T cell counts per 106 PBMCs in ESNs, SRs, SVRs, and UCs after stimulation with ProMix (C) HCV and (D) CEF peptide pools shown on a linear axis. For ELISpots, comparisons between ESNs, SRs, SVRs, and UCs were made using the Kruskal-Wallis tests (p > 0.05). The dashed line represents the mean + 3 × SD of the UC group. The median per group is shown.
Figure 4
Figure 4
Innate immune stimuli induce changes in gene expression in whole blood from all donors Whole blood from ESN (n = 18), SR (n = 19) and SVR (n = 17) women was stimulated with a panel of antiviral agonists (R848, polyIC, IFNα2). (A) Overview of experimental workflow. (B) Principal component analysis plot of log2 normalized NanoString transcriptomic data. The percentage variance captured in PC1 and PC2 are indicated in brackets. Each point on the plot represents a single donor for the color denoted stimulation. (C) Heatmap of NanoString transcriptomic data (n = 50 genes) showing negative control (NC) and stimuli induced genes for IFNα2, polyIC, and R848.
Figure 5
Figure 5
Gene expression was similar in unstimulated whole blood from ESN and SP women Unstimulated whole blood was incubated at 37°C for 22 h. (A) Heatmap showing the top 50 genes with the lowest q values when comparing the ESN (n = 18) and SP (n = 36) donors in the null condition (q < 0.99). (B–D) Gene signature scores for (B) IFN-I, (C) IFN-γ, (D) IL1β, and (E) TNFα in the unstimulated null condition for the two infection groups. Data are presented with median shown as a solid line. Comparisons between ESNs and SPs were made using Mann-Whitney U tests.
Figure 6
Figure 6
PolyIC-induced higher IFN-I responses in ESN women Fresh whole blood was stimulated with IFNα2, R848, or polyIC for 22 h at 37°C and changes in gene expression assayed using NanoString transcriptomics. (A–C) Heatmaps showing the top 50 genes with the lowest q values when comparing the response with stimulation between ESN and SP donors. (A) IFNα2, p < 0.16, q value (FDR-adjusted p value) < 0.99 (B) R848, p < 0.15, q < 0.99, and (C) polyIC, p < 0.06, q < 0.65. (D–F) MIC-derived IFN-I score in ESN and SP donors after stimulation with (D) IFNα2 (E) R848, and (F) polyIC (∗p < 0.05). Data are presented with median line reported as a solid line. Comparisons between ESNs and SPs were made using Mann-Whitney U tests (∗p < 0.05).
Figure 7
Figure 7
Inflammatory cytokine production is increased in polyIC stimulated blood from ESN women Secreted cytokines from polyIC stimulated whole blood were quantified using Luminex and Simoa. (A) Spider plot of polyIC-induced cytokines differentially expressed between ESN and SP donors (∗p < 0.05, ∗∗p < 0.01). (B and C) IFNβ (B) and IFNα (C) protein levels measured using Simoa digital ELISA in supernatants from ESN and SP women after polyIC stimulation. Data are presented on a log10 scale with median line reported as a solid line. (D and E) Correlation between IFNβ (D) and IFNα (E) protein levels and the polyIC-induced IFN-I score. For Luminex and IFNα Simoa, n = 10 ESN, 20 SP; for everything else, n = 18 ESN, 36 SP. Comparisons between ESNs and SPs were made using Mann-Whitney U tests (∗p < 0.05, ∗∗p < 0.01).

References

    1. Yee L.J. Host genetic determinants in hepatitis C virus infection. Genes Immun. 2004;5:237–245. doi: 10.1038/sj.gene.6364090. - DOI - PubMed
    1. Westbrook R.H., Dusheiko G. Natural history of hepatitis C. J. Hepatol. 2014;61:S58–S68. doi: 10.1016/j.jhep.2014.07.012. - DOI - PubMed
    1. Garvey P., Murphy N., Flanagan P., Brennan A., Courtney G., Crosbie O., Crowe J., Hegarty J., Lee J., McIver M., et al. Disease outcomes in a cohort of women in Ireland infected by hepatitis C-contaminated anti-D immunoglobulin during 1970s. J. Hepatol. 2017;67:1140–1147. doi: 10.1016/j.jhep.2017.07.034. - DOI - PubMed
    1. Lawlor E., Power J., Garson J., Yap P., Davidson F., Columb G., Smith D., Pomeroy L., O’Riordan J., Simmonds P., et al. Transmission rates of hepatitis C virus by different batches of a contaminated anti-D immunoglobulin preparation. Vox Sang. 1999;76:138–143. - PubMed
    1. Wiese M., Fischer J., Löbermann M., Göbel U., Grüngreiff K., Güthoff W., Kullig U., Richter F., Schiefke I., Tenckhoff H., et al. Evaluation of liver disease progression in the German hepatitis C virus (1b)-contaminated anti-D cohort at 35 years after infection. Hepatology. 2014;59:49–57. doi: 10.1002/hep.26644. - DOI - PubMed

Publication types

LinkOut - more resources