. 2023 Oct:52:3-18.
doi: 10.1016/j.jare.2022.10.015. Epub 2022 Nov 9.

Dose-effect of polystyrene microplastics on digestive toxicity in chickens (Gallus gallus): Multi-omics reveals critical role of gut-liver axis

Affiliations

Dose-effect of polystyrene microplastics on digestive toxicity in chickens (Gallus gallus): Multi-omics reveals critical role of gut-liver axis

Kai Yin et al. J Adv Res. 2023 Oct.

Abstract

Introduction: Microplastic pollution seriously threatens the health and safety of humans and wildlife. Avian is one of the main species endangered by microplastics. However, the damage mechanism of microplastics to the digestive system of avian is not clear.

Objectives: The gut-liver axis is a bidirectional channel that regulates the exchange of information between the gut and the liver and is also a key target for tissue damage caused by pollutants. This study aimed to elucidate the digestive toxicity of microplastics in avian and the key role of the gut-liver axis in it.

Methods: We constructed an exposure model for microplastics in environmental concentrations and toxicological concentrations in chickens and reveal the digestive toxicity of polystyrene microplastics (PS-MPs) in avian by 16S rRNA, transcriptomics and metabolomics.

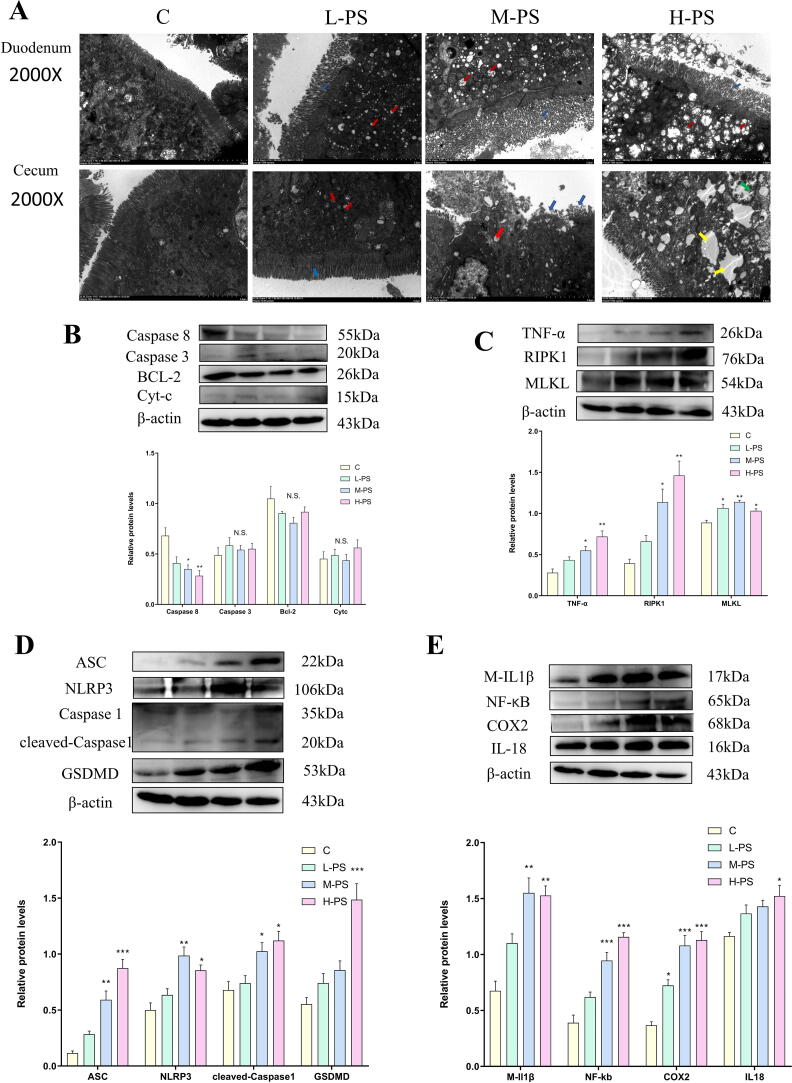
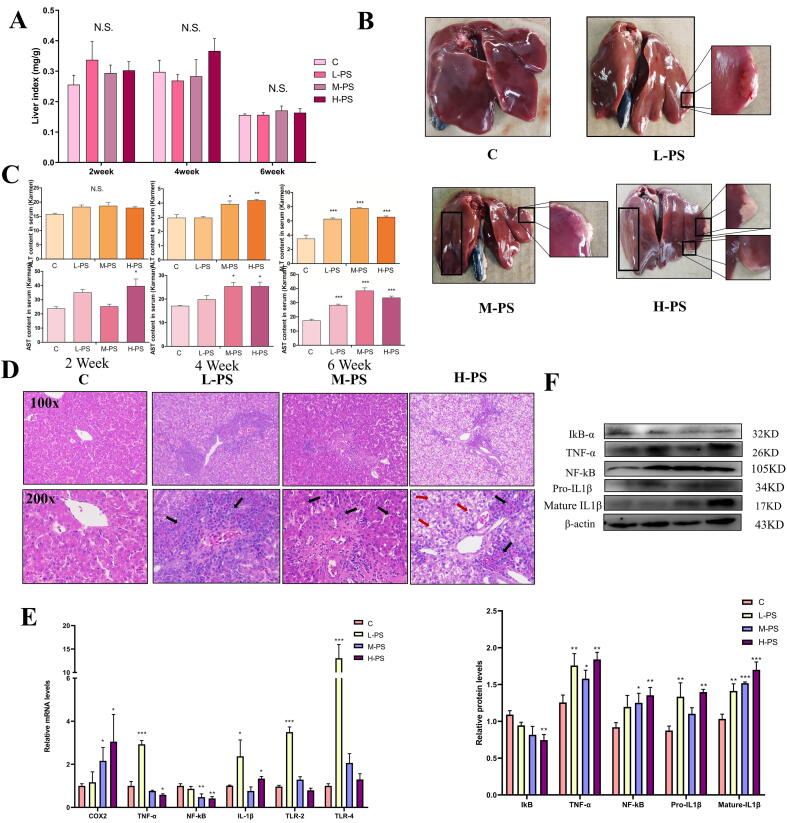
Results: PS-MPs changed the death mode from apoptosis to necrosis and pyroptosis by upregulating Caspase 8, disrupting the intestinal vascular barrier, disturbing the intestinal flora and promoting the accumulation of lipopolysaccharide. Harmful flora and metabolites were translocated to the liver through the liver-gut axis, eliciting hepatic immune responses and promoting hepatic lipid metabolism disorders and apoptosis. Liver injury involves multiple molecular effects of mitochondrial dynamics disturbance, oxidative stress, endoplasmic reticulum stress, and cell cycle disturbance. Furthermore, metabolomics suggested that caffeine and melanin metabolites may be potential natural resistance substances for microplastics.

Conclusion: Taken together, our data demonstrate the digestive damage of PS-MPs in avian, revealing a critical role of the liver-gut axis in it. This will provide a reference for protecting the safety of avian populations.

Keywords: Avian; Gut vascular barrier; Gut–liver axis; Microplastic; Multi-omics analysis.


Conflict of interest statement

Declaration of Competing Interest The authors declare that they have no known competing financial interests or personal relationships that could have appeared to influence the work reported in this paper.

Figures

None
Graphical abstract
Fig 1
Fig 1
PS-MPs mediate the destruction of the gut vascular barrier through the Wnt/β-catenin pathway. A: The weekly weight of chickens after PS-MPs exposure. B: Observation of duodenum anatomy, the black arrow is the bleeding point. C: Representative figure of HE staining of duodenum and cecum, red arrow: inflammatory infiltration, yellow arrow: intestinal crypt, blue arrow: submucosa. D: The content of diamine oxidase in serum. E-G: The expression levels of tight junction proteins and Wnt/β-catenin signaling pathway proteins. *P < 0.05, **P < 0.01, ***P < 0.001 (one-way analysis of variance (ANOVA) followed by post hoc Tukey’s test). (For interpretation of the references to colour in this figure legend, the reader is referred to the web version of this article.)
Fig 2
Fig 2
PS-MPs exposure caused intestinal tissue pyrolysis and necrosis instead of apoptosis. A: The cecum and duodenum were observed under a transmission electron microscope. Red arrow: mitochondria, blue arrow: intestinal villi, yellow arrow: nucleus, green arrow: cytoplasmic edge aggregation. B: Apoptosis-related protein expression level. C: Necroptosis-related protein expression level. D: Pyrolysis-related protein expression level. E: Inflammation-related protein expression level. (For interpretation of the references to colour in this figure legend, the reader is referred to the web version of this article.)
Fig 3
Fig 3
The intestinal flora changes after PS-MPs exposure. A: The α diversity index of intestinal flora includes Shannon index, Simpson index and Chao index. B: Venn diagram analysis of species between groups. C: Beta diversity analysis, PCoA and PLS-DA analysis. D: Relative abundance of intestinal bacteria at the phylum and family level. E: BugBase phenotype prediction, including seven categories: Gram Positive, Gram Negative, Biofilm Forming, Pathogenic, Mobile Element Containing, Oxygen Utilizing and Oxidative Stress Tolerant.
Fig 4
Fig 4
Changes of physiological and biochemical indexes of chickens exposed to PS-MPs for 6 weeks. A: The ratio of liver weight to body weight (mg/g) (n = 6). Data are mean ± SEM. B: Anatomical observation of liver tissue. C: Serum levels of ALT and AST in each treatment group after exposure to PS-MPs for 2, 4, and 6 weeks (n = 6). Data are mean ± SEM. D: HE staining of the liver (100X and 200X microscope), the black arrow points to inflammatory cell infiltration, and the red arrow points to the ballooning degeneration of hepatocytes. E-F: The expression level of inflammation-related genes and proteins. *P < 0.05, **P < 0.01, ***P < 0.001 (one-way analysis of variance (ANOVA) followed by post hoc Tukey’s test). (For interpretation of the references to colour in this figure legend, the reader is referred to the web version of this article.)
Fig 5
Fig 5
PS-MPs exposure disrupts mitochondrial dynamics and disrupts lipid metabolism homeostasis. A: Liver Oil Red O staining (100X and 200X microscope). B: The content of triglycerides and cholesterol in the liver and plasma. Data are mean ± SEM. C-E: The mRNA expression levels of fatty acid synthesis, transport and metabolism-related genes in the liver of each treatment group. Data are mean ± SEM. F: The mRNA expression levels of cholesterol transport and metabolism-related genes in the liver of each treatment group. Data are mean ± SEM. G: The expression levels of liver SREBP1, PPAR-α, PGC1 protein in each treatment group. Data are mean ± SEM. H, I:The expression levels of liver LXR and FXR mRNA in each treatment group. J: Electron microscope observation of liver cell damage. Mitochondria (yellow arrow), nucleus (blue arrow), lipid droplet (red arrow). K: The protein expression level of genes related to mitochondrial dynamics. Data are mean ± SEM. L: The mRNA expression level of genes related to mitochondrial dynamics. Data are mean ± SEM. *P < 0.05, **P < 0.01, ***P < 0.001 (one-way analysis of variance (ANOVA) followed by post hoc Tukey’s test). (For interpretation of the references to colour in this figure legend, the reader is referred to the web version of this article.)
Fig 6
Fig 6
PS-MPs exposure caused liver antioxidant system disorders, endoplasmic reticulum stress and apoptosis. A: Detection of CAT, SOD, GSH, MDA and T-AOC content in liver tissue. Data are mean ± SEM. B: Detection of mRNA expression levels of apoptosis-related genes. Data are mean ± SEM. C: Detection of protein expression levels of apoptosis-related genes. Data are mean ± SEM. D: Detection of protein expression levels of ER stress-related genes. Data are mean ± SEM. *P < 0.05, **P < 0.01, ***P < 0.001 (one-way analysis of variance (ANOVA) followed by post hoc Tukey’s test).
Fig 7
Fig 7
PS-MPs exposure caused damage to chicken LMH liver cells. A: Cell viability was tested by CCK8. Data are mean ± SEM. B: Observe the cell morphology with light microscope, normal cells (yellow arrow), microplastics (purple arrow), swollen cells (green arrow). C: ROS fluorescent probe staining of LMH cells. D: Flow cytometric detection of ROS fluorescence intensity of LMH cells. E: Flow cytometric detection of the level of apoptosis of LMH cells. F: Hoechst (yellow box) of LMH cells. Condensation of cell nuclei appears in Hoechst staining (orange arrow). G: Protein expression levels of apoptosis-related genes. H: Flow cytometry detects the cell cycle of LMH cell. I: Protein expression levels of cell cycle-related genes. *P < 0.05, **P < 0.01, ***P < 0.001 (one-way analysis of variance (ANOVA) followed by post hoc Tukey’s test). (For interpretation of the references to colour in this figure legend, the reader is referred to the web version of this article.)

References

    1. Lindeque P.K., Cole M., Coppock R.L., Lewis C.N., Miller R.Z., Watts A.J.R., et al. Are we underestimating microplastic abundance in the marine environment? A comparison of microplastic capture with nets of different mesh-size. Environ Pollut. 2020;265:12. doi: 10.1016/j.envpol.2020.114721. - DOI - PubMed
    1. Grbic J., Helm P., Athey S., Rochman C.M. Microplastics entering northwestern Lake Ontario are diverse and linked to urban sources. Water Res. 2020;174:10. doi: 10.1016/j.watres.2020.115623. - DOI - PubMed
    1. Wright S.L., Ulke J., Font A., Chan K.L.A., Kelly F.J. Atmospheric microplastic deposition in an urban environment and an evaluation of transport. Environ Int. 2020;136:7. doi: 10.1016/j.envint.2019.105411. - DOI - PMC - PubMed
    1. Yao L.M., Hui L., Yang Z., Chen X.D., Xiao A.R. Freshwater microplastics pollution: Detecting and visualizing emerging trends based on Citespace II. Chemosphere. 2020;245:8. doi: 10.1016/j.chemosphere.2019.125627. - DOI - PubMed
    1. Horton A.A., Walton A., Spurgeon D.J., Lahive E., Svendsen C. Microplastics in freshwater and terrestrial environments: Evaluating the current understanding to identify the knowledge gaps and future research priorities. Sci Total Environ. 2017;586:127–141. doi: 10.1016/j.scitotenv.2017.01.190. - DOI - PubMed

Publication types

LinkOut - more resources