

Medial Frontal Cortex GABA Concentrations in Psychosis Spectrum and Mood Disorders: A Meta-analysis of Proton Magnetic Resonance Spectroscopy Studies
- PMID: 36335069
- PMCID: PMC10184477
- DOI: 10.1016/j.biopsych.2022.08.004
Medial Frontal Cortex GABA Concentrations in Psychosis Spectrum and Mood Disorders: A Meta-analysis of Proton Magnetic Resonance Spectroscopy Studies
Abstract
Background: Abnormalities of GABAergic (gamma-aminobutyric acidergic) systems may play a role in schizophrenia and mood disorders. Magnetic resonance spectroscopy allows for noninvasive in vivo quantification of GABA; however, studies of GABA in schizophrenia have yielded inconsistent findings. This may stem from grouping together disparate voxels from functionally heterogeneous regions.
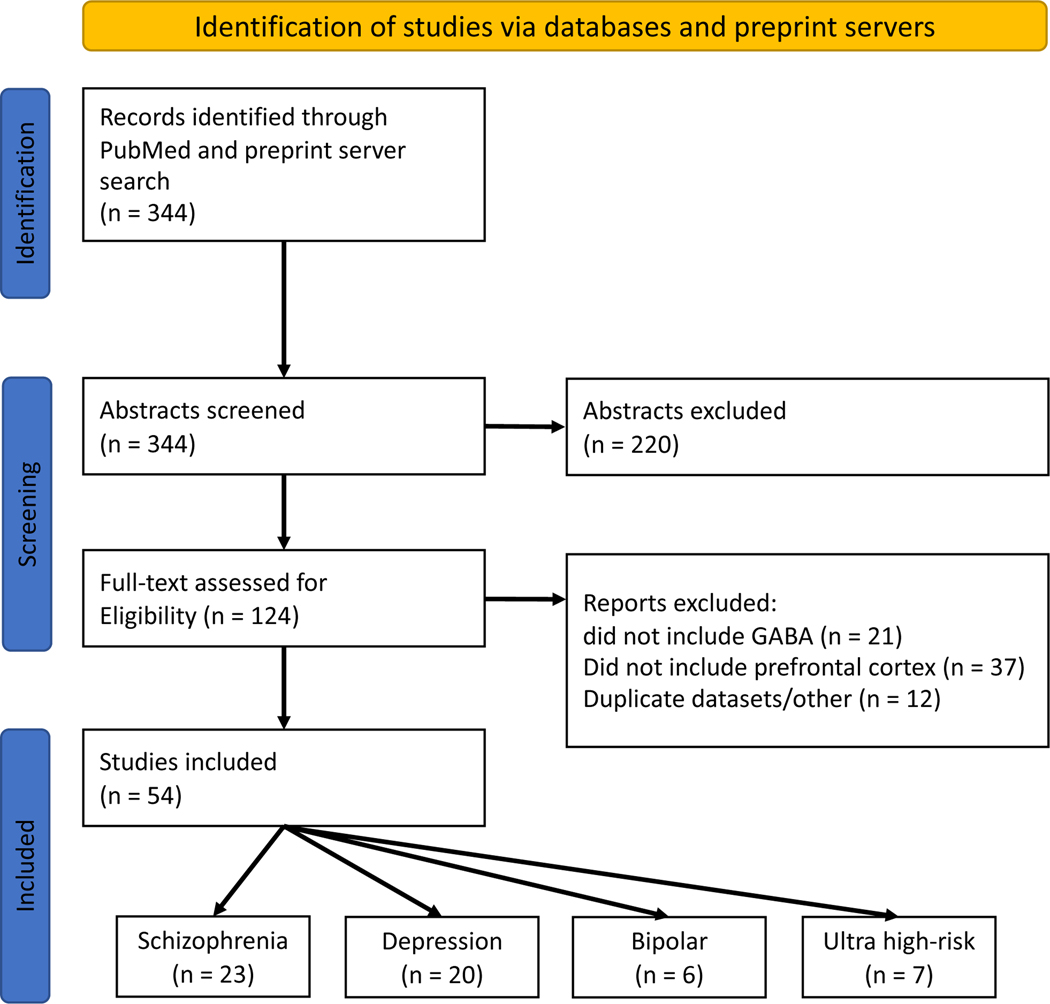
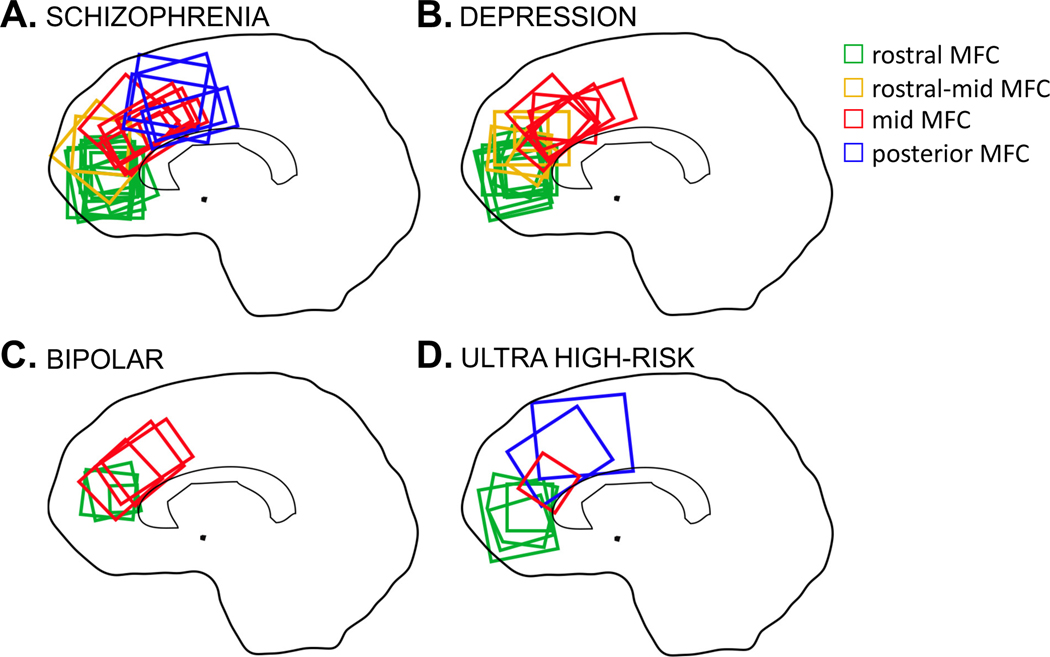
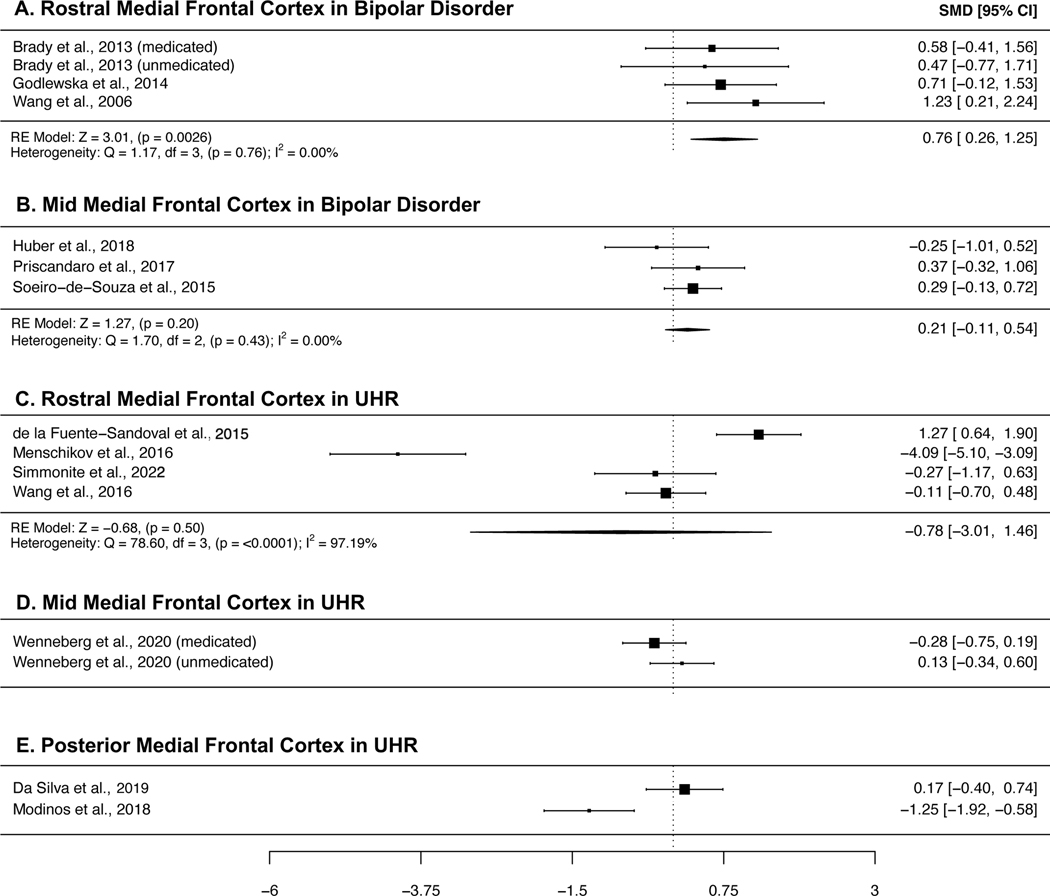
Methods: We searched PubMed for magnetic resonance spectroscopy studies of GABA in the medial frontal cortex (MFC) in patients with schizophrenia, bipolar disorder, and depression and in individuals meeting criteria for ultra-high risk for psychosis. Voxel placements were classified as rostral-, rostral-mid-, mid-, or posterior MFC, and meta-analyses were conducted for each group for each subregion.
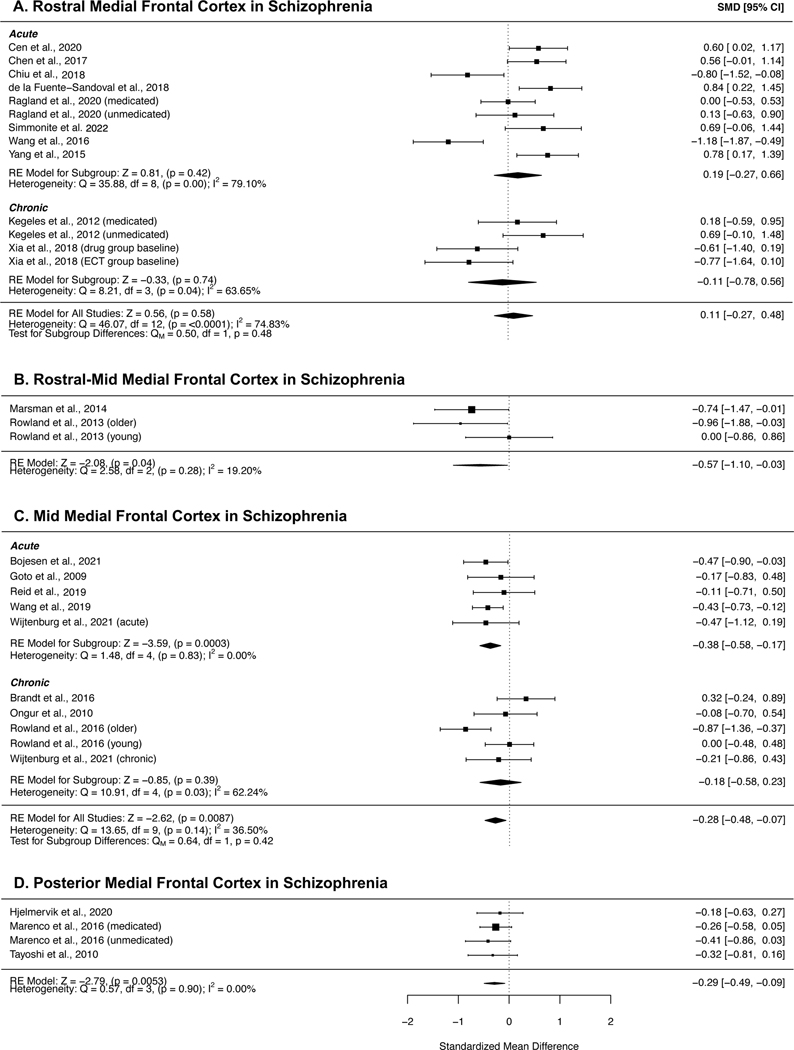
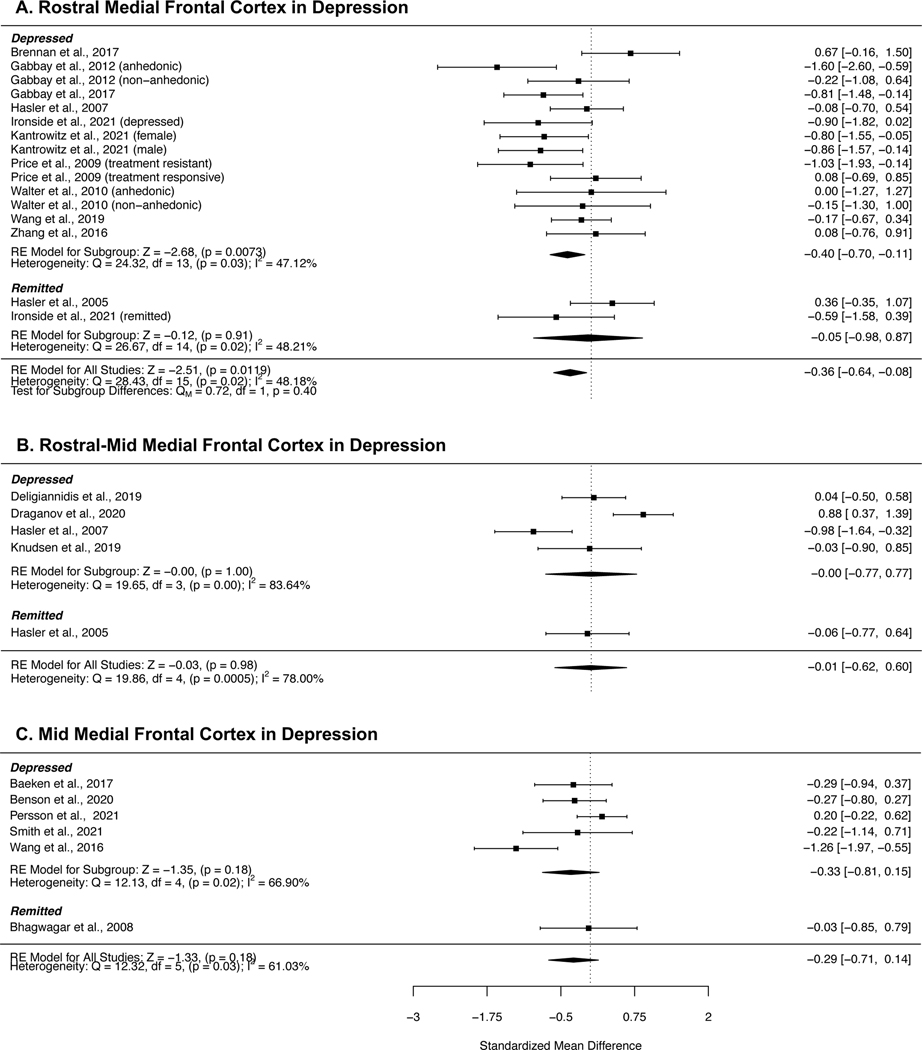
Results: Of 341 screened articles, 23 studies of schizophrenia, 6 studies of bipolar disorder, 20 studies of depression, and 7 studies of ultra-high risk met the inclusion criteria. Meta-analysis revealed lower mid- (standardized mean difference [SMD] = -0.28, 95% CI, -0.48 to -0.07, p < .01) and posterior (SMD = -0.29, 95% CI, -0.49 to -0.09, p < .01) MFC GABA in schizophrenia and increased rostral MFC GABA in bipolar disorder (SMD = 0.76, 95% CI, 0.25 to -1.25, p < .01). In depression, reduced rostral MFC GABA (SMD = -0.36, 95% CI, -0.64 to -0.08, p = .01) did not survive correction for multiple comparisons. We found no evidence for GABA differences in individuals at ultra-high risk for psychosis.
Conclusions: While limited by small numbers of published studies, these results substantiate the relevance of GABA in the pathophysiology of psychosis spectrum and mood disorders and underline the importance of voxel placement.
Keywords: (1)H-MRS; Bipolar disorder; GABA; Schizophrenia; Ultra-high risk.
Copyright © 2022 Society of Biological Psychiatry. Published by Elsevier Inc. All rights reserved.
Conflict of interest statement
DISCLOSURES
S.F.T. has received contracted research support from Boehringer-Ingelheim, and he receives consulting fees for membership on scientific advisory boards for NIH- and privately funded projects. M.S., and C.J.S report no biomedical financial interests or potential conflicts of interest.
Figures
References
-
- Lewis DA, Hashimoto T, Volk DW (2005, April): Cortical inhibitory neurons and schizophrenia. Nature Reviews Neuroscience, vol. 6. Nature Publishing Group, pp 312–324. - PubMed
-
- Volk DW, Austin MC, Pierri JN, Sampson AR, Lewis DA (2000): Decreased glutamic acid decarboxylase67 messenger RNA expression in a subset of prefrontal cortical γ-aminobutyric acid neurons in subjects with schizophrenia. Arch Gen Psychiatry 57: 237–245. - PubMed
-
- Akbarian S, Kim JJ, Potkin SG, Hagman JO, Tafazzoli A, Bunney WE, Jones EG (1995): Gene Expression for Glutamic Acid Decarboxylase is Reduced without Loss of Neurons in Prefrontal Cortex of Schizophrenics. Arch Gen Psychiatry 52: 258–266. - PubMed
-
- Thompson M, Weickert CS, Wyatt E, Webster MJ (2009): Decreased glutamic acid decarboxylase67 mRNA expression in multiple brain areas of patients with schizophrenia and mood disorders. J Psychiatr Res 43: 970–977. - PubMed
Publication types
MeSH terms
Substances
Grants and funding
LinkOut - more resources
Full Text Sources
Medical
Miscellaneous
