. 2022 Nov 5;13(11):927.
doi: 10.1038/s41419-022-05366-8.

Androgen deprivation restores ARHGEF2 to promote neuroendocrine differentiation of prostate cancer

Affiliations

Androgen deprivation restores ARHGEF2 to promote neuroendocrine differentiation of prostate cancer

Xuanrong Chen et al. Cell Death Dis. .

Erratum in

Abstract

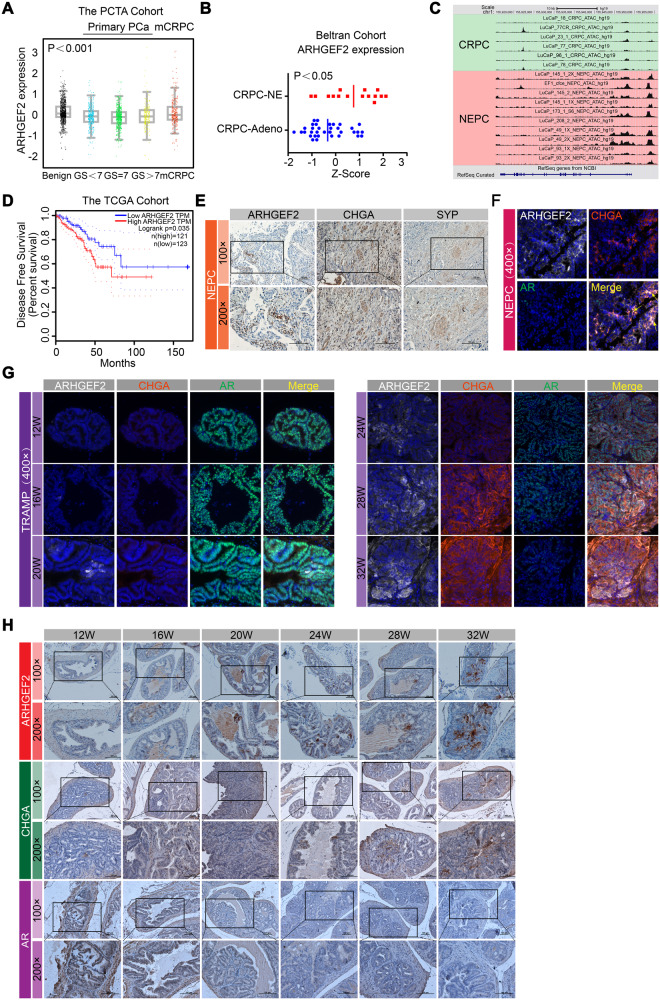
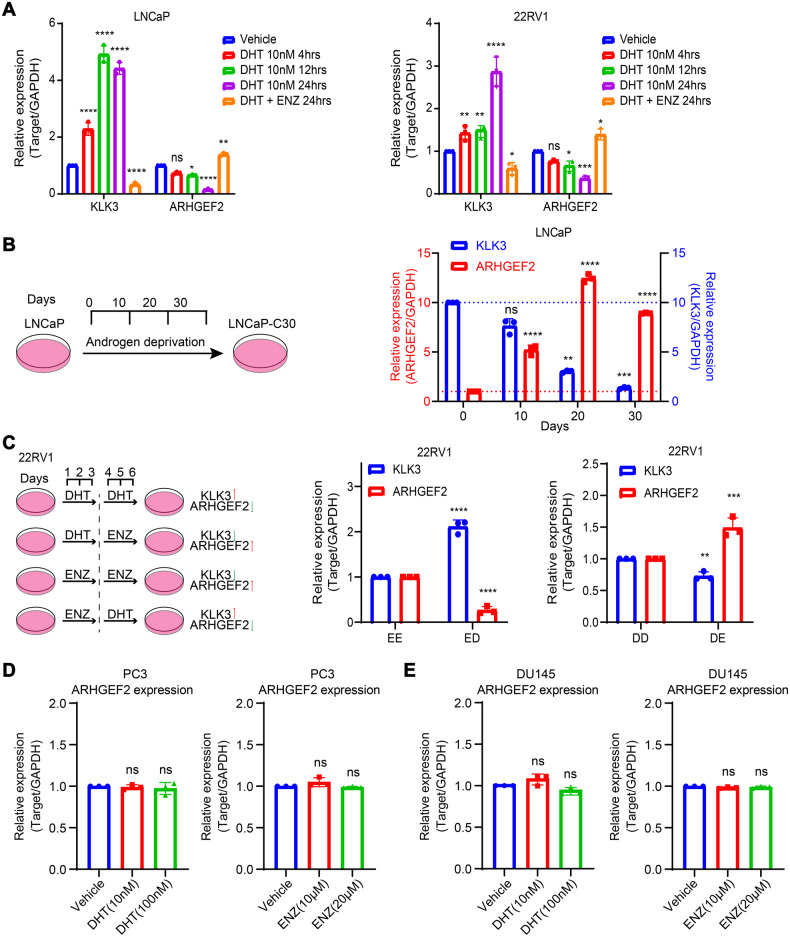
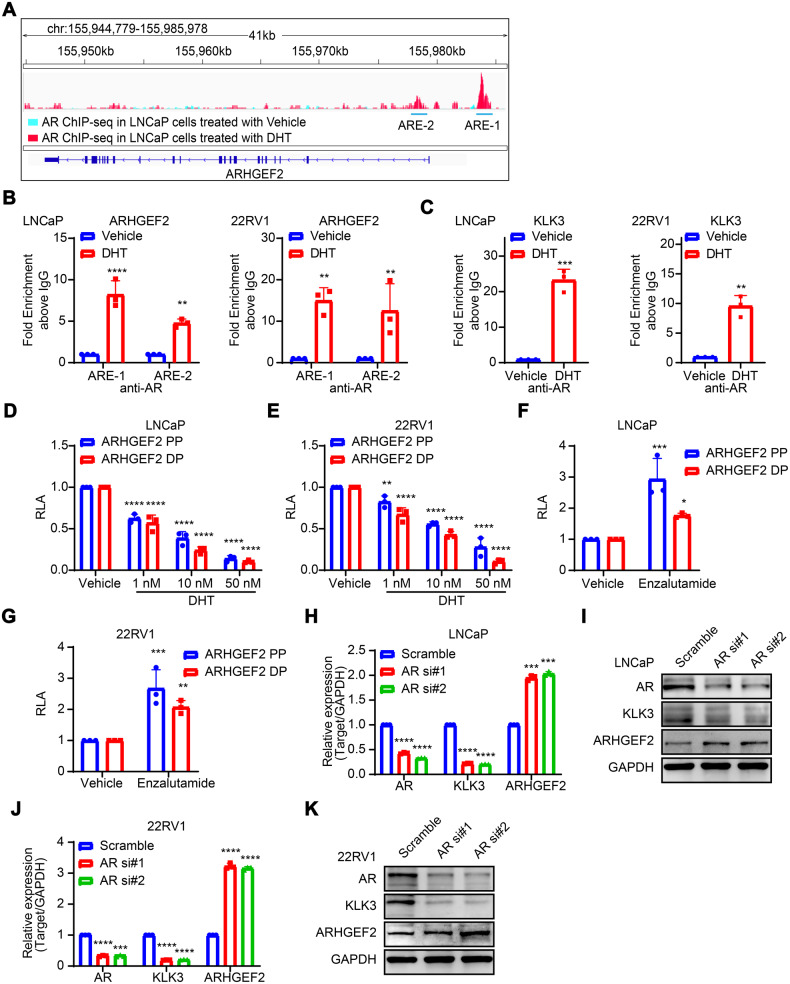
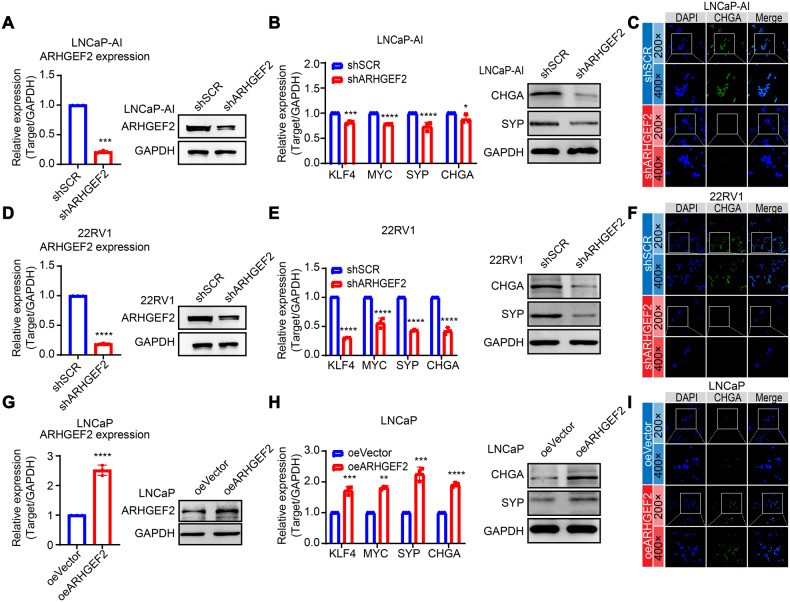
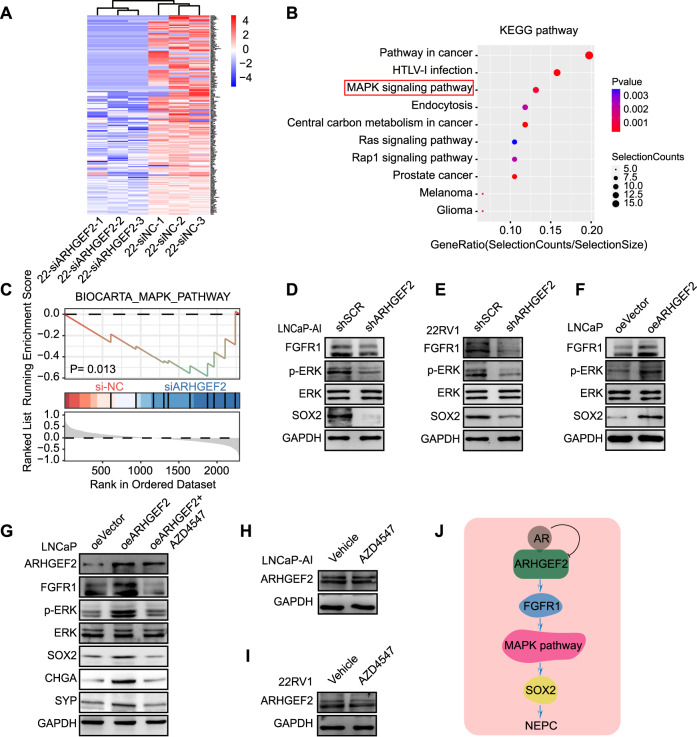
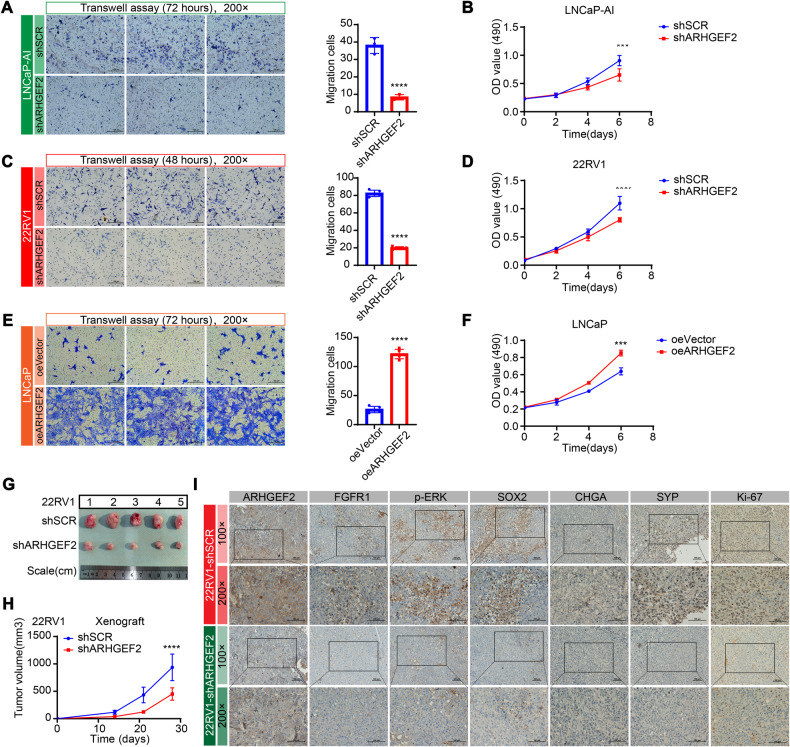
Androgen receptor (AR) plays an important role in the progression of prostate cancer and has been targeted by castration or AR-antagonists. The emergence of castration-resistant prostate cancer (CRPC) after androgen deprivation therapy (ADT) is inevitable. However, it is not entirely clear how ADT fails or how it causes resistance. Through analysis of RNA-seq data, we nominate ARHGEF2 as a pivotal androgen-repressed gene. We show that ARHGEF2 is directly suppressed by androgen/AR. AR occupies the enhancer and communicates with the promoter region of ARHGEF2. Functionally, ARHGEF2 is important for the growth, lethal phenotype, and survival of CRPC cells and tumor xenografts. Correspondingly, AR inhibition or AR antagonist treatment can restore ARHGEF2 expression, thereby allowing prostate cancer cells to induce treatment resistance and tolerance. Overall, our findings provide an explanation for the contradictory clinical results that ADT resistance may be caused by the up-regulation of ARHGEF2 and provide a novel target.


Conflict of interest statement

The authors declare no competing interests.

Figures

Fig. 1
Fig. 1. ARHGEF2 highly expressed in neuroendocrine prostate cancer (NEPC).
A The expression level of ARHGEF2 in the PCTA cohort [39]. B The expression level of ARHGEF2 in the Beltran cohort [20]. C Snapshot of the chromatin accessibility on the ARHGEF2 gene locus in both CRPC and NEPC tissues from a clinical cohort [41]. D Kaplan-Meier analysis of OS based on ARHGEF2 expression in the TCGA cohort [58]. E Representative images of ARHGEF2, CHGA, and SYP staining in NEPC patient tissue. F Immunoblot for ARHGEF2 (white), CHGA (red), and AR (green) in NEPC patient tissues. G Immunoblot for ARHGEF2 (white), CHGA (red), and AR (green) in TRAMP mice from prostate tissue acquired during different times (from 12 weeks to 32 weeks). H IHC analysis of ARHGEF2, CHGA, and AR expression in TRAMP mice from prostate tissue acquired during different times (from 12 weeks to 32 weeks). Data represent mean ± SD. For panel A Rank sums-test was applied. For panel B two-tailed unpaired Student’s t-test was applied; ****P ≤ 0.0001.
Fig. 2
Fig. 2. ARHGEF2 expression is suppressed by AR in prostate cancer cells.
A QPCR data showing the relative expression of ARHGEF2 and KLK3 in LNCaP (left) and 22RV1 (right) cells stimulated for several DHT (10 nM) treatment periods and enzalutamide. B. QPCR data showing relative expression of ARHGEF2 and KLK3 in long-term androgen deprived LNCaP cells (LNCaP-C30, LNCaP cells were cultured in androgen deprived medium for 30 days). C (Left) Schema depicting the sequential treatment of 22RV1 cells with DHT (10 nM) and enzalutamide (ENZ, 10 µM). (Right) QPCR data showing relative expression of ARHGEF2 and KLK3 using cells with sequential treatment of 22RV1 cells with DHT and/or ENZ as depicted. D QPCR data showed relative expression of ARHGEF2 using PC3 cells (an AR-negative PCa cell line) with DHT (10 nM and 100 nM) and enzalutamide (ENZ, 10 µM and 20 µM). E. QPCR data showed relative expression of ARHGEF2 using DU145 cells (an AR-negative PCa cell line) with DHT (10 nM and 100 nM) and enzalutamide (ENZ, 10 µM and 20 µM). For panels A and B, two-way ANOVA, Dunnett’s multiple-comparisons test; C, two-way ANOVA, Sidak’s multiple-comparisons test; D and E, two-tailed unpaired Student’s t-test was applied. Error bar indicates the standard deviation (SD). *P ≤ 0.05, **P ≤ 0.01, ***P ≤ 0.001, ****P < 0.0001 and ns not significant.
Fig. 3
Fig. 3. AR directly participates in transcriptional regulation of ARHGEF2 and modulates its expression.
A Cut-Tag (ChIP-seq) track for AR overlapping signals (blue: AR binding status in LNCaP cells in Vehicle treatment; red: AR binding status in DHT treatment) at ARHGEF2 gene region. Schema showing genomic locations for the AREs on the ARHGEF2 gene flank relative to TSS region (transcriptional start site). For AR ChIP-seq data, the GSM3567212 dataset was acquired to demonstrate AR binding status in LNCaP cells treated with vehicle. Our Cut-Tag assay was performed to demonstrate AR binding status in LNCaP cells treated with DHT. B, C ChIP-qPCR data showing recruitment of AR to the ARHGEF2 B and KLK3 C promoters in LNCaP and 22RV1 cells after DHT (10 nM) stimulation 24 h. D, E Luciferase reporter activity of the proximal (ARHGEF2-PP) and distal ARHGEF2 (ARHGEF2-DP) promoters in DHT (10 nM) stimulated LNCaP D and 22RV1 E cells. F, G Luciferase reporter activity of the proximal (ARHGEF2-PP) and distal ARHGEF2 (ARHGEF2-DP) promoters in enzalutamide (10 µM) stimulated LNCaP (F) and 22RV1 (G) cells. H, I QPCR H and immunoblot I data showing relative expression of AR and ARHGEF2 in AR-silenced and control LNCaP cells. JK QPCR J and immunoblot K data showing relative expression of AR and ARHGEF2 in AR-silenced and control 22RV1 cells. Experiments were performed with n = 3 biologically independent samples; data represents mean ± SD. For panels C two-tailed unpaired Student’s t-test; B, DH and J two-way ANOVA, Sidak’s multiple-comparisons test was applied. *P ≤ 0.05, **P ≤ 0.01, ***P ≤ 0.001, and ****P < 0.0001.
Fig. 4
Fig. 4. ARHGEF2 promotes the neuroendocrine differentiation in prostate cancer.
A QPCR and Immunoblot data showing ARHGEF2 expression levels in ARHGEF2-silenced (shARHGEF2) and control (shSCR) LNCaP-AI cells. B QPCR data showing relative expression of KLF4, MYC, SYP and CHGA using same cells as A. Immunoblot data showing SYP and CHGA expression using same cells as A. C Immunostaining for CHGA in ARHGEF2-silenced (shARHGEF2) and control (shSCR) LNCaP-AI cells. D QPCR and Immunoblot data showing ARHGEF2 expression levels in ARHGEF2-silenced (shARHGEF2) and control (shSCR) 22RV1 cells. E QPCR data showing relative expression of KLF4, MYC, SYP and CHGA using same cells as D; Immunoblot data showing SYP and CHGA expression using same cells as D. F Immunostaining for CHGA in ARHGEF2-silenced (shARHGEF2) and control (shSCR) 22RV1 cells. G QPCR and Immunoblot data showing ARHGEF2 expression levels in ARHGEF2-overexpressed (oeARHGEF2) and control (oeVector) LNCaP cells. H QPCR data showing relative expression of KLF4, MYC, SYP and CHGA using same cells as G. Immunoblot data showing SYP and CHGA expression using same cells as G. I Immunostaining for CHGA using same cells as G. For panels A, D, G two-tailed unpaired Student’s t-test; B, H, I two-way ANOVA, Sidak’s multiple-comparisons test was applied. *P ≤ 0.05, **P ≤ 0.01, ***P ≤ 0.001, and ****P < 0.0001.
Fig. 5
Fig. 5. ARHGEF2 regulate SOX2 via FGFR1/MAPK pathway in PCa.
A Heatmap showing genes up-regulated (red) or down-regulated (blue) in 22RV1 ARHGEF2 downregulated cells obtained by RNA-seq analysis. B, C KEGG pathway enrichment (B) and GSEA (C) analysis showing the MAPK pathway enriched in the 22RV1-siARHGEF2 group relative to control. D, E Immunoblot analysis for protein levels in SOX2 and FGFR1/MAPK pathway in ARHGEF2-silenced (shARHGEF2) and control (shSCR) LNCaP-AI (left) and 22RV1 (right) cells. F Immunoblot analysis for protein levels in SOX2 and FGFR1/MAPK pathway in ARHGEF2-overexpressed (oeARHGEF2) and control (oeVector) LNCaP cells. G Immunoblot analysis for protein levels in SOX2 and FGFR1/MAPK pathway using the same cells as F treated with AZD4547. AZD4547, a selective FGFR inhibitor [50]. H, I Immunoblot analysis for protein levels in ARHGEF2 using the LNCaP-AI and 22RV1 cells treated with Vehicle and AZD4547. J Illustration showing AR-repressed ARHGEF2 regulate SOX2 via FGFR1/MAPK pathway in prostate cancer. AR, androgen receptor; ARHGEF2, Rho guanine nucleotide exchange factor 2; FGFR1, fibroblast growth factor receptor 1; SOX2 SRY-Box transcription factor 2; NE neuroendocrine.
Fig. 6
Fig. 6. Targeting ARHGEF2 reduces the tumor growth of prostate cancer cells.
A Transwell migration assay in LNCaP-AI cells infected with lentiviruses carrying shARHGEF2. The left panel shows the representative microphotographs from a single independent experiment (scale bar = 100 µm). B MTT assays in LNCaP-AI cells infected with lentiviruses carrying shARHGEF2. Cell growth assessed daily for 6 days using an MTT assay in LNCaP-AI cells. Data were obtained from three independent experiments with samples in triplicate. C Transwell migration assay in 22RV1 cells infected with lentiviruses carrying shARHGEF2. The left panel shows the representative microphotographs from a single independent experiment (scale bar = 100 µm). D MTT assays in 22RV1 cells infected with lentiviruses carrying shARHGEF2. Cell growth assessed daily for 6 days using an MTT assay in 22RV1 cells. Data were obtained from three independent experiments with samples in triplicate. E, F Transwell migration assay (E) from a single independent experiment and MTT assays (F) in LNCaP cells infected with lentiviruses carrying overexpressed ARHGEF2 (oeARHGEF2). G Representative image of the dissected tumors was shown. H Growth curves of xenografts of 22RV1 cells infected with shSCR or shARHGEF2. Data are representative of mean ± SD of n = 5 tumors per group. I Representative image of the dissected tumors was shown. Representative images showing immunostaining (×100 and ×200 magnification) for ARHGEF2, FGFR1, p-ERK, SOX2, CHGA, SYN and Ki-67 in tumor specimens obtained from xenografts. For panels A, C, E two-tailed unpaired Student’s t-test; For panels B, D, F, and H, two-way ANOVA, Sidak’s multiple-comparisons test was applied. *P ≤ 0.05, **P ≤ 0.01, ***P ≤ 0.001, and ****P < 0.0001.

Similar articles

Cited by

References

    1. Siegel RL, Miller KD, Fuchs HE, Jemal A. Cancer Statistics, 2021. CA Cancer J Clin. 2021;71:7–33. doi: 10.3322/caac.21654. - DOI - PubMed
    1. Haffner MC, Zwart W, Roudier MP, True LD, Nelson WG, Epstein JI, et al. Genomic and phenotypic heterogeneity in prostate cancer. Nat Rev Urol. 2020;18:79–92. doi: 10.1038/s41585-020-00400-w. - DOI - PMC - PubMed
    1. Sumiyoshi T, Chi KN, Wyatt AW. Clinical implications of genomic alterations in metastatic prostate cancer. Prostate Cancer Prostatic Dis. 2021;24:310–322. doi: 10.1038/s41391-020-00308-x. - DOI - PubMed
    1. Heinlein CA, Chang C. Androgen receptor in prostate cancer. Endocr Rev. 2004;25:276–308. doi: 10.1210/er.2002-0032. - DOI - PubMed
    1. Dehm SM, Tindall DJ. Molecular regulation of androgen action in prostate cancer. J Cell Biochem. 2006;99:333–44. doi: 10.1002/jcb.20794. - DOI - PubMed

Publication types

MeSH terms