. 2022 Nov 5;13(1):6692.
doi: 10.1038/s41467-022-34497-x.

Structural basis for the activation of the lipid scramblase TMEM16F

Affiliations

Structural basis for the activation of the lipid scramblase TMEM16F

Melanie Arndt et al. Nat Commun. .

Abstract

TMEM16F, a member of the conserved TMEM16 family, plays a central role in the initiation of blood coagulation and the fusion of trophoblasts. The protein mediates passive ion and lipid transport in response to an increase in intracellular Ca2+. However, the mechanism of how the protein facilitates both processes has remained elusive. Here we investigate the basis for TMEM16F activation. In a screen of residues lining the proposed site of conduction, we identify mutants with strongly activating phenotype. Structures of these mutants determined herein by cryo-electron microscopy show major rearrangements leading to the exposure of hydrophilic patches to the membrane, whose distortion facilitates lipid diffusion. The concomitant opening of a pore promotes ion conduction in the same protein conformation. Our work has revealed a mechanism that is distinct for this branch of the family and that will aid the development of a specific pharmacology for a promising drug target.


Conflict of interest statement

The authors declare no competing interests.

Figures

Fig. 1
Fig. 1. Activation properties of pore mutants.
a Alanine scan of residues lining the pore of the closed ion and lipid permeation region of TMEM16F. Top, initial fluorescence in a cell-based lipid scrambling assay monitoring the binding of fluorescently tagged annexin V to phosphatidylserine at the cell surface. Values reflecting the lipid transport activities of TMEM16F mutants at resting Ca2+-concentrations were normalized to the fluorescence of WT (dashed line). Data show mean of the displayed number of experiments, errors are s.e.m. Bottom, EC50 of Ca2+ activation recorded in excised patches. Data show EC50 values derived from a Hill-fit of dose-response curves shown in Supplementary Fig. 1b. Mutant EC50s are expressed as log-ratio compared to WT, errors are 95% confidence intervals. Dashed lines refer to the 95% confidence interval of WT. Colors reflect direction and magnitude of change. b Scatter plot illustrating the relationship between mean values for scrambling normalized to WT and log-fold changes in the EC50 for each mutant as depicted in a. Colors refer to the location of the site of mutation. Data from selected residues are labeled. c General architecture of TMEM16F (PDBID 6QPB). The box highlights the subunit cavity. d Cα representation of the subunit cavity constituting the ion and lipid permeation region of TMEM16F (PDBID 6QP6) with Cα positions of mutated residues shown as spheres and colored according to the magnitude of the effect shown in a. Membrane boundaries are indicated. Inset (right) shows blowup of the tightly packed region with residue number of mutated sites indicated. Source data are provided as a Source Data file.
Fig. 2
Fig. 2. Characterization of activating mutants.
a Ca2+-concentration-response relationships of mutants of Phe 518 measured in inside-out patches. b EC50 values of Ca2+ plotted against the normalized hydrophobicity (Eisenberg and Weiss Scale) of the respective Phe 518 mutations. Line shows a fit to the data. c Ca2+-concentration-response relationships of mutants of Asn 562 and d Tyr 563 measured in inside-out patches. a, c, d Data show averages of multiple experiments derived from independent cells (WT n = 10, F518H n = 5, F518Q n = 4, F518Y n = 5-6, F518A n = 5-9, F518I n = 7, N562A, n = 5, N562L n = 4, Y563A n = 5, Y563H n = 3–6), errors are s.e.m., lines show fit to a Hill equation. e, f Lipid transport of Phe 518 mutants quantified in a cellular scrambling assay. e Initial values recorded at resting Ca2+ concentration and f levels measured 600 s after application of ionomycin, which increases intracellular Ca2+. Individual experiments are depicted as spheres (mock n = 10, F518I, F518A, F518Y n = 3, F518Q n = 4, F518H n = 6), errors are s.e.m. g, h Liposome-based in vitro scrambling assay of the reconstituted mutant F518H in comparison to WT. g Time-dependent fluorescence decrease upon addition of the reducing agent dithionite (t = 60 s) at 0 and 1000 µM Ca2+ compared to WT. Data show mean of three technical replicates, errors (s.e.m.) are smaller than the displayed line width. h Ca2+-concentration response relationship of scrambling of the mutant F518H compared to WT obtained from three technical replicates (displayed in Supp. Fig. 2d). Values were obtained as described in the methods. Solid line shows fit to a Hill equation, errors are s.e.m. Source data are provided as a Source Data file.
Fig. 3
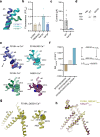
Fig. 3. Structures of the mutant F518H.
a Cryo-EM density of the F518HnoCa structure at 3.39 Å with one subunit shown in color. b Ribbon representation of the F518HnoCa subunit and c blowup of the pore region. d Cryo-EM density of the F518HCaND structure at 2.93 Å with one subunit shown in color. e Ribbon representation of the F518HCaND subunit and f blowup of the pore region. g Cryo-EM density of the F518HCa structure at 2.96 Å with one subunit shown in color. h Ribbon representation of the F518HCa subunit and i blowup of the pore region. a, d, g Relationships between views are indicated. a, b, d, e, g, h Lines indicate membrane boundaries. c, f, i WTCa (PDBID 6QP6) is shown in gray for comparison, arrows indicate movements. a–i Selected transmembrane helices are labeled. f, i Ca2+ ions are displayed as blue spheres.
Fig. 4
Fig. 4. Structural features of the activating mutant F518H.
Superposition of the pore region of different structures of F518H encompassing α-helices 3-6 (a), α4 (b) and α3 (c). b, c Lines indicate axes for different helix sections to approximate conformational changes. d Packing interactions of α3 and 4 (ribbon) with the remainder of the protein (depicted as molecular surface) in different conformations of TMEM16F. Relationship between α4 and α6 in e, F518HnoCa and f, F518HCa with inset displaying blow-up of the contact region with sections of the molecular surface shown.
Fig. 5
Fig. 5. Ion and lipid conduction region.
a Pore region observed in the structure of F518HCa. The view is from the outside. Inset depicts blow-up of the same region with sidechains of selected pore-lining residues shown as sticks. Red circle marks pore center, asterisk, the position of Gly 473. b Channel viewed from within the membrane. The protein-enclosed aqueous pore and the molecular surface facing the lipid blayer of the same region are indicated. c Pore diameter estimated by Hole mapped along the pore axis from the outside (top) to the inside (bottom) for indicated structures. b, c, * and # indicate equivalent positions in both panels. The molecular surface of the pore region of WTCa (d) and F518HCa (e) viewed from within the membrane illustrates the exposure of hydrophilic patches to the lipid bilayer in F518HCa upon activation. Asterisk marks equivalent positions. a, b, d, e The molecular surface is colored according to the properties of contacting residues (blue for basic, red for acidic and green for polar residues).
Fig. 6
Fig. 6. Features of the activating mutant N562A.
Cryo-EM densities of the symmetric closed dimer of N562ACa at 3.01 Å (a) and the asymmetric dimer at 3.49 Å with the activated subunit shown in color (b). Subunit conformations are indicated as closed (c) and open (o). c Comparison of the open conformation of N562ACa and F518HCa. Pore-lining helices are shown as Cα-trace. d Relationship between α4 and α6 in the activated conformation of N562ACa. Residues that are in contact in the activated subunit are shown as space-filling models.
Fig. 7
Fig. 7. Structural properties of the detergent and lipid region in inactive and active states.
Densities of a Ca2+-bound TMEM16F WT in 2N2 lipid nanodiscs (PDBID 6QPC, WTCaND), b the Ca2+-bound TMEM16F F518H mutant in 2N2 lipid nanodiscs (F518HCaND), c the Ca2+-free TMEM16F F518H mutant in digitonin (F518HnoCa), d the Ca2+-bound TMEM16F F518H mutant in digitonin (F518HCa), e Ca2+-bound TMEM16F WT in digitonin (PDBID 6QP6, WTCa), and f the Ca2+-bound TMEM16F N562A mutant (N562ACa) in the asymmetric state viewed towards the activated subunit. All maps were low-pass filtered at 7 Å. The colored region depicts the detergent micelle or nanodisc belt. af Insets show zoom into highlighted region. The view is towards the subunit cavity of one subunit. The functional state of the respective structures (active, inactive) is indicated.
Fig. 8
Fig. 8. Functional relevance of residues during activation.
a Conformation of α3 around the hinge residue Gly 473 (circle) in structures obtained for the mutant F518H. b Lipid transport activity of Gly 473 mutants quantified in a cellular scrambling assay. Data shows fluorescence levels normalized to WT, at elevated Ca2+, 600 s after application of ionomycin. Dashed line indicates mean value of WT. Bars show mean of six biological replicates (depicted as spheres), errors are s.e.m. c Current magnitudes of HEK293T cells expressing WT or G473P recorded in excised patches. Bars represent mean of individual experiments (n = 8), errors are s.e.m. d Surface expression of G473P. Anti-myc Western blot corresponds to biotinylated constructs pulled-down from HEK293T cells expressing myc-tagged WT or G473P after surface biotinylation. Samples are derived from the same experiment, gels and blots were processed in parallel. e Interactions between residues on α-helices 4 and 6 that are in contact in the active but not the inactive state of TMEM16F. f Coupling energies between residues depicted in e. Inset shows scheme of the double-mutant cycle analysis. WT/F518A/Q623A and WT/F518A/W619A refer to the cycle quantifying the effect of mutations F518A and either Q623A or W619A relative to WT, F518H/F518A/F518H_Q623A to the cycle of F518A and F518H_Q623A relative to the mutant F518H. g Contact region between α-helices 4 and 6 in the activated state of the double-mutant F518A_Q623ACa. Blow up shows residues that are in contact as space-filling models. h Comparison of the open conformation of the active subunits of N562ACa and F518A_Q623ACa. Pore-lining helices are shown as Cα-trace.
Fig. 9
Fig. 9. Activation mechanisms.
Conformational differences between putative active and inactive conformations of the pore region in TMEM16F (a), TMEM16A (b) and nhTMEM16 (c) viewed from within the membrane (top) and from the extracellular side (bottom). Lines in (a) delineate membrane boundaries. Blue shaded areas indicate the sites of ion and lipid permeation. Helices are shown in unique colors. Spheres highlight Cα positions of selected residues: red, positions whose mutation stabilize the active state; blue, residues on α6 of TMEM16F interacting with α4 in the active state; green, glycine residues that are relevant for conformational changes. d Proposed model of ion and lipid permeation in TMEM16F. Left, schematic depiction of the inactive and the active conformation of TMEM16F facilitating ion and lipid conduction in a single conformation. The exposure of polar residues on the common permeation path at the extracellular entrance distorts the bilayer structure thereby facilitating lipid transport. This path diverges in the center of the membrane where ions permeate through an aqueous pore and lipids diffuse on the outside. Right, constricted part of the pore of TMEM16F defined in the structure F518HCa viewed from within the membrane. α-helices 4 and 6 forming the interaction region that seals the pore towards the membrane are shown as ribbon. The hypothetical location of a permeating lipid and an ion are indicated. The pore surface is colored according to the properties of contacting residues (blue for basic; red for acidic; green for polar).

Similar articles

Cited by

References

    1. Suzuki J, Umeda M, Sims PJ, Nagata S. Calcium-dependent phospholipid scrambling by TMEM16F. Nature. 2010;468:834–838. - PubMed
    1. Nagata S, Suzuki J, Segawa K, Fujii T. Exposure of phosphatidylserine on the cell surface. Cell Death Differ. 2016;23:952–961. - PMC - PubMed
    1. Bevers EM, Williamson PL. Getting to the Outer Leaflet: Physiology of Phosphatidylserine Exposure at the Plasma Membrane. Physiol. Rev. 2016;96:605–645. - PubMed
    1. Pedemonte N, Galietta LJ. Structure and function of TMEM16 proteins (anoctamins) Physiol. Rev. 2014;94:419–459. - PubMed
    1. Castoldi E, Collins PW, Williamson PL, Bevers EM. Compound heterozygosity for 2 novel TMEM16F mutations in a patient with Scott syndrome. Blood. 2011;117:4399–4400. - PubMed

Publication types