. 2022 Nov 5;13(1):6702.
doi: 10.1038/s41467-022-34328-z.

Diffusion MRI anisotropy in the cerebral cortex is determined by unmyelinated tissue features

Affiliations

Diffusion MRI anisotropy in the cerebral cortex is determined by unmyelinated tissue features

Colin Reveley et al. Nat Commun. .

Abstract

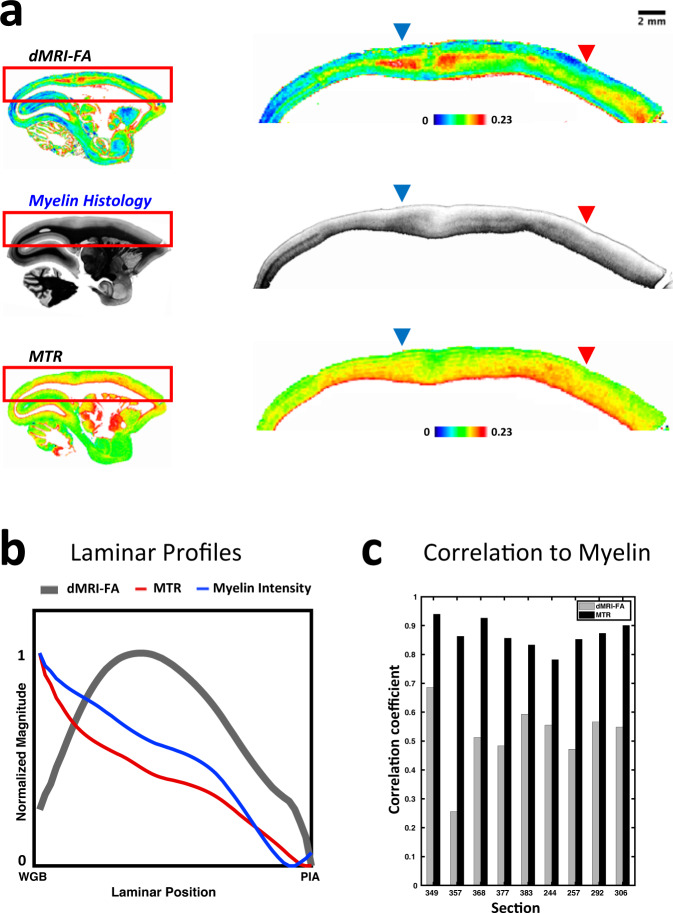
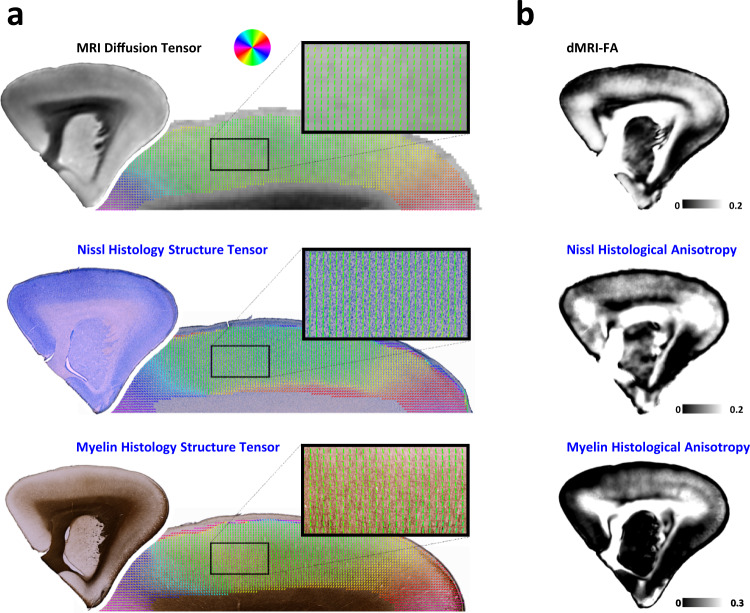
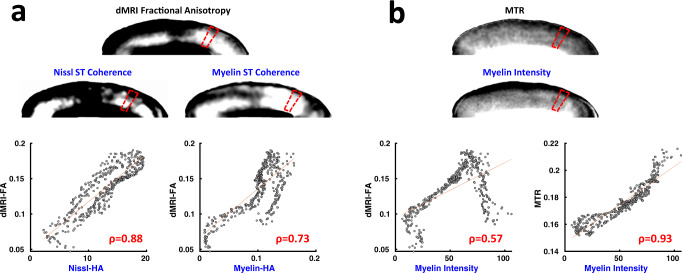
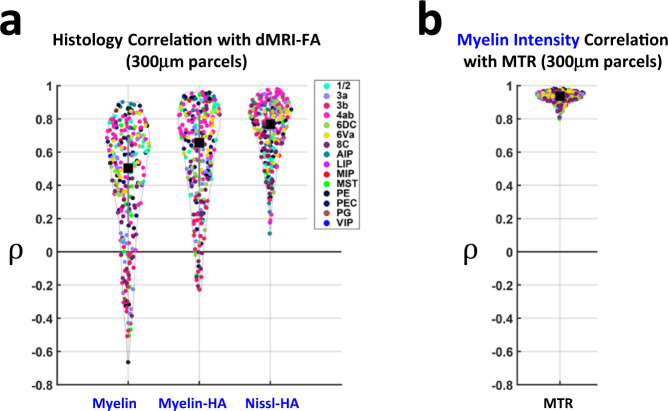
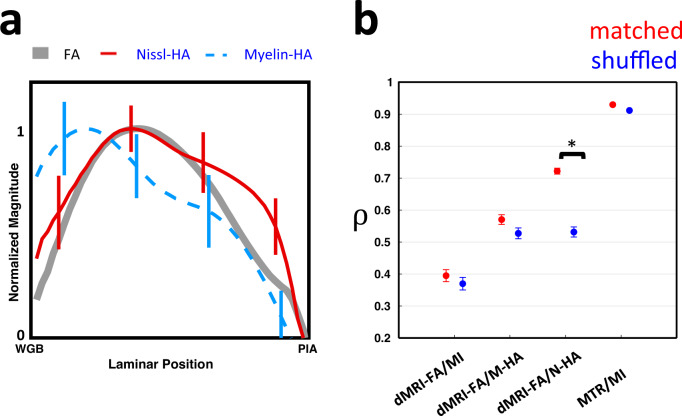
Diffusion magnetic resonance imaging (dMRI) is commonly used to assess the tissue and cellular substructure of the human brain. In the white matter, myelinated axons are the principal neural elements that shape dMRI through the restriction of water diffusion; however, in the gray matter the relative contributions of myelinated axons and other tissue features to dMRI are poorly understood. Here we investigate the determinants of diffusion in the cerebral cortex. Specifically, we ask whether myelinated axons significantly shape dMRI fractional anisotropy (dMRI-FA), a measure commonly used to characterize tissue properties in humans. We compared ultra-high resolution ex vivo dMRI data from the brain of a marmoset monkey with both myelin- and Nissl-stained histological sections obtained from the same brain after scanning. We found that the dMRI-FA did not match the spatial distribution of myelin in the gray matter. Instead dMRI-FA was more closely related to the anisotropy of stained tissue features, most prominently those revealed by Nissl staining and to a lesser extent those revealed by myelin staining. Our results suggest that unmyelinated neurites such as large caliber apical dendrites are the primary features shaping dMRI measures in the cerebral cortex.


Conflict of interest statement

The authors declare no competing interests.

Figures

Fig. 1
Fig. 1. Comparison of dMRI-FA to corresponding myelin histology and MTR MRI data obtained from the same tissue in the right hemisphere of marmoset monkey case P.
a Sagittal sections of dMRI-FA (top), Myelin histology (center), and MTR MRI (bottom). The spatial variation of dMRI-FA in vertical (laminar) and horizontal direction showed minimal correspondence with the pattern of myelin intensity, but the variation of the MTR MRI closely mirrored the myelin variation. In some regions of high myelination (dark colour in histology), the dMRI-FA was high (red arrow) whereas in others it was low (blue arrow). b Normalized average laminar profiles of FA, MTR and myelin intensity through the cortical thickness from roughly 100 μm above the white gray boundary (WGB) to roughly 100 μm below the pial surface (PIA) in the brain’s left hemisphere, derived from cortical parcellation (see Methods, Fig. 3). c Histogram of correlation coefficients between MRI variables and histological myelin intensity over the nine sections of coronal histology used in this study. MTR MRI shows much higher correspondence with myelin intensity than dMRI-FA does. Source data are provided as a source data file.
Fig. 2
Fig. 2. Properties of directional MRI and histology data.
For comparison with MRI data, the weighted structure tensor of the myelin and Nissl histology images was computed over a 150 μm area (see Methods). a Orientation data derived from Nissl and myelin histology and from dMRI are similar, showing columnar, vertically oriented vectors. The overall pattern of orientations in the gray matter is remarkably similar for the data computed from histology and from dMRI. b The right column shows dMRI-FA and nonlinearly registered histology anisotropy maps which show the degree of edge dispersion from the mean in 75 μm tiles (see Methods).
Fig. 3
Fig. 3. Example correlation of Histology and MRI variables sampled in columnar parcels.
a Comparison of dMRI fractional anisotropy to corresponding Nissl-HA and Myelin-HA from one parcel of corresponding tissue. b Comparison of magnetic transfer ratio (MTR) MRI contrast with myelin intensity in same parcel as a. In both a and b, the top row depicts nonlinearly co-registered histology parameter maps and MRI at 75 μm resolution. The red trapezoids indicate a columnar parcel example. The bottom row shows representative pixelwise scatter plots of the co-registered data within the sample parcel of cortex, and Pearson correlation (ρ) coefficients between histological variables and MRI variables. ST structure tensor. Source data are provided as a source sata file.
Fig. 4
Fig. 4. The distribution of correlation coefficients between histological parameters and dMRI-FA overall 393 parcels of cortex.
a correlations of histology variables to dMRI-FA, Myelin: min −0.66, Q1 0.18, median 0.47, Q3 0.69, max 0.9; Myelin-HA: min −0.23, Q1 0.39, median 0.64, Q3 0.83, max 0.96; Nissl-HA: min 0.11, Q1 0.61, median 0.76, Q3 0.87, max 0.98. b Correlation of MTR to Myelin Intensity: min 0.8, Q1 0.91, median 0.94, Q3 0.96, max 0.98. Each point in the distribution is the Pearson correlation between the variables sampled in a vertical parcel (see Methods). Colors indicate the anatomical region a parcel falls within. Black square shows median value and vertical gray bars show lower and upper quartiles. ρ indicates Pearson correlation coefficient. Each parcel is one of n = 393 independent samples from the marmoset cortex, spanning 18 distinct histological sections. Source data are provided as a source data file.
Fig. 5
Fig. 5. Average laminar profiles of FA, Nissl-HA, and myelin-HA across all parcels and the results of a spatial randomization condition to test the regional specificity of parcel-wise histology to MRI correlations.
The results show Nissl-HA more closely matches the laminar profile of dMRI-FA, and is more sensitive to shuffling of horizontal MRI locations. a Normalized laminar profiles of dMRI-FA, Myelin-HA, and Nissl-HA through the cortical thickness, from roughly 100 μm above the white/gray matter boundary (WGB) to roughly 100 μm below the pial surface (PIA), computed from the average of all columnar parcels (see Methods, Fig. 3). Bars indicate standard deviation. b The mean parcel correlation coefficients between MRI and histology variables from matched locations (see Fig. 4), and when the cortical parcels of the histology parameters and those of the dMRI-FA are shuffled between random horizontal locations. MI myelin intensity, N-HA Nissl-HA, M-HA myelin-HA. Bars indicate standard error. The star indicates significance under a two tailed paired t-test, p < 10−10. ρ indicates mean Pearson correlation coefficient. Each parcel is one of n = 393 biologically independent samples from the marmoset cortex, spanning 18 distinct histological sections. Source data are provided as a source data file.
Fig. 6
Fig. 6. MAP-2 immunohostochemistry labeled tissue data qualitatively matches the profiles of dMRI-FA and Nissl-HA.
a The stain reveals the larger apical dendrites and associated pyramidal cell bodies. b In layer 6 cell body orientations and dendrites are smaller and incoherently organized. c Layer 5 pyramidal cell bodies are larger, orientated vertically and project large vertical dendrites which bundle as they proceed into layer 4. d Cell bodies in layers 3 and 2 are smaller and apical dendrites less visble. MAP-2 staining carried out in one animal, these structures were representative of the n sections we stained. We examined 6 such sections which showed similar results.

References

    1. Aggarwal M, Nauen DW, Troncoso JC, Mori S. Probing region-specific microstructure of human cortical areas using high angular and spatial resolution diffusion MRI. Neuroimage. 2015;105:198–207. - PMC - PubMed
    1. Assaf Y. Imaging laminar structures in the gray matter with diffusion MRI. Neuroimage. 2019;197:677–688. - PubMed
    1. Leuze CWU, et al. Layer-specific intracortical connectivity revealed with diffusion MRI. Cereb. Cortex. 2014;24:328–339. - PMC - PubMed
    1. Truong T-K, Guidon A, Song AW. Cortical depth dependence of the diffusion anisotropy in the human cortical gray matter in vivo. PLoS ONE. 2014;9:e91424. - PMC - PubMed
    1. Kleinnijenhuis M, et al. Layer-specific diffusion weighted imaging in human primary visual cortex in vitro. Cortex. 2013;49:2569–2582. - PubMed

Publication types

MeSH terms