. 2022 Nov 5;13(1):6689.
doi: 10.1038/s41467-022-34514-z.

Epigenetic Alterations of Repeated Relapses in Patient-matched Childhood Ependymomas

Affiliations

Epigenetic Alterations of Repeated Relapses in Patient-matched Childhood Ependymomas

Sibo Zhao et al. Nat Commun. .

Erratum in

  • Publisher Correction: Epigenetic alterations of repeated relapses in patient-matched childhood ependymomas.
    Zhao S, Li J, Zhang H, Qi L, Du Y, Kogiso M, Braun FK, Xiao S, Huang Y, Li J, Teo WY, Lindsay H, Baxter P, Su JMF, Adesina A, Laczik M, Genevini P, Veillard AC, Schvartzman S, Berguet G, Ding SR, Du L, Stephan C, Yang J, Davies PJA, Lu X, Chintagumpala M, Parsons DW, Perlaky L, Xia YF, Man TK, Huang Y, Sun D, Li XN. Zhao S, et al. Nat Commun. 2022 Dec 22;13(1):7871. doi: 10.1038/s41467-022-35539-0. Nat Commun. 2022. PMID: 36550163 Free PMC article. No abstract available.

Abstract

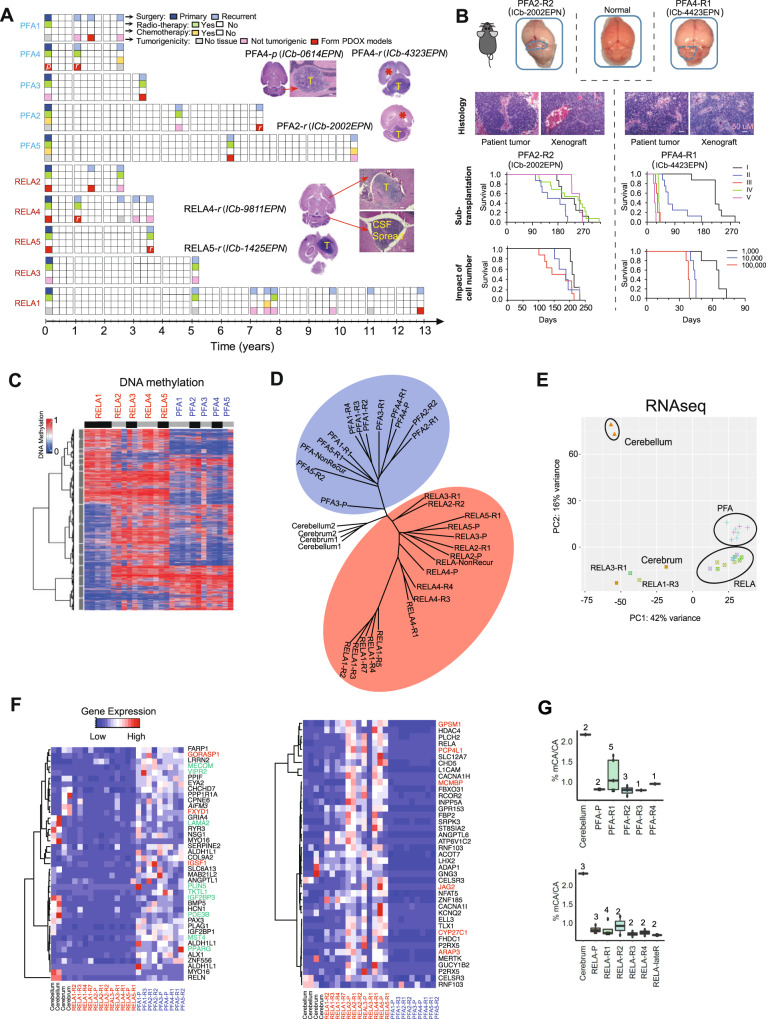
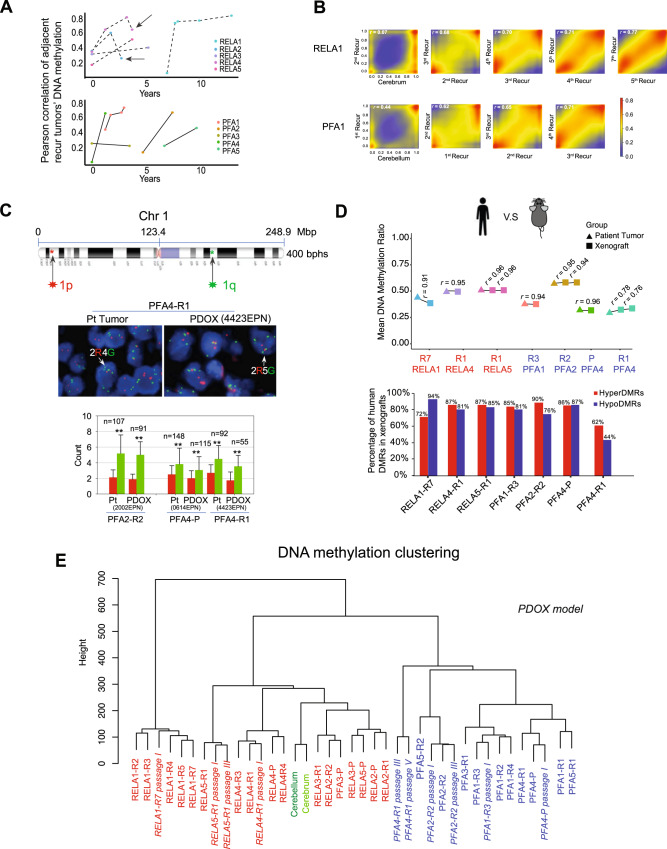
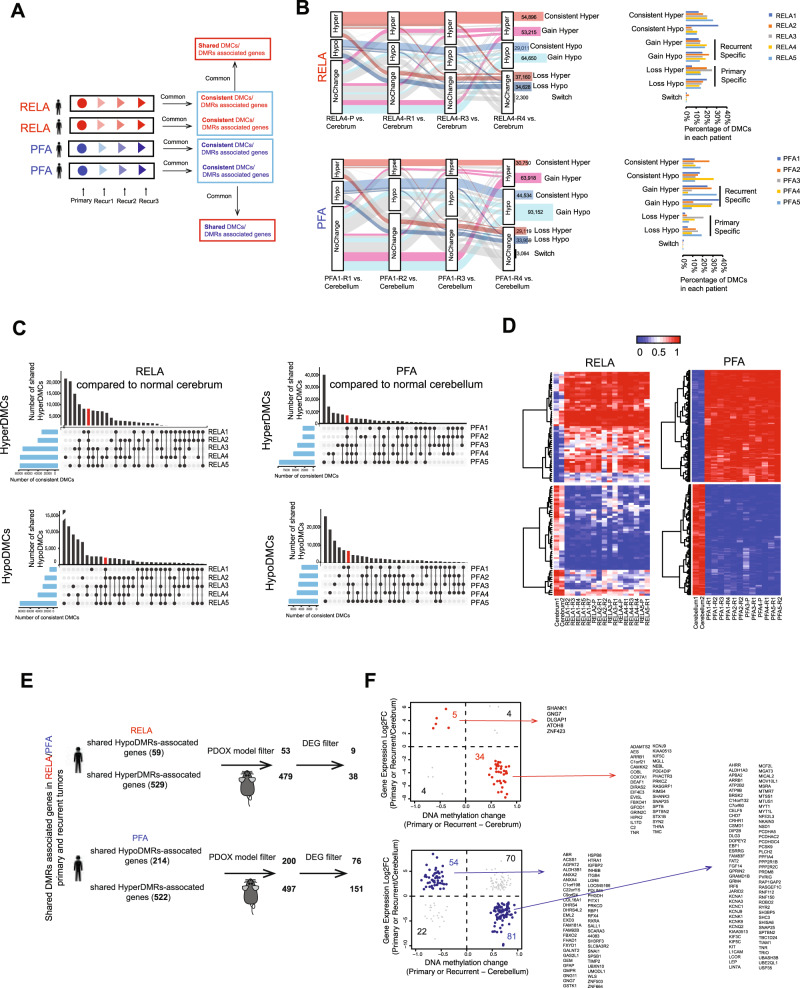
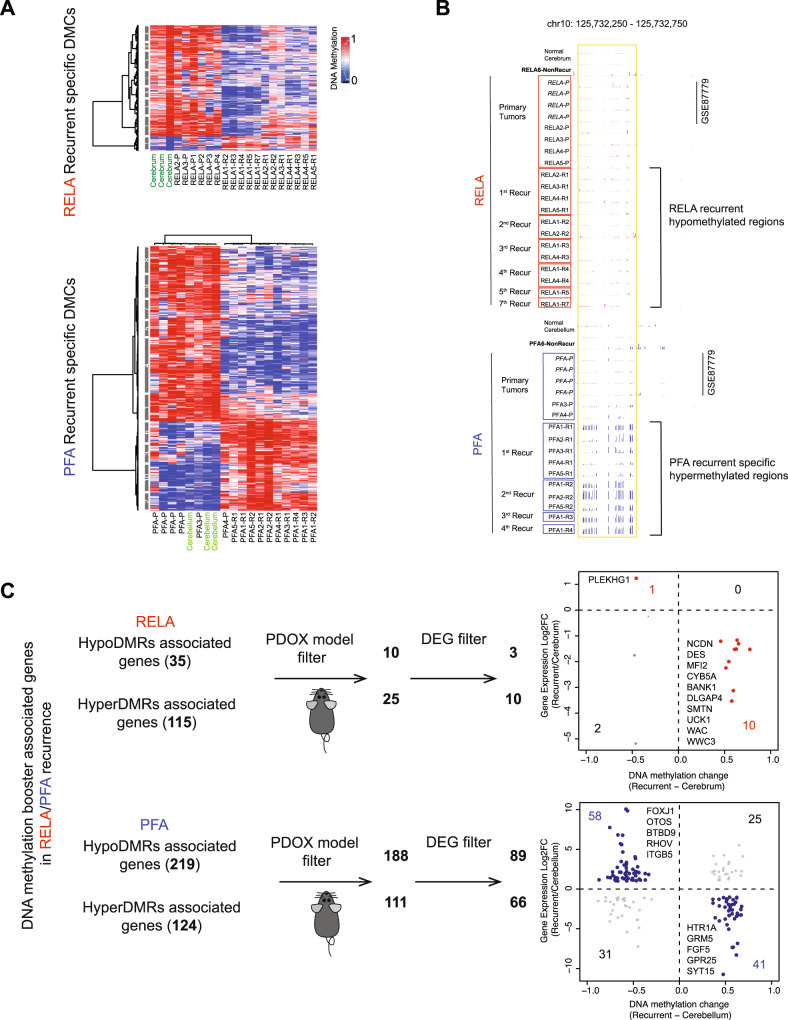
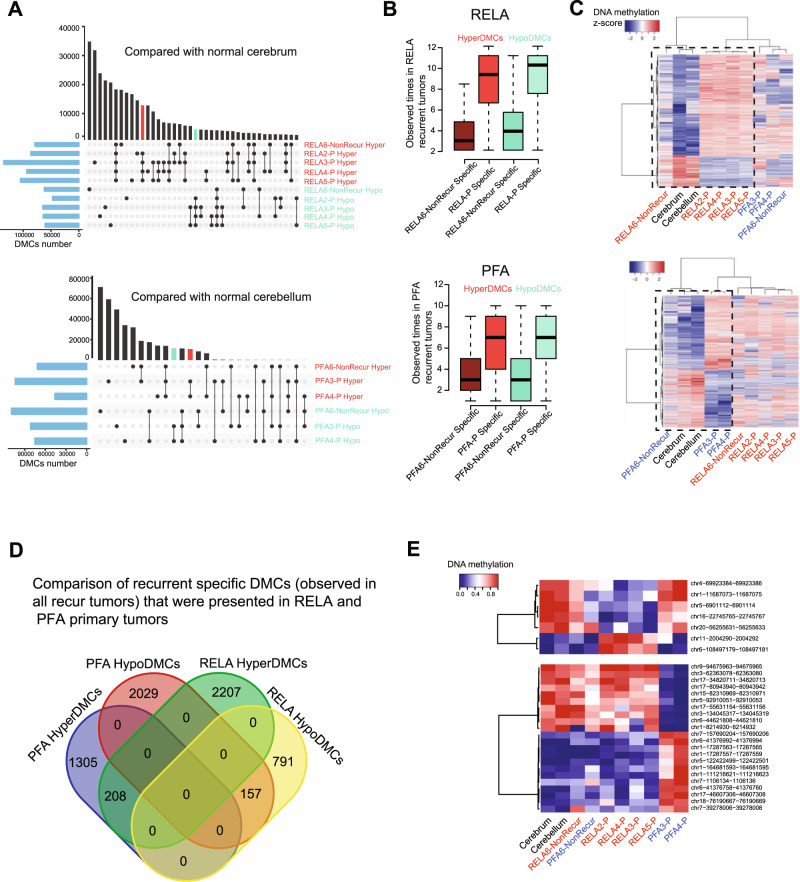
Recurrence is frequent in pediatric ependymoma (EPN). Our longitudinal integrated analysis of 30 patient-matched repeated relapses (3.67 ± 1.76 times) over 13 years (5.8 ± 3.8) reveals stable molecular subtypes (RELA and PFA) and convergent DNA methylation reprogramming during serial relapses accompanied by increased orthotopic patient derived xenograft (PDX) (13/27) formation in the late recurrences. A set of differentially methylated CpGs (DMCs) and DNA methylation regions (DMRs) are found to persist in primary and relapse tumors (potential driver DMCs) and are acquired exclusively in the relapses (potential booster DMCs). Integrating with RNAseq reveals differentially expressed genes regulated by potential driver DMRs (CACNA1H, SLC12A7, RARA in RELA and HSPB8, GMPR, ITGB4 in PFA) and potential booster DMRs (PLEKHG1 in RELA and NOTCH, EPHA2, SUFU, FOXJ1 in PFA tumors). DMCs predicators of relapse are also identified in the primary tumors. This study provides a high-resolution epigenetic roadmap of serial EPN relapses and 13 orthotopic PDX models to facilitate biological and preclinical studies.


Conflict of interest statement

M.L., P.G., A.-C.V., S.S., and G.B. were employees of Epigenetic Services, Diagenode, Liège, Belgium. The remaining authors declare no competing interests.

Figures

Fig. 1
Fig. 1. DNA methylation and transcriptomic landscape of recurrent ependymoma tumors.
A Time-course summary of surgery, radio- and chemotherapy treatment and tumorigenicity information of the 10 sets of recurrent ependymomas. Images of intra-cerebellar (ICb) and intra-cerebral (IC) orthotopic xenograft tumor formation from primary (p) or recurrent (r) PFA and RELA tumors (model ID in round brackets) were inserted to show tumor (T), hydrocephalus (*) and CSF spread. B Orthotopic xenograft mouse models of recurrent PFA EPNs. Tumor formation can be seen on gross (top) mouse brains (outlined). H&E staining (middle) showing histological comparison between the originating patient tumor and the PDOX tumors. Changes of animal survival times (lower panels) during serial in vivo transplanations of intra-cerebellar (ICb) PDOX models from passage I (I) to V (V) and the impact of the implanted different cell numbers (from 1000 cells per mouse to 100,000 cells) on animal survival times of two PDOX models were shown (n = 10 mice/group). Scale bar = 50 µM. C Heatmap showing the DNA methylation ratios of the top variable 20,000 CpGs across all EPN tumor samples. The patient ID is labeled vertically on the top of the heatmap. The black and gray bars under the patient IDs are used to separate tumors from the same patient. D Phylogeny tree construction using the top 6000 CpGs with variable DNA methylation ratios in RELA (red circle) and PFA (blue circle) tumors. E Principle component analysis of RNA-seq data from EPN tumor samples using age matched childhood normal brain tissues as references. F Heatmap representing the PFA (left) and RELA (right) primary tumor signature genes’ expression levels in all samples, including multiple relapses. The primary signature genes were selected from a previously published database GSE64415,,, and those overlapped with our consistently decreased (green) and increased (red) genes were highlighted. G CA methylation ratios in PFA (left) and RELA (lower) primary and recurrent tumors as compared with normal childhood cerebellar and cerebral tissues. Boxplots indicate median, first and third quartiles (Q1 and Q3), whiskers extend to the furthest values; the uppermost and lowest line indicates the maximum and minimum values, respectively. Marked on the top of each boxplot is the number of samples analyzed including Cerebellum (n = 2); Cerebrum (n = 3); PFA-P (n = 2); PFA-R1 (n = 5); PFA-R2 (n = 3); PFA-R3 (n = 1); PFA-R4 (n = 1); RELA-P (n = 3); RELA-R1 (n = 4); RELA-R2 (n = 2); RELA-R3 (n = 2); RELA-R4 (n = 2); RELA-lateR (n = 2).
Fig. 2
Fig. 2. Progressive convergence of DNA methylation profiles during repeated ependymoma relapses.
A Line charts showing the changes of DNA methylation correlations between adjacent recurrent tumors during repeated recurrences of RELA (upper panel) and PFA (lower panel) tumors. Each dot represents one tumor sample and graphed to the time of recurrence. B Representative smoothed density scatterplots displaying the increased correlation coefficient (r) of DNA methylation profiles between the adjacent recurrent tumors of RELA1 (upper panel) and PFA1 (lower panel) patients. C FISH analysis of chromosome 1q gain showing the locations of FISH probes in 1p (red) and 1q (green) (top), representative images of 1q (G: green) gain relative to 1p (R: red) (middle) in matching pairs of patients (Pt) and PDOX tumors. The number of cells counted (n) was marked on top of the column of every sample (red bar indicates 1p count, and green bar indicates 1q count). Statistical analysis was performed through two-sided Student t-test. **P < 0.01. P-values = 7.7186E-30 (Pt-2002), 5.32303E-34 (ICb-2002EPN), 1.17953E-13 (Pt-0614), 1.5575E-08 (ICb-0614EPN), 4.53091E-21 (Pt-4423), 5.4252E-14 (ICb-4423EPN). Data are presented as mean values ± SD. (Magnification:×100). D Preservation of DNA methylation profiles of patient tumors in their matching PDOX models either from the primary (P) or recurrent tumors from the first (R1) up to the 7th (R7) recurrences. Global Pearson correlation (r) of the DNA methylation profiles from the matched patient tumor and PDOX tumors were labeled above the connected line. The numbers of CpGs used in the correlation analysis were 2,211,714 (RELA1-R7), 2,156,125 (RELA4-R1), 2,075,950 (RELA5-R1), 1,994,148 (PFA1-R3), 2,473,879 (PFA2-R2), 1,728,999 (PFA4-P), and 1,200,936 (PFA4-R1). Majority of the patient DMRs were maintained in their matching PDOX tumors (lower panel). The total numbers of hyperDMRs that were used in the analysis in patient and PDOX tumors are 6919 and 6265 (RELA1-R7), 10,868 and 12,825 (RELA4-R1), 11,406 and 14,333 (RELA-R1)m 5815 and 6653 (PFA-R3), 13,541 and 15,036 (PFA2-R2), 4107 and 8309 (RFA4-P), 3155 and 8373 (RFA4-R1); whereas the total numbers of hypoDMRs were 15,147 and 27,594 (RELA1-R7), 5797 and 8506 (RELA4-R1), 4361 and 7009 (RELA-R1), 12,051 and 15,519 (PFA-R3), 5824 and 5847 (PFA2-R2), 5373 and 10,917 (RFA4-P), 8969 and 10,050 (RFA4-R1), respectively. E Unsupervised clustering of primary/recurrent tumors from the first (-R1) up to the 7th (-R7) relapse as well as matching PDOX tumors at specific passages (passage).
Fig. 3
Fig. 3. Identification of potential DNA methylation drivers for ependymoma relapse.
A Schematic illustration of dynamic analysis of time-course DNA methylation to identify consistent DMCs that were present from primary to all recurrent tumors in each individual patient, and the shared DMCs that were consistently present in all RELA or PFA patients. B Representative alluvia plots (left panel) showing the dynamic changes of DNA methylation for RELA4 (left upper panel) and PFA1 (left lower panel) tumors during repeated recurrences. Normal brain tissues were used as reference to determine the CpG status, i.e., Hyper-, Hypo-methylation and No Change. Seven different patterns (categories) and the numbers of CpG changes were listed with different colors. Graphs (right panel) showed percentages of the 7 different categories of CpG changes of each RELA (right upper panel) and PFA patient (right lower panel). C UpSet R plots showing the number of consistent Hyper- and HypoDMCs (y-axis) that were shared among RELA (left panels) and PFA patients (right panels) (connected dots with lines) as well as numbers of consistent DMCs for each patient (the horizonal histograms). Consistent DMCs that were shared by all RELA or PFA accounted for a small fraction and were highlighted in red, respectively. D Heatmaps showing the DNA hyper- (red) and hypo-methylation (blue) ratios of potential DNA methylation drivers (CpGs) for RELA (left panels) and PFA (right panels) recurrent tumors. E Schematic illustration of the data analysis steps to identify potential driver genes regulated by potential DNA methylation drivers. Differentially expressed genes (DEGs) (log2 fold change between tumor and normal tissues) were extracted from RNA-seq of the same set of tumors. DEGs discovered in patient tumors but absent in the matching PDOX tumors were filtered out to identity genes that contributed to PDOX tumorigenicity. F Correlation of expression and DNA methylation of potential genes were shown in the scatterplots for RELA (upper panel) and PFA (the lower panel). Those negatively correlated in RELA were highlighted in red (upper panel) and in PFA in blue (lower panel) and listed to the right of the plot.
Fig. 4
Fig. 4. Identification of potential DNA methylation booster of recurrent ependymoma.
A Heatmap showing the DMCs that were newly acquired in the recurrent (R) RELA (upper panel) and PFA (lower panel) tumors but absent in the primary (P) ependymomas. B Representative UCSC genome browser showing regions that was selectively hypermethylated in all recurrent tumors of a RELA recurrent tumors (n = 7) (upper panel) and PFA (n = 4) (lower panel) but not in their matching primary tumors. C Scheme showing the identification of recurrent-specific DMR (DNA methylation booster) associated genes. Hyper- and hypoDMR associated genes found in the patient tumors but not preserved in the matching PDOX models were filtered out. Differential expressions genes (DEGs) that were negatively correlated with DNA methylation were shown in the scatterplots with relative levels of change for RELA (red in upper panel) and PFA (blue in the lower panel) together with a list of top candidate genes.
Fig. 5
Fig. 5. Identification of DNA methylation predictors of recurrence in primary ependymoma tumors.
A UpSet R plot showing the hyper- and hypo-methylated CpGs sites (DMCs) in RELA (upper panel) and PFA (lower panel) primary tumors (-P) as compared with normal cerebrum or cerebellum tissues. The horizonal histogram represents the number of DMCs in each comparison between primary tumor and normal brain tissues; the vertical histogram represents the number of DMCs shared by tumors marked by connected dots. Red and green bar highlights the hyper- and hypoDMCs that were shared by all the tumors that eventually recurred (primary-tumorEventually recurred) but not in the normal brain tissues and the non-recurrent reference tumors. B Bar graph showing the frequencies of hyper- and hypoDMCs specific to ependymoma primary tumors that eventually recurred (-P-Specific) and that did not relapse (-NonRecur Specific) in the RELA recurrent (n = 12) and PFA (n = 10) recurrent tumors. Boxplots indicate median, first and third quartiles (Q1 and Q3), whiskers extend to the furthest values; the uppermost and lowest line indicates the maximum and minimum values, respectively. In RELA tumors, the numbers of HyperDMCs analyzed are RELA6- NonRecurSpecific (n = 10,309 CpGs), RELA-P-specific (n = 357,141 CpGs); wherease of the HypoDMCs are RELA6-NonRecurSpecific (n = 17,188 CpGs) and RELA-P-specific (n = 507,987 CpGs). In PFA tumors, the HyperDMCs analyzed are PFA6-NonRecurSpecific (n = 24,296 CpGs) and PFA-P-specific (n = 349,746 CpGs); and HypoDMCs PFA6NonRecurSpecific (n = 40,525 CpGs); PFA-P-specific (n = 451,426 CpGs). C Heatmap showing the DNA methylation ratios of DMCs specific to RELA (upper panel) or PFA (lower panel) primary tumorsEventually recurred exist in all recurrent tumors. Black dash box shows that these DMCs have similar DNA methylation ratios among RELA-/PFA-NonRecur primary tumor, normal cerebellum and cerebrum, but different from the primary tumors Eventually recurred. D Venn diagram representing the number of overlapped and specific hyper/hypoDMCs (from C) between RELA and PFA. E Heatmap showing the top CpGs’ DNA methylation ratios with highest confidence that can potentially predict recurrence from primary tumors of RELA (upper panel) and PFA (lower panel) ependymoma.

References

    1. Ritzmann, T. A. et al. A retrospective analysis of recurrent pediatric ependymoma reveals extremely poor survival and ineffectiveness of current treatments across central nervous system locations and molecular subgroups. Pediatr. Blood Cancer10.1002/pbc.28426 (2020). - PubMed
    1. Lee J, et al. Treatment outcome of anaplastic ependymoma under the age of 3 treated by intensity-modulated radiotherapy. Radiat. Oncol. J. 2020;38:26–34. doi: 10.3857/roj.2020.00073. - DOI - PMC - PubMed
    1. Gupta T, et al. Extent of re-excision, sequence/timing of salvage re-irradiation, and disease-free interval impact upon clinical outcomes in recurrent/progressive ependymoma. J. Neurooncol. 2020;147:405–415. doi: 10.1007/s11060-020-03434-7. - DOI - PubMed
    1. Sato M, et al. Progression-free survival of children with localized ependymoma treated with intensity-modulated radiation therapy or proton-beam radiation therapy. Cancer. 2017;123:2570–2578. doi: 10.1002/cncr.30623. - DOI - PubMed
    1. Junger, S. T., Timmermann, B. & Pietsch, T. Pediatric ependymoma: an overview of a complex disease. Childs Nerv. Syst. 10.1007/s00381-021-05207-7 (2021). - PMC - PubMed

Publication types

Supplementary concepts