. 2022 Nov 5;13(1):6668.
doi: 10.1038/s41467-022-34383-6.

Parent-of-Origin inference for biobanks

Affiliations

Parent-of-Origin inference for biobanks

Robin J Hofmeister et al. Nat Commun. .

Abstract

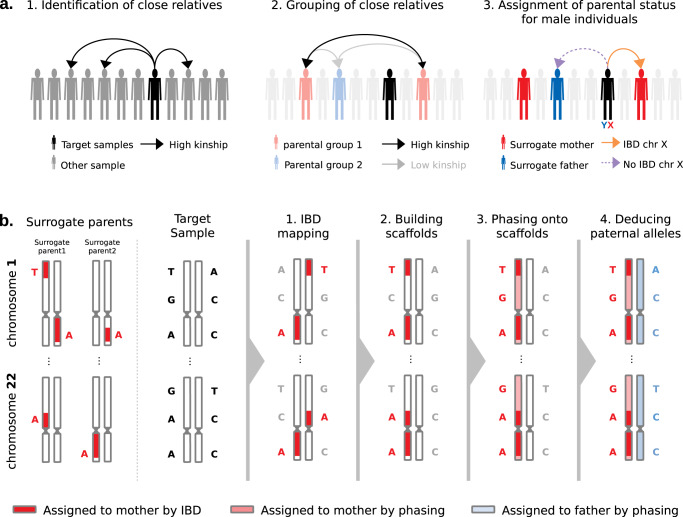
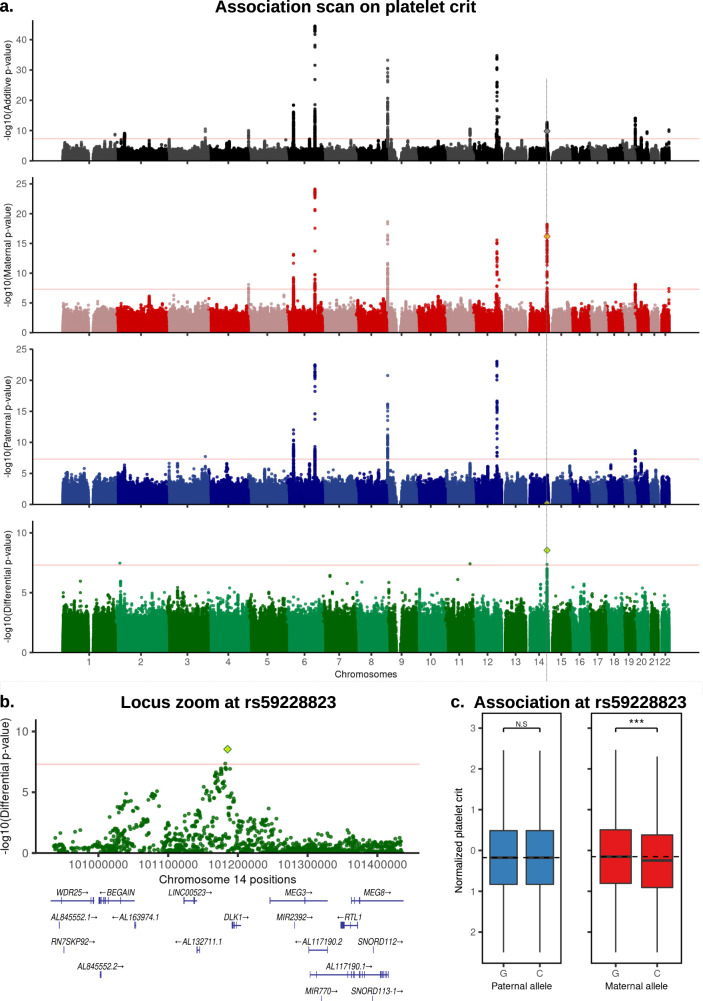
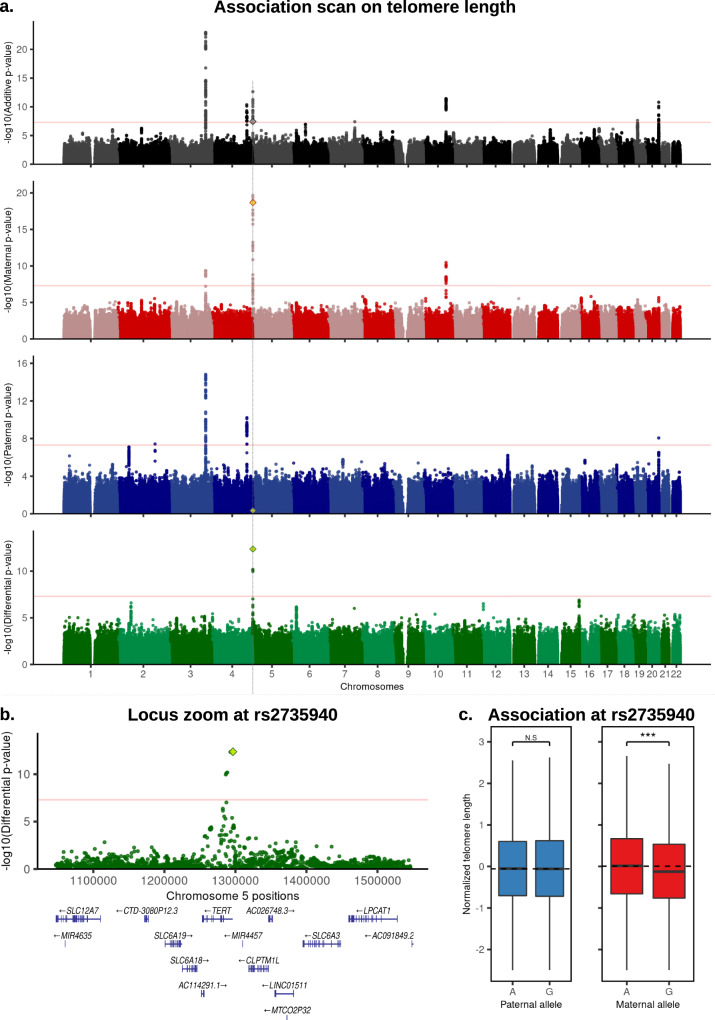
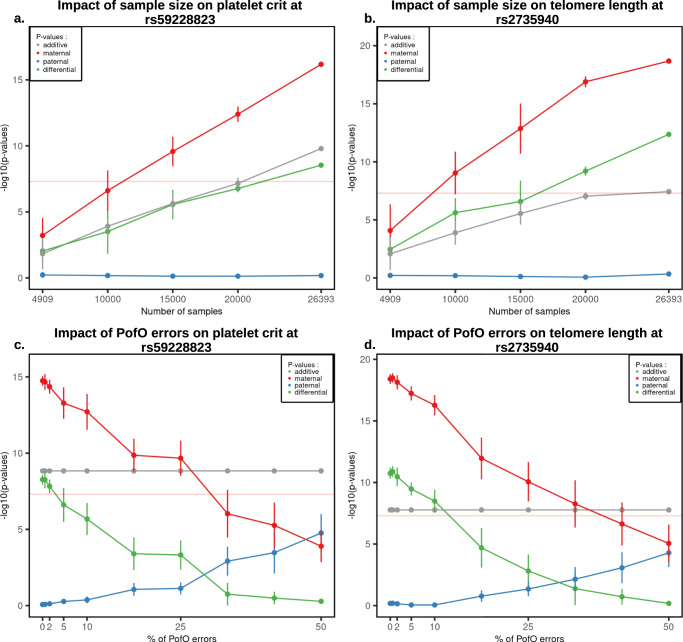
Identical genetic variations can have different phenotypic effects depending on their parent of origin. Yet, studies focusing on parent-of-origin effects have been limited in terms of sample size due to the lack of parental genomes or known genealogies. We propose a probabilistic approach to infer the parent-of-origin of individual alleles that does not require parental genomes nor prior knowledge of genealogy. Our model uses Identity-By-Descent sharing with second- and third-degree relatives to assign alleles to parental groups and leverages chromosome X data in males to distinguish maternal from paternal groups. We combine this with robust haplotype inference and haploid imputation to infer the parent-of-origin for 26,393 UK Biobank individuals. We screen 99 phenotypes for parent-of-origin effects and replicate the discoveries of 6 GWAS studies, confirming signals on body mass index, type 2 diabetes, standing height and multiple blood biomarkers, including the known maternal effect at the MEG3/DLK1 locus on platelet phenotypes. We also report a novel maternal effect at the TERT gene on telomere length, thereby providing new insights on the heritability of this phenotype. All our summary statistics are publicly available to help the community to better characterize the molecular mechanisms leading to parent-of-origin effects and their implications for human health.


Conflict of interest statement

The authors declare no competing interests.

Figures

Fig. 1
Fig. 1. Rationale of PofO inference.
a Identification of surrogate parents in 3 steps: (1) identification of close relatives for a target sample of interest using the pairwise kinship estimates, (2) clustering of close relatives by maximizing and minimizing the inter- and intra-groups relatedness, respectively, (3) assignment of parental status to close relatives’ groups (i.e., surrogate parents) using IBD sharing on chromosome X for male targets. b Parent-of-origin inference in 4 steps: (1) identification of autosomal IBD segments shared between the target and the surrogate parents, (2) scaffold construction with co-inherited alleles localized on the same homologous chromosome across all autosomes, (3) statistical phasing of all remaining alleles against the scaffold and (4) whole genome deduction of the maternal and paternal origins of alleles from phasing probabilities.
Fig. 2
Fig. 2. Validation of the PofO inference.
a Call rate (x-axis) and error rate (y-axis) as a function of (i) the minimal length of IBD tracks for scaffold construction and (ii) the minimal phasing probability used to call a heterozygote as phased. Each point corresponds to a given phasing probability threshold going from 0.5 (right most point) to 1.0 (left most point) with steps of 0.05. The grey arrow indicates the parameters we used in our analysis (3 cM long IBD tracks and 0.7 minimal phasing probability). b Call rate (left y-axis) and error rate (right y-axis) as a function of the composition of the parental groups (x-axis). The latter ranges from one parental group with one surrogate parent (left) to two parental groups comprising multiple surrogate parents (right). c Fraction of targets as a function of the composition of the parental groups (x-axis): in the validation data (N = 1399) in gray and in the call set (N = 21,484) in black. d Error rate (top panel; y-axis) and call rate (bottom panel; y-axis) per variant site as a function of their normalized positions relative to each telomere (x-axes). Red lines are fitted density curves. Error rates greater than 10% are capped to 11% as indicated by the dashed gray line. e Distribution of error rates per number of variant sites (y-axis, log scale). f Fraction of samples (purple) and heterozygotes (i.e., call rate; orange) in the call set for which PofO is inferred, as a function of chromosome length (cM, x-axis). Chromosome numbers are shown next to the points in black. Source data are provided as a Source Data file.
Fig. 3
Fig. 3. Association scans for PofO effects on platelet crit.
a Manhattan plots of four association scans with platelet crit. From top to bottom plots are shown results for additive (black), maternal (red), paternal (blue) and differential (green) scans. The lead variant mentioned in this study (rs59228823) is shown with a diamond. Red horizontal lines indicate genome-wide significance threshold at −log10(5 × 10−08). b Locus zoom at rs59228823 on the differential scan. c Box plot of the normalized platelet crit (y-axis) stratified by risk alleles and origin at SNP rs59228823; paternal in blue and maternal in red (x-axis). The horizontal dotted lines represent the phenotypic median of the major allele G. Boxes bound the 25th, 50th (median), and the 75th quantiles. Whiskers range from minima (lower) to maxima (upper). Sample sizes are npaternal(G/C) = 16,285/4,769 and nmaternal(G/C) = 16,368/4686 individuals. N.S non-significant (p-value = 0.66); ***=significant (p-value = 6.6 × 10−17) (computed with BOLT-LMM). Source data for (a) and (b) are provided as a Source Data file.
Fig. 4
Fig. 4. Association scans for PofO effects on telomere length.
a Manhattan plots of four association scans with telomere length. From top to bottom plots are shown results for additive (black), maternal (red), paternal (blue) and differential (green) models. The lead variant mentioned in this study (rs2735940) is shown with a diamond. Red horizontal lines indicate genome-wide significance threshold at −log10(5 × 10−08). b Locus zoom at rs2735940 on the differential scan. c Box plot of the normalized telomere length (y-axis) stratified by risk alleles and origin at SNP rs2735940; paternal in blue and maternal in red (x-axis). The horizontal dotted lines represent the phenotypic median of the major allele A. Boxes bound the 25th, 50th (median), and the 75th quantile. Whiskers range from minima (lower) to maxima (upper). Sample sizes are npaternal(A/G) = 10,627/10,337 and nmaternal(A/G) = 10,635/10,329 individuals. N.S non-significant (p-value = 0.46); *** = significant (p-value = 2.1 × 10−19) (computed with BOLT-LMM). Source data for (a) and (b) are provided as a Source Data file.
Fig. 5
Fig. 5. Robustness of the PofO testing.
a, b Association strength as −log10(p-value) for rs59228823 and rs2735940 (y-axis) on platelet crit and TL, respectively, as a function of the number of randomly chosen samples included in the analysis under the additive (black), paternal (blue), maternal (red) and differential (green) scans. Each point for N = [10,000; 15,000; 20,000] represents the median p-value obtained after 10 randomizations with vertical bars representing the standard error. Points for N = 4909 and N = 26,393 represent the p-values obtained using only the samples with genotyped parents and using our full sample size, respectively. c, d Association strength as −log10(p-value) for rs59228823 and rs2735940 (y-axis) on platelet crit and TL, respectively, as a function of the fraction of samples for which PofO has been randomly drawn (x-axis, 100% = 26,393). Samples included are those for which the PofO has been inferred from the surrogate parents. Each point represents the median p-value obtained after 10 randomizations with vertical bars representing the standard errors. P-values are computed with BOLT-LMM. Source data are provided as a Source Data file.

References

    1. Tucci V, Isles AR, Kelsey G, Ferguson-Smith AC, Erice Imprinting G. Genomic imprinting and physiological processes in mammals. Cell. 2019;176:952–965. - PubMed
    1. Lawson HA, Cheverud JM, Wolf JB. Genomic imprinting and parent-of-origin effects on complex traits. Nat. Rev. Genet. 2013;14:609–617. - PMC - PubMed
    1. Kacem S, Feil R. Chromatin mechanisms in genomic imprinting. Mamm. Genome. 2009;20:544–556. - PubMed
    1. Barlow DP. Competition-a common motif for the imprinting mechanism? EMBO J. 1997;16:6899–6905. - PMC - PubMed
    1. Poole RL, et al. Beckwith-Wiedemann syndrome caused by maternally inherited mutation of an OCT-binding motif in the IGF2/H19-imprinting control region, ICR1. Eur. J. Hum. Genet. 2012;20:240–243. - PMC - PubMed

Publication types