. 2022 Nov 5;12(1):18760.
doi: 10.1038/s41598-022-23502-4.

Label-free third harmonic generation imaging and quantification of lipid droplets in live filamentous fungi

Affiliations

Label-free third harmonic generation imaging and quantification of lipid droplets in live filamentous fungi

Tanja Pajić et al. Sci Rep. .

Abstract

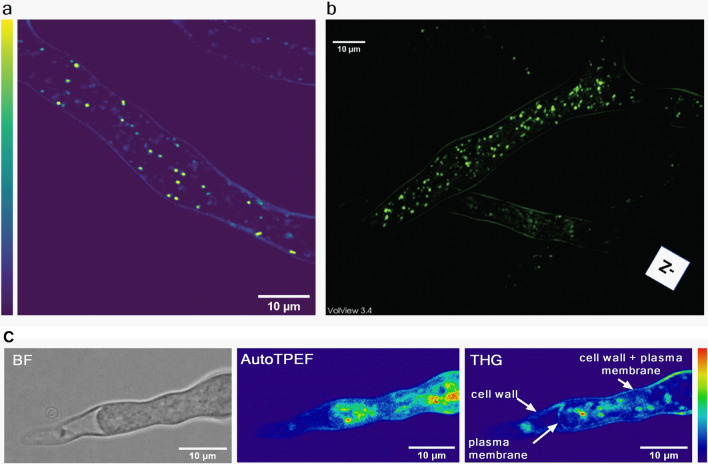
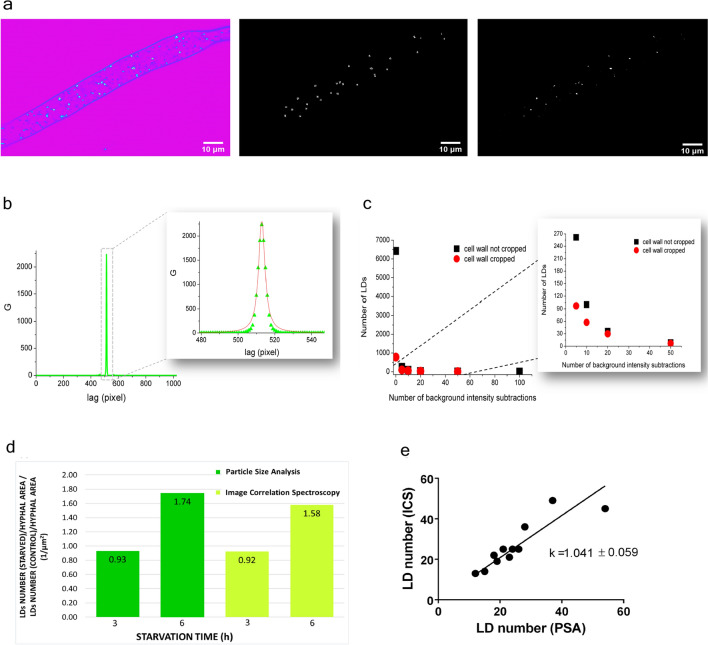
We report the utilization of Third-Harmonic Generation microscopy for label-free live cell imaging of lipid droplets in the hypha of filamentous fungus Phycomyces blakesleeanus. THG microscopy images showed bright spherical features dispersed throughout the hypha cytoplasm in control conditions and a transient increase in the number of bright features after complete nitrogen starvation. Colocalization analysis of THG and lipid-counterstained images disclosed that the cytoplasmic particles were lipid droplets. Particle Size Analysis and Image Correlation Spectroscopy were used to quantify the number density and size of lipid droplets. The two analysis methods both revealed an increase from 16 × 10-3 to 23 × 10-3 lipid droplets/µm2 after nitrogen starvation and a decrease in the average size of the droplets (range: 0.5-0.8 µm diameter). In conclusion, THG imaging, followed by PSA and ICS, can be reliably used for filamentous fungi for the in vivo quantification of lipid droplets without the need for labeling and/or fixation. In addition, it has been demonstrated that ICS is suitable for THG microscopy.


Conflict of interest statement

The authors declare no competing interests.

Figures

Figure 1
Figure 1
The outline of experimental design of nitrogen starvation. Hyphae cultures are grown in control conditions (Control culture) or in nitrogen-depleted medium (N-starved culture). Time points of sampling are marked as blue dots.
Figure 2
Figure 2
NLSM setup. Ti:Sa—laser for TPEF imaging, Yb:KGW—laser for TPEF and THG imaging, BC—beam combiner, L1 and L2—lenses of 1:1 beam expander for recollimation, VNDF—variable neutral density filter, GSM—galvanometer-scanning mirrors, L3 and L4—lenses of 1:3.75 beam expander for imaging, MDM—main dichroic mirror (cut-off 700 nm), Obj.—microscopic objective 40 × 1.3,  Sam.—sample, Con.—aspheric condenser lens, DM—dichroic mirrors reflective for THG (347 nm) and transmissive for Yb laser (1040 nm), F1—Hoya glass UV filter, peak transmission 340 nm, F2—bandpass filter 275–375 nm, L6—focusing lens, THG PMT—photomultiplier tube for THG signal, TL—tube lens, BS/M—beam splitter or mirror toggle, Cam.—camera, F—VIS filter 400–700 nm for autofluorescence or VIS + 570 nm long pass for Nile Red fluorescence, L5—focusing lens, TPEF PMT—photomultiplier tube for TPEF signal, AD/DA—acquisition card. The scheme was created in Microsoft Power Point 2016 (https://www.microsoft.com/en-us/microsoft-365/powerpoint).
Figure 3
Figure 3
Label-free imaging of Phycomyces blakesleeanus hyphae from the exponential phase in SLM. (a) one THG slice; (b) 3D model built out of 23 THG slices 0.9 µm apart. The average laser power at sample plane was 23–26 mW. (c) Multimodal imaging: bright field (BF) (left), autoTPEF (middle) and THG (right) images of the same live unlabeled hypha. The hypha was plasmolyzed and the retracted plasma membrane is solely visible in the THG image. The average laser power at sample plane was 2.7 mW (TPEF) and 55 mW (THG). Color intensity bar for both, TPEF and THG signals: deep blue—the lowest signal, red the highest signal. All the images were taken with Zeiss 40 × 1.3 oil objective lens.
Figure 4
Figure 4
TPEF and THG images of Phycomyces blakesleeanus exponential growth phase hyphae in standard liquid medium show that the predominant source of spot wise THG signal are lipid droplets. (a) Merged autoTPEF and THG images of same unlabeled live hypha showing that there is no overlap of autoTPEF and THG signal. The average laser power at sample plane was 28 mW at 1040 nm (for THG) and 3.4 mW at 730 nm (autoTPEF). (b) In vivo colocalization of stained LDs imaged by TPEF and LDs imaged by THG modality. Average laser power at sample plane was 32 mW for both THG and TPEF at 1040 nm. Pearson’s correlation coefficient Rtotal = 0.844 (ImageJ, The Colocalization Threshold plugin). All images were taken with Zeiss 40 × 1.3 oil objective lens.
Figure 5
Figure 5
THG images of N-starved hyphae. (a) control hyphae; (b) N-starved (4.5 h duration of growth in nitrogen-depleted conditions). Both images were taken with Zeiss 40 × 1.3 objective lens whilst average laser power at sample plane was 24 mW (in A) and 20 mW (in B). Violet-lowest THG signal, yellow—highest THG signal.
Figure 6
Figure 6
Image Correlation Spectroscopy (ICS) and Particle Size Analysis (PSA) on THG images. (a) Processing for PSA and ICS analysis of the same THG image. Left: The unprocessed THG image of Phycomyces blakesleeanus exponential growth phase hyphae in standard liquid medium; middle: 8-bit mask obtained in Particle size analysis; right: background subtracted image for ICS analysis. The image from left (unprocessed THG image) was processed by applying 20 × background subtractions. Both images are displayed at full dynamic range (8 bits). THG image was taken with Zeiss 40 × 1.3 objective lens, while average laser power at sample plane was 27 mW. (b) ICS analysis: The autocorrelation function (G curve) taken as the plot through the center of intensity correlated THG image of a live and unlabeled hyphae. The autocorrelation curve was fit to a Lorentzian function to extract FWHM value as described in Methods section. (c) ICS analysis, the effect of the cell wall removal: The number of LDs obtained from the G curves after each background subtraction for the THG image where the cell wall was manually cropped (red circles) and for the same THG image where cell wall was not cropped prior to the background subtractions (black squares). (d) Comparison of ICS- and PSA—derived data obtained from the same set of THG images of cultures N-starved for 3 h and 6 h and their age-matched controls (n = 3 for each group). The ratio of the number of LDs per unit hyphal area, in N-starved hypha to the number of LDs per unit hypha area in age- matched controls. (e) The agreement of LD number quantification obtained by ICS and PSA. For each image, ICS-obtained LD number is plotted against PSA-obtained LD number for that image. Data for both graphs were obtained from label-free THG images, whose analysis is presented in Table 1.
Figure 7
Figure 7
Quantification of LDs from THG images of Phycomyces blaekseneanus hypha. Hypha were cultured without nitrogen or in standard liquid media for 2–6 h (or longer up to 8 h) after the start of treatment. Obtained THG images of LDs were analyzed by PA. n = 6 independent cultures. (a) N-starvation increases number of LDs per unit area. LD number obtained from the individual hypha is normalized to hypha area (in 103 µm2). Control (n = 44), N-starved group (n = 17). The box and whisker plots, enclosed by the 25th and 75th percentile range, median line with whiskers extending minimal to maximal value. Unpaired t test with Welch's correction, two tail, p = 0.0038. (b) Time course of LD number/unit area, showing that the increase of LD number by N-starvation is significant at 4.5 h (p = p = 0.0006) and later times (p = 0.0045), compared to corresponding control. Two-way ANOVA, with Holm-Sidac correction. Mean ± SE, n(Control) = 8; 7; 11; 21 for time points (in h), respectively: 2; 3; 4.5; 6. n(N-starved) = 6; 3; 7 for time points (in h), respectively: 3; 4.5; 6. (c) N-starvation decreases diameter of LDs. LD diameters from Control (n = 1205) and N-starved group (n = 431). The box and whisker plots, enclosed by the 25th and 75th percentile range, median line with whiskers extending minimal to maximal value. Mann–Whitney (p = 0.0008), two-tailed. (d) Time course of LD diameter changes, showing that the decrease by N-starvation is significant only at long starvation times. Two-way ANOVA, Holm-Sidac correction (p < 0.0001), compared to corresponding control. Mean ± SE, n(Control) = 176; 124; 302; 571 for time points (in h), respectively: 2; 3; 4.5; 6. n(N-starved) = 100; 118; 214 for time points (in h), respectively:3; 4.5; 6. (e) Differential distribution of increased number of LDs after 4.5 h and 6 h N-starvation. The largest LDs are lost at longest starvation times. Histograms of LD diameter distributions, 0.3 µm binning, for Control and N-starved group. Number of LDs in each bin of the histogram is divided by sum of hypha area of the appropriate group. Errors are calculated as stated in Methods section. Numbers on x axes represent the upper bin limit.

Similar articles

Cited by

References

    1. Weigelin B, Bakker GJ, Friedl P. Third harmonic generation microscopy of cells and tissue organization. J. Cell Sci. 2016;129:245–255. - PubMed
    1. Yelin D, Silberberg Y. Laser scanning third-harmonic-generation microscopy in biology. Opt. Express. 1999;5(8):169–175. - PubMed
    1. Barzda V, et al. Visualization of mitochondria in cardiomyocytes. Opt. Express. 2005;13:8263. - PubMed
    1. Witte S, et al. Label-free live brain imaging and targeted patching with third-harmonic generation microscopy. Proc. Natl. Acad. Sci. U. S. A. 2011;108:5970–5975. - PMC - PubMed
    1. Tsai C-K, et al. Imaging granularity of leukocytes with third harmonic generation microscopy. Biomed. Opt. Express. 2012;3:2234. - PMC - PubMed

Publication types