

Construction of N-7 methylguanine-related mRNA prognostic model in uterine corpus endometrial carcinoma based on multi-omics data and immune-related analysis
- PMID: 36335189
- PMCID: PMC9637130
- DOI: 10.1038/s41598-022-22879-6
Construction of N-7 methylguanine-related mRNA prognostic model in uterine corpus endometrial carcinoma based on multi-omics data and immune-related analysis
Abstract
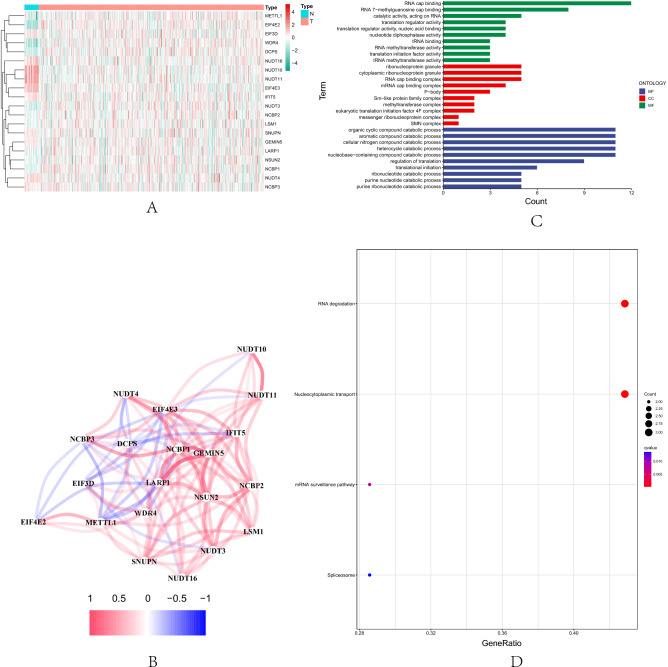
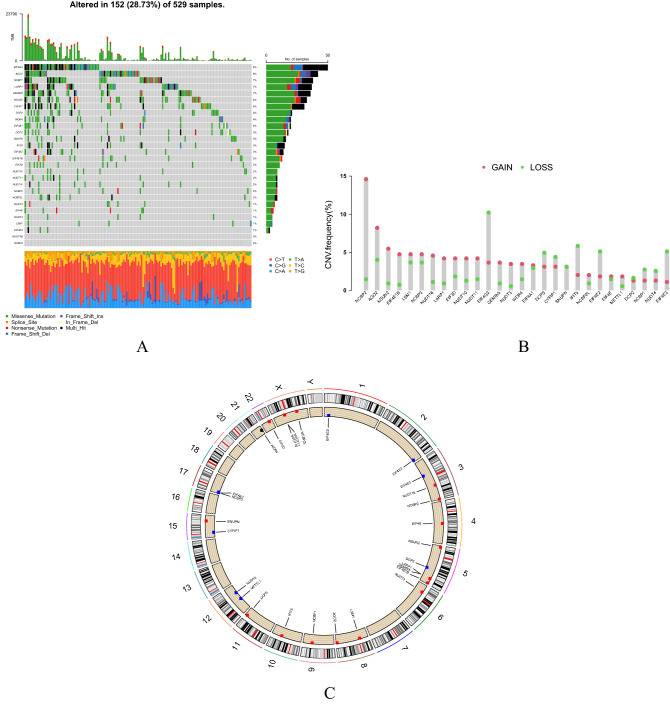
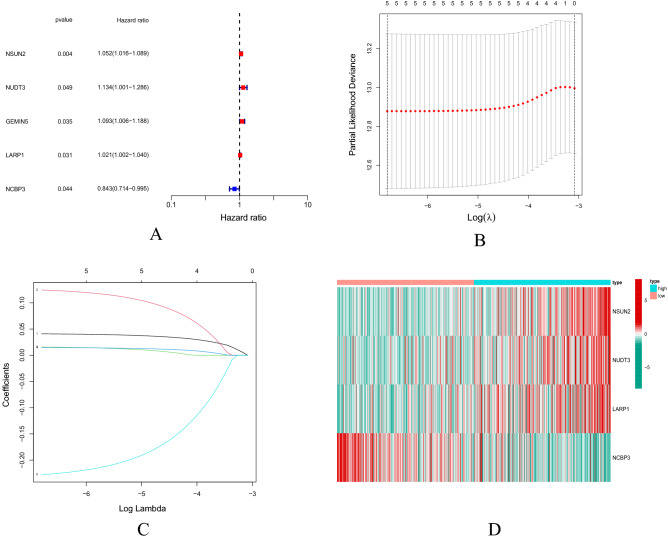
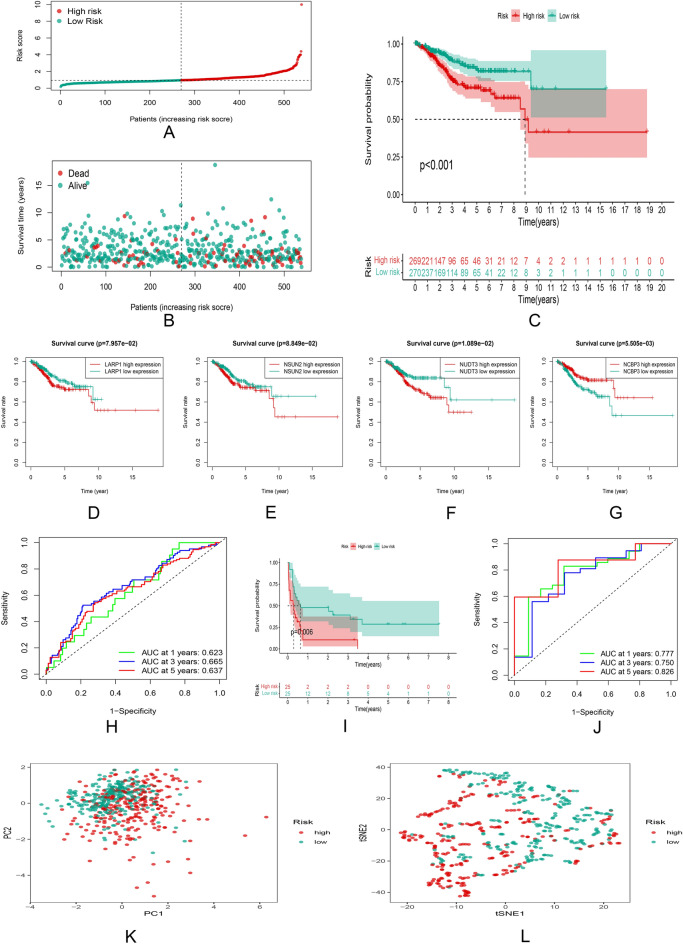
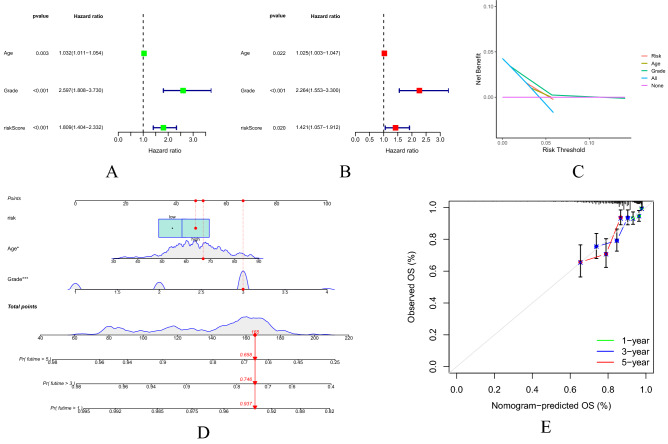
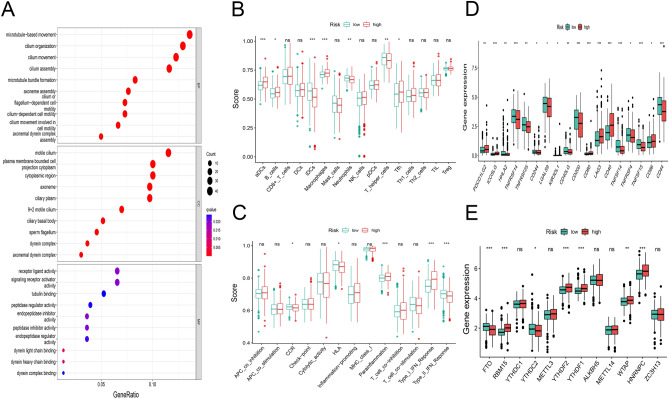
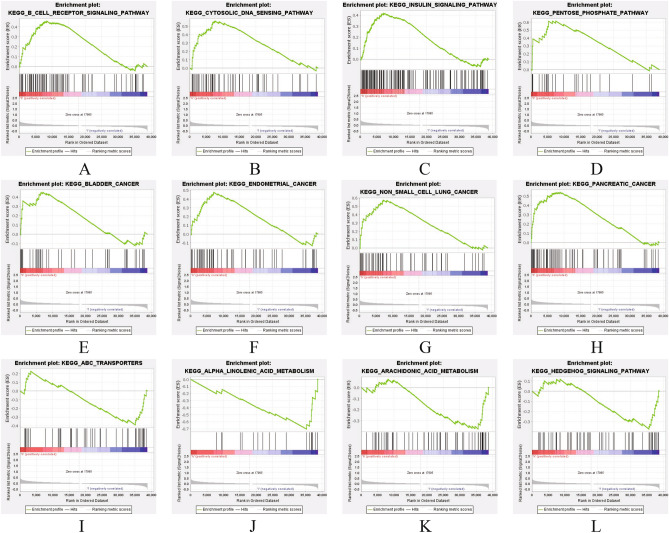
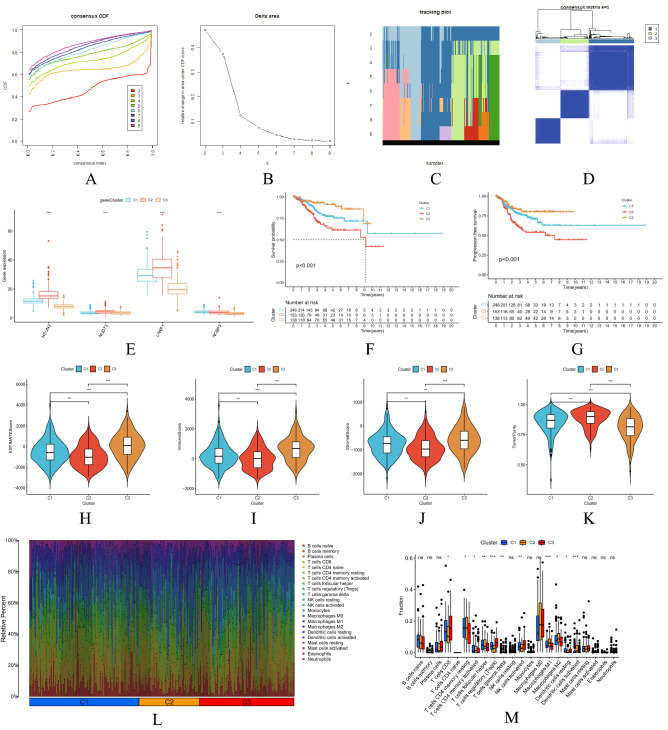
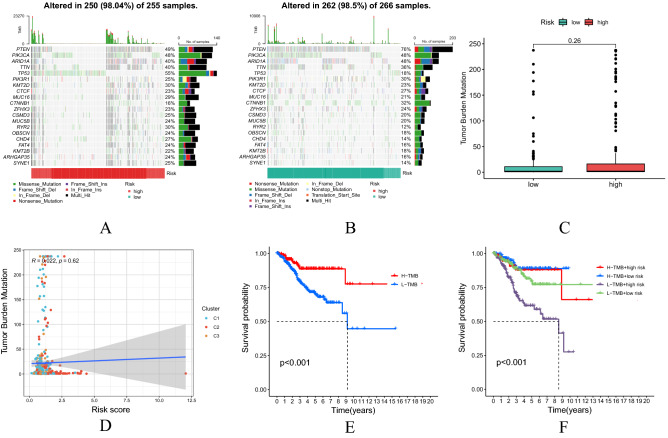
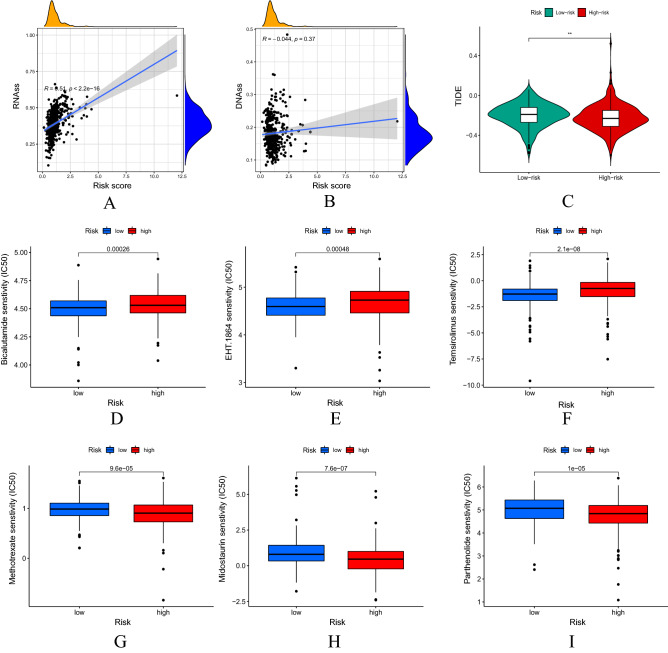
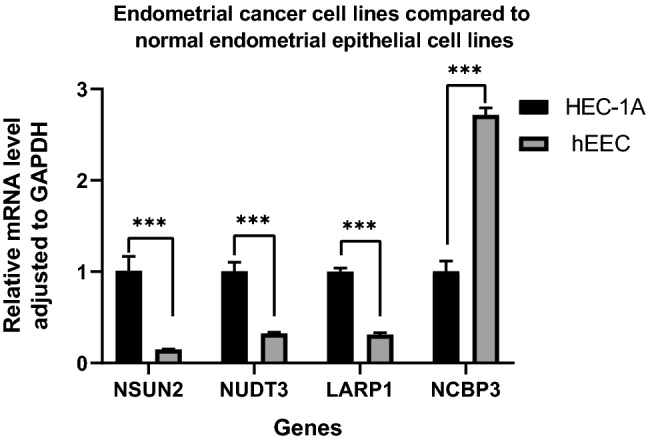
N-7 methylguanine (m7G) is one of the most common RNA base modifications in post-transcriptional regulation, which participates in multiple processes such as transcription, mRNA splicing and translation during the mRNA life cycle. However, its expression and prognostic value in uterine corpus endometrial carcinoma (UCEC) have not been systematically studied. In this paper, the data such as gene expression profiles, clinical data of UCEC patients, somatic mutations and copy number variants (CNVs) are obtained from the cancer genome atlas (TCGA) and UCSC Xena. By analyzing the expression differences of m7G-related mRNA in UCEC and plotting the correlation network maps, a risk score model composed of four m7G-related mRNAs (NSUN2, NUDT3, LARP1 and NCBP3) is constructed using least absolute shrinkage and selection operator (LASSO), univariate and multivariate Cox regression in order to identify prognosis and immune response. The correlation of clinical prognosis is analyzed between the m7G-related mRNA and UCEC via Kaplan-Meier method, receiver operating characteristic (ROC) curve, principal component analysis (PCA), t-SNE, decision curve analysis (DCA) curve and nomogram etc. It is concluded that the high risk is significantly correlated with (P < 0.001) the poorer overall survival (OS) in patients with UCEC. It is one of the independent risk factors affecting the OS. Differentially expressed genes are identified by R software in the high and low risk groups. The functional analysis and pathway enrichment analysis have been performed. Single sample gene set enrichment analysis (ssGSEA), immune checkpoints, m6A-related genes, tumor mutation burden (TMB), stem cell correlation, tumor immune dysfunction and rejection (TIDE) scores and drug sensitivity are also used to study the risk model. In addition, we have obtained 3 genotypes based on consensus clustering, which are significantly related to (P < 0.001) the OS and progression-free survival (PFS). The deconvolution algorithm (CIBERSORT) is applied to calculate the proportion of 22 tumor infiltrating immune cells (TIC) in UCEC patients and the estimation algorithm (ESTIMATE) is applied to work out the number of immune and matrix components. In summary, m7G-related mRNA may become a potential biomarker for UCEC prognosis, which may promote UCEC occurrence and development by regulating cell cycles and immune cell infiltration. It is expected to become a potential therapeutic target of UECE.
© 2022. The Author(s).
Conflict of interest statement
The authors declare no competing interests.
Figures
Similar articles
-
Development and Clinical Validation of Novel 8-Gene Prognostic Signature Associated With the Proportion of Regulatory T Cells by Weighted Gene Co-Expression Network Analysis in Uterine Corpus Endometrial Carcinoma.Front Immunol. 2021 Dec 14;12:788431. doi: 10.3389/fimmu.2021.788431. eCollection 2021. Front Immunol. 2021. PMID: 34970268 Free PMC article.
-
Prognostic signature construction and immunotherapy response analysis for Uterine Corpus Endometrial Carcinoma based on cuproptosis-related lncRNAs.Comput Biol Med. 2023 Jun;159:106905. doi: 10.1016/j.compbiomed.2023.106905. Epub 2023 Apr 11. Comput Biol Med. 2023. PMID: 37060773
-
A 7-lncRNA signature predict prognosis of Uterine corpus endometrial carcinoma.J Cell Biochem. 2019 Oct;120(10):18465-18477. doi: 10.1002/jcb.29164. Epub 2019 Jun 6. J Cell Biochem. 2019. PMID: 31168849
-
Identification and validation of hub genes in uterine corpus endometrioid carcinoma: An observational study from TCGA and GEO.Medicine (Baltimore). 2025 May 2;104(18):e42338. doi: 10.1097/MD.0000000000042338. Medicine (Baltimore). 2025. PMID: 40324248 Free PMC article.
-
LINC01589 serves as a potential tumor-suppressor and immune-related biomarker in endometrial cancer: A review.Medicine (Baltimore). 2023 Apr 14;102(15):e33536. doi: 10.1097/MD.0000000000033536. Medicine (Baltimore). 2023. PMID: 37058060 Free PMC article. Review.
Cited by
-
Deciphering the molecular landscape: integrating single-cell transcriptomics to unravel myofibroblast dynamics and therapeutic targets in clear cell renal cell carcinomas.Front Immunol. 2024 Mar 18;15:1374931. doi: 10.3389/fimmu.2024.1374931. eCollection 2024. Front Immunol. 2024. PMID: 38562930 Free PMC article.
-
Innovative strategies to optimise colorectal cancer immunotherapy through molecular mechanism insights.Front Immunol. 2024 Dec 9;15:1509658. doi: 10.3389/fimmu.2024.1509658. eCollection 2024. Front Immunol. 2024. PMID: 39717768 Free PMC article.
-
Critical roles and clinical perspectives of RNA methylation in cancer.MedComm (2020). 2024 May 7;5(5):e559. doi: 10.1002/mco2.559. eCollection 2024 May. MedComm (2020). 2024. PMID: 38721006 Free PMC article. Review.
-
Single-cell RNA sequencing revealed PPARG promoted osteosarcoma progression: based on osteoclast proliferation.Front Immunol. 2025 Jan 28;15:1506225. doi: 10.3389/fimmu.2024.1506225. eCollection 2024. Front Immunol. 2025. PMID: 39936154 Free PMC article.
-
Characterizing tumor biology and immune microenvironment in high-grade serous ovarian cancer via single-cell RNA sequencing: insights for targeted and personalized immunotherapy strategies.Front Immunol. 2025 Jan 17;15:1500153. doi: 10.3389/fimmu.2024.1500153. eCollection 2024. Front Immunol. 2025. PMID: 39896800 Free PMC article.
References
Publication types
MeSH terms
Substances
LinkOut - more resources
Full Text Sources
Miscellaneous
